Origin and Pathways of Dissolved Organic Carbon in a Small Catchment in the Lena River Delta
 Lydia Stolpmann1,2*
  Gesine Mollenhauer3
  Anne Morgenstern1
  Jens S. Hammes4
  Julia Boike1,5
  Pier Paul Overduin1
  Guido Grosse1,2
- 1Permafrost Research Section, Alfred Wegener Institute Helmholtz Centre for Polar and Marine Research, Potsdam, Germany
- 2Institute of Geosciences, University of Potsdam, Potsdam, Germany
- 3Marine Geochemistry Section, Alfred Wegener Institute Helmholtz Centre for Polar and Marine Research, Bremerhaven, Germany
- 4Institute of Geosciences, University of Bonn, Bonn, Germany
- 5Geography Department, Humboldt-University Berlin, Berlin, Germany
The Arctic is rich in aquatic systems and experiences rapid warming due to climate change. The accelerated warming causes permafrost thaw and the mobilization of organic carbon. When dissolved organic carbon is mobilized, this DOC can be transported to aquatic systems and degraded in the water bodies and further downstream. Here, we analyze the influence of different landscape components on DOC concentrations and export in a small (6.45 km2) stream catchment in the Lena River Delta. The catchment includes lakes and ponds, with the flow path from Pleistocene yedoma deposits across Holocene non-yedoma deposits to the river outlet. In addition to DOC concentrations, we use radiocarbon dating of DOC as well as stable oxygen and hydrogen isotopes (δ18O and δD) to assess the origin of DOC. We find significantly higher DOC concentrations in the Pleistocene yedoma area of the catchment compared to the Holocene non-yedoma area with medians of 5 and 4.5 mg L−1 (p < 0.05), respectively. When yedoma thaw streams with high DOC concentration reach a large yedoma thermokarst lake, we observe an abrupt decrease in DOC concentration, which we attribute to dilution and lake processes such as mineralization. The DOC ages in the large thermokarst lake (between 3,428 and 3,637 14C y BP) can be attributed to a mixing of mobilized old yedoma and Holocene carbon. Further downstream after the large thermokarst lake, we find progressively younger DOC ages in the stream water to its mouth, paired with decreasing DOC concentrations. This process could result from dilution with leaching water from Holocene deposits and/or emission of ancient yedoma carbon to the atmosphere. Our study shows that thermokarst lakes and ponds may act as DOC filters, predominantly by diluting incoming waters of higher DOC concentrations or by re-mineralizing DOC to CO2 and CH4. Nevertheless, our results also confirm that the small catchment still contributes DOC on the order of 1.2 kg km−2 per day from a permafrost landscape with ice-rich yedoma deposits to the Lena River.
Introduction
The Arctic experienced an increase of averaged near-surface air temperatures by 3.1°C since the 1970s (AMAP, 2021), which is accompanied by warming of Arctic permafrost (Biskaborn et al., 2019). The Arctic is rich in aquatic systems, which interact with the thawing permafrost, and Arctic warming has a strong influence on biogeochemical processes in these aquatic systems (Frey and McClelland, 2009; Wik et al., 2016). In particular, ice-rich permafrost, such as yedoma, is prone to rapid thaw causing ground-ice melt and associated volume loss. As a result, the land surface subsides and landforms like thermo-erosional valleys, thaw slumps, and thermokarst lakes develop. Thermokarst lakes and drained lake basins may regionally occupy three quarters of the yedoma landscape surface (Jones et al., 2011; Grosse et al., 2013). The presence of thermokarst lakes accelerates the thaw of permafrost (Langer et al., 2016), which delivers freshly thawed sediments and organic matter into water bodies (Turetsky et al., 2020). Here, soil carbon (C) can be mobilized and enters aquatic systems as dissolved organic C (DOC) and particulate organic C (POC), whereas DOC, once mobilized, can be degraded microbially or photo-chemically and emitted to the atmosphere as C dioxide (CO2) and methane (CH4) (Frey & Smith, 2005; Battin et al., 2008; Tranvik et al., 2009; Vonk et al., 2013a,b). Lakes and especially thermokarst lakes release a significant amount of CO2 and CH4 and are biogeochemical hotspots since they act as turnover of organic C (Abnizova et al., 2012; Walter Anthony et al., 2016; Evans et al., 2017; Hughes-Allen et al., 2021). Since these processes may amplify climate change (Schuur et al., 2015), investigations of DOC contributions to C cycling in Arctic freshwater systems on different scales are necessary to understand and predict climate change impacts and permafrost region C cycle feedbacks.
From non-yedoma permafrost landscapes in western Siberia, we know that DOC concentration decreases during the formation of thermokarst lakes from thermokarst depressions to ponds and thermokarst lakes, and increases after lake drainage due to autochthonous DOC production (Manasypov et al., 2014). The DOC concentrations in surface waters in thermokarst dominated permafrost landscapes vary with size (e.g. lake surface area), vegetation density, hydrological connectivity, and water residence time (Evans et al., 2017). Hydrological connectivity and water residence time influence the re-mineralization of DOC by lake processes, such as photo-degradation, microbial activity, and/or flocculation. Therefore, lakes with short water residence time typically have higher DOC concentrations (Manasypov et al., 2015). A recent pan-Arctic synthesis study for DOC in permafrost lakes suggests that there are differences between yedoma and non-yedoma lakes and that lake DOC concentrations can be highly variable, likely based on local environmental factors (Stolpmann et al., 2021a). For Arctic rivers and streams, thawing permafrost may lead to a shift of DOC fluxes. Previous studies found increasing DOC mobilization due to permafrost thaw (Frey and Smith, 2005; Guo et al., 2007; Drake et al., 2015; Mann et al., 2015; Spencer et al., 2015), and Littlefair et al. (2017) highlight the high variation of DOC mobilization in permafrost thaw-affected landscapes on a regional scale. (Kokelj et al., 2005). found that thermokarst, such as thaw slumping, regionally results in DOC mobilization decrease. Contrastingly, Spencer et al. (2015) found increasing DOC mobilization due to thermokarst processes, which suggests that the amount of mobilized DOC depends on the composition of the eroding material in different permafrost landscapes. In regions underlain by yedoma deposits, a rapid loss of ancient DOC was observed in connection with DOC age, bioavailability, and metabolism (Mann et al., 2015; Spencer et al., 2015). For the Siberian Kolyma River basin, incubation experiments showed microbial utilization of ancient organic C (OC) resulting in decreasing DOC concentrations and younger Δ14C signatures downstream (Mann et al., 2015). The latter was confirmed by Rogers et al. (2021), highlighting the export of predominantly modern DOC to the Kolyma River. In contrast, Mann et al. (2015) found that small yedoma thaw streams featured higher DOC concentrations compared to larger main river channels. Kling et al. (2000) investigated the influence of lakes and rivers on a landscape mass balance and found that lake and river processes are critical for surface water chemistry. For delta systems, it was found that river deltas, especially with lake-rich floodplains, affect nutrient fluxes to the Arctic Ocean (Emmerton et al., 2008). Their model showed enhanced DOC in stream water flowing through the Mackenzie Delta. However, the contribution and influence of lakes and ponds, which are interposed in a stream catchment, on the DOC concentration and how the concentration changes due to these different landscape units are unexplored in yedoma permafrost regions.
Since we assume that DOC modification processes such as photo-oxidation are more prominent in standing waters, we hypothesize a measurable influence of lakes and ponds that are part of a runoff network on DOC processing within the stream catchment. Our goal in this study is to assess the influence of interposed lakes and ponds on DOC in a small stream catchment with and without the influence of yedoma deposits before the DOC reaches the main channels of the Lena River Delta. The specific objectives of this paper are to (1) characterize differences in DOC concentrations in different surface waters, (2) determine DOC ages, and (3) analyze changes in DOC concentrations and the DOC contribution along a flow path in a small yedoma influenced catchment. With this, our study provides insights on the origin of DOC in surface waters in yedoma landscapes and how DOC may be transformed on a flow path through different landscape units before reaching the river outlet.
Study Site
Our study site on Kurungnakh Island (72° 23′N; 126° 03′E) is located in the central Lena River Delta in the continuous permafrost and subarctic tundra zone. The Lena Delta is divided into three main geomorphological units (Schwamborn et al., 2002). Our study site is situated partially on the 1st and on the 3rd Lena Delta unit. Whereas both units consist of ice-rich permafrost, they differ in depositional age, soil C stock characteristics, and watershed hydrology (Figure 1C). The 1st is the youngest geomorphological unit representing the modern active delta. It was formed in the middle Holocene and is characterized by active floodplains and polygonal tundra with small and shallow lakes and ponds, and ice-wedges. The 3rd delta unit is the oldest unit of the Lena River Delta and was formed during the Late Pleistocene. It consists of remnants of yedoma deposits, which accumulated between 43 and 14 ka BP, overlies fluvial sands and is covered by Holocene deposits (Schwamborn et al., 2002). Kurungnakh Island belongs mainly to the 3rd Lena Delta unit (Grigoriev, 1993) and is characterized by typical yedoma landforms such as yedoma uplands with surface elevations of up to 55 m above river level (Morgenstern et al., 2011) and deeply incised thermo-erosional valleys, thermokarst depressions, and large thermokarst lakes, what formed since about 13 to 12 ka BP (Morgenstern et al., 2013). Kurungnakh Island is located close to Samoylov Island, which hosts the Research Station Samoylov Island that facilitated organization and logistics of our local field work.
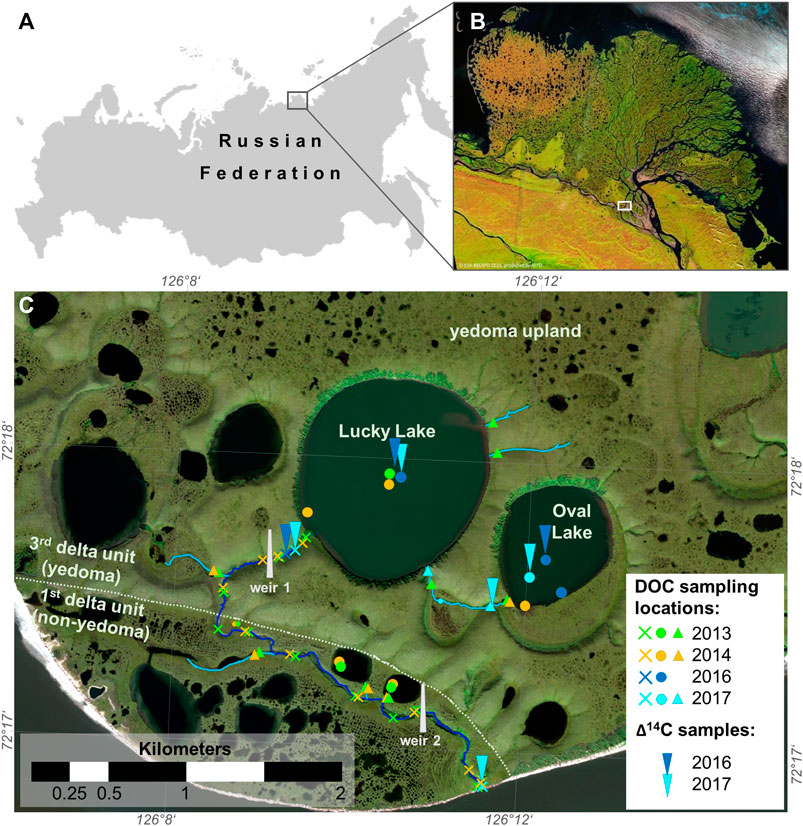
FIGURE 1. Overview and sampling locations in the study site in (A) Northeastern Siberia (map: ESRI) in the (B) Lena River Delta (ESA Proba VITO Lena River Delta). The high resolution satellite image shows (C) DOC and 14C sampling locations for lakes and ponds (circles), Lucky Lake stream (crosses), and inflows (triangles) in the south of Kurungnakh Island. Lucky Lake stream to the Olenyokskaya Channel is highlighted in dark blue and inflows are highlighted in light blue (WorldView2 image from 2015, copyright by DigitalGlobe).
Our study site is located in the south of Kurungnakh Island and comprises the catchment of Lucky Lake (unofficial name). On both units, supra-permafrost aquifers are restricted to the shallow active layer (Helbig et al., 2013). On the 3rd delta unit of Kurungnakh Island the active layer depth ranges from 38 to 82 cm (Ulrich et al., 2010). For active layer on the 1st delta unit we refer to data from Samoylov Island, where the mean depth ranges from 41 to 57 cm (Boike et al., 2019). The catchment includes several thermokarst lakes and ponds as well as inflowing and outflowing streams, both on the 3rd (yedoma) and on the 1st (non-yedoma) delta units. The outflowing stream and its associated valley are referred to as Lucky Lake stream and Lucky Lake valley, respectively. This study site offers the opportunity to analyze DOC released on the yedoma and non-yedoma delta units and how DOC is transformed along this flow path and reaches the Olenyokskaya Channel (the Lena River branch into which the Lucky Lake stream drains) (Figure 1). Lucky Lake and its neighbor Oval Lake (also unofficial name), which is located in a partially drained lake basin, are both large thermokarst lakes that are deeply subsided into the local yedoma upland (Figure 2). Lucky Lake covers a surface area of 1.22 km2, with a mean depth of 3.1 m and a maximum depth of 6.5 m, and is bordered by steep slopes with active erosion. Two inflows from the yedoma upland drain into Lucky Lake in the northeast. In the southwest, Lucky Lake drains into Lucky Lake stream via the yedoma upland and the 1st delta unit into the Olenyokskaya Channel. The Oval Lake has a surface area of 0.45 km2 and a maximum depth of 9 m (Morgenstern et al., 2011).
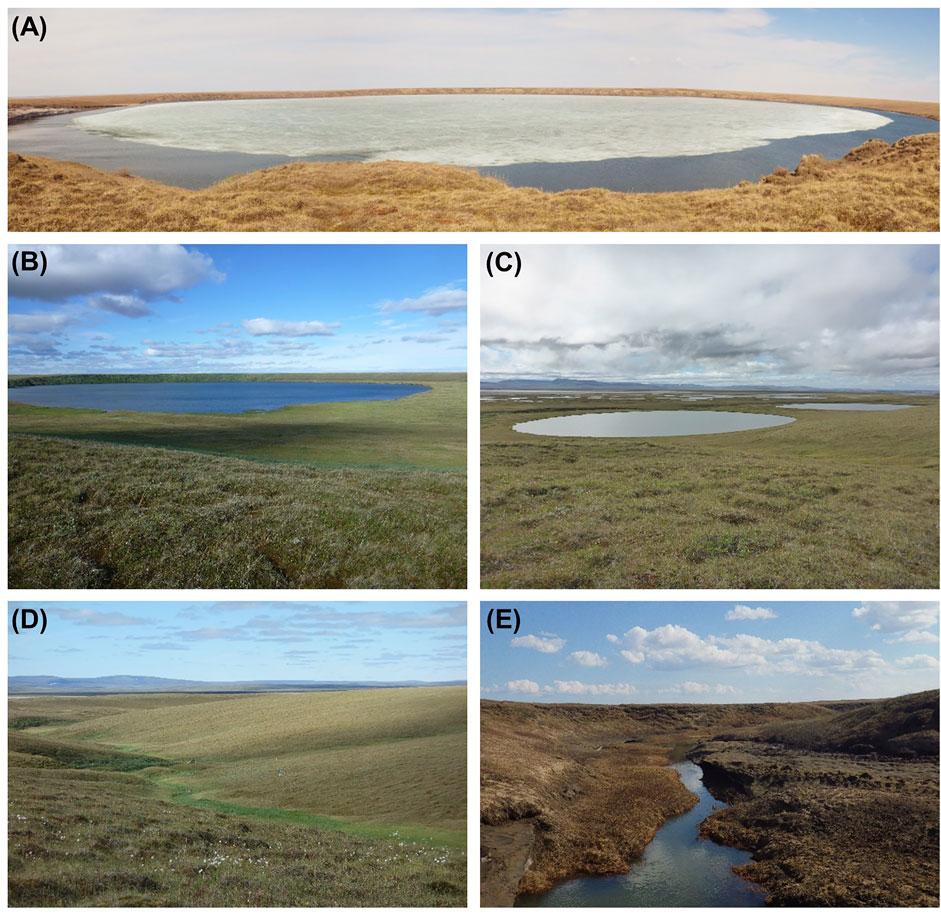
FIGURE 2. Study site on Kurungnakh Island with (A) Lucky Lake (photo by Antje Eulenburg, June 2014), (B) Oval Lake in a drained lake basin (photo by Guido Grosse, July 2016), (C) two sampled thermokarst lakes on the 1st delta unit (photo by Justine Ramage, July 2016), (D) Lucky Lake valley incised into the yedoma upland on the 3rd delta unit (photo by Anne Morgenstern, July 2016), and (E) Lucky Lake valley incised in the 1st delta unit (photo by Antje Eulenburg, June 2014).
Dry Arctic-continental climate with a mean annual air temperature of −13.6°C and a mean annual precipitation of about 140 mm characterize the climate in the Lena Delta (Boike et al., 2008). Due to these extreme climate conditions the vegetation period is limited to 3 months from mid-June to mid-September. According to the two different geomorphological delta units in our study site, vegetation differs between 3rd and 1st delta unit. Whereas the 1st delta unit is covered with wet, sedge and moss as well as moist grass dominated tundra vegetation, the 3rd is dominated by dry tussock and moist grass and moss tundra (Schneider et al., 2009).
Materials and Methods
For our analysis, we collected 113 surface water samples in the Lucky Lake catchment on the 3rd delta unit with yedoma deposits (61 samples) and the 1st delta unit (52 samples). The samples were collected during summer expeditions in July and August 2013, June to September 2014, July and August 2016 and July 2017 (Figure 1). A total of 30 samples were from Lucky Lake and the surrounding lakes on both delta units, 27 samples of inflows, such as from neighboring ponds and yedoma uplands, and 56 samples from the Lucky Lake stream and crossing both delta units. We analyzed concentration and radiocarbon ages of DOC, stable isotopes of oxygen (δ18O) and hydrogen (δD), and obtained discharge measurements to examine the origin of DOC and to understand transformations of DOC on the flow path in our study site. We measured the DOC concentration of all samples, and δ18O and δD of 99 samples. During the two sampling campaigns in 2016 and 2017, we were able to obtain 9 additional samples large enough to perform radiocarbon measurements of DOC.
Laboratory Analysis
DOC Measurements
For DOC measurements, we filtered the water samples in the field with a 0.7 µm pore size fiberglass (GF/F) syringe filter. Sampling bottles and filters were pre-rinsed with the sample. All samples were preserved with hydrochloric acid and kept cool and dark until analysis, which sometimes occurred months after sampling. In the lab, we used the non-purgeable OC method (NPOC) with the Shimadzu TOC-VCPH high-temperature catalytic combustion (Manual Shimadzu/TOC-V, 2008), recording DOC concentration in milligrams per liter (mg L−1).
Radiocarbon Dating
We carried out Accelerator Mass Spectrometry (AMS) radiocarbon (14C) dating with a Mini Carbon Dating System (MICADAS), which is described by Synal et al. (2007), and followed the methods outlined in Mollenhauer et al. (2021). In short, we dried our samples with a Heidolph LABORATA roto-evaporation apparatus to extract dissolved organic matter (DOM). Dried DOM samples were subsequently transferred into 50 µL liquid tin capsules using Milli-Q water, and radiocarbon analyses were conducted after combustion in an Elementar element analyzer using helium at 950°C. The gas mixture is transmitted to a gas interface system, described by Ruff et al. (2010), and further to the CO2 accepting ion source of the AMS instruments. We report results as Δ14C and as conventional radiocarbon ages (14C years before present).
Stable Isotopes of δ18O and δD
We measured stable isotopes of δ18O and δD with a Finnigan MAT Delta-S mass spectrometer in the isotopic laboratory of Alfred Wegener Institute in Potsdam, applying the equilibration technique described by Meyer et al. (2000).
Discharge and DOC Flux
We conducted discharge measurements with two weirs with combined radar height sensors installed in the Lucky Lake stream on the 3rd and on the 1st delta unit during field work in 2013, when also DOC samples from the Lucky Lake stream were collected (Figure 1). The sill referenced water level in millimeter (mm) was measured in 10 min intervals and was subtracted from the sensor height. The discharge (Q) in liter per seconds (L s−1) was calculated as follows:
where WL is the sill referenced water level (Eijkelkamp, 2010). We converted the discharge into cubic meters per day (m3 d−1). The discharge data cover the time period from July 27, 2013 to August 26, 2013. Additionally, we estimated a watershed area of 6.45 km2 for the entire study site above weir 2. Using the weir data, we calculated the DOC flux (kg km−2) as a product of summed discharge and averaged concentration of DOC of Lucky Lake stream water samples at each weir for this time period, and calculated a DOC flux per day by dividing the DOC flux with 29, which is the number of discharge measurement days.
Statistical Analysis
For our statistical analysis we used RStudio (version 4.0.5). To test the distribution of values of our parameter (DOC concentration, δ18O, δD, and Δ14C) we used the Shapiro-Wilk normality test. Because our data do not follow a normal distribution we used the Spearman rank correlation coefficient (ρ) to measure the relationship between two parameters. We tested differences between mean values of a parameter by delta terrace or water source (lake water, stream water, and inflow water) using the Wilcoxon-Mann-Whitney test.
Results
DOC Concentration
The DOC concentration in our study site ranged from 2.9 to 15.6 mg L−1. The median was 5 mg L−1. We found the highest DOC concentration of the entire catchment of 15.6 mg L−1 in a small polygonal pond on Holocene non-yedoma. Generally, we found significantly higher DOC concentrations in surface waters on Pleistocene yedoma (median DOC of 5 mg L−1; exception see above) compared to surface waters on Holocene non-yedoma (median DOC of 4.5 mg L−1) (Figure 3A; ρ = 0.4; p < 0.05). Regarding surface waters on Pleistocene yedoma unit, we found the highest DOC concentrations of 9–12.7 mg L−1 in inflows from the yedoma upland in the northeast of Lucky Lake. For inflows, we found significantly higher DOC concentrations and a larger range in DOC concentration on Pleistocene yedoma compared to Holocene non-yedoma, with median DOC concentrations of 4.1 and 3.3 mg L−1, respectively (p < 0.05; Figure 3D; Table 1). For lakes, the median DOC concentration was higher on Pleistocene yedoma with 5.2 mg L−1 compared to Holocene non-yedoma with 3.6 mg L−1 (Table 1). However, this difference was not statistically significant. Additionally, we found a larger range of lake DOC concentration on Holocene non-yedoma (Figure 3B). For Lucky Lake stream, we found generally higher DOC concentrations on Pleistocene yedoma compared to Holocene non-yedoma, with median DOC concentrations of 5.2 mg L−1 and 4.8 mg L−1, respectively (Figure 3C; Table 1). We analyzed changes in DOC concentration downstream in the catchment. Therefore, we defined Lucky Lake inflows, including yedoma thaw streams from the yedoma upland and Oval Lake, as the beginning of the flow path, draining into Lucky Lake, which then drains into the Lucky Lake stream, and subsequently discharges into the Olenyokskaya Channel (Figure 4). Along this flow path, we found decreasing DOC concentrations downstream to the Olenyokskaya Channel.
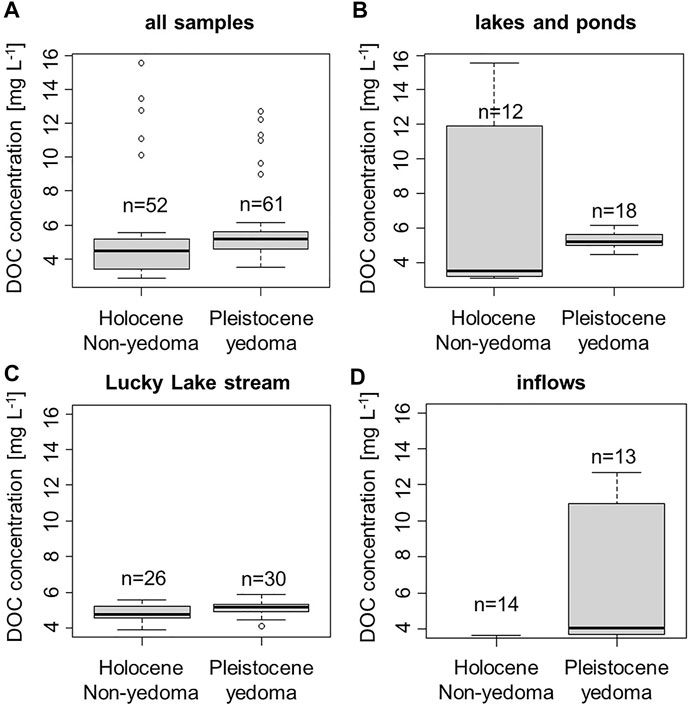
FIGURE 3. Comparison of DOC concentrations of (A) all samples in the Lucky Lake catchment, (B) samples from lakes and ponds, (C) samples from Lucky Lake stream, and (D) from inflows; by Holocene non-yedoma and Pleistocene yedoma. The greyish shaded boxes represent the standard deviation from the mean (solid line).
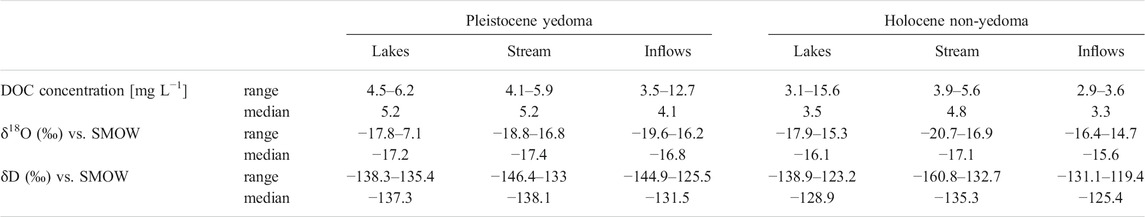
TABLE 1. Overview of DOC concentration and isotopic composition for lakes, Lucky Lake stream, and inflows on Pleistocene yedoma and Holocene non-yedoma from the years 2013, 2014, 2016, and 2017.
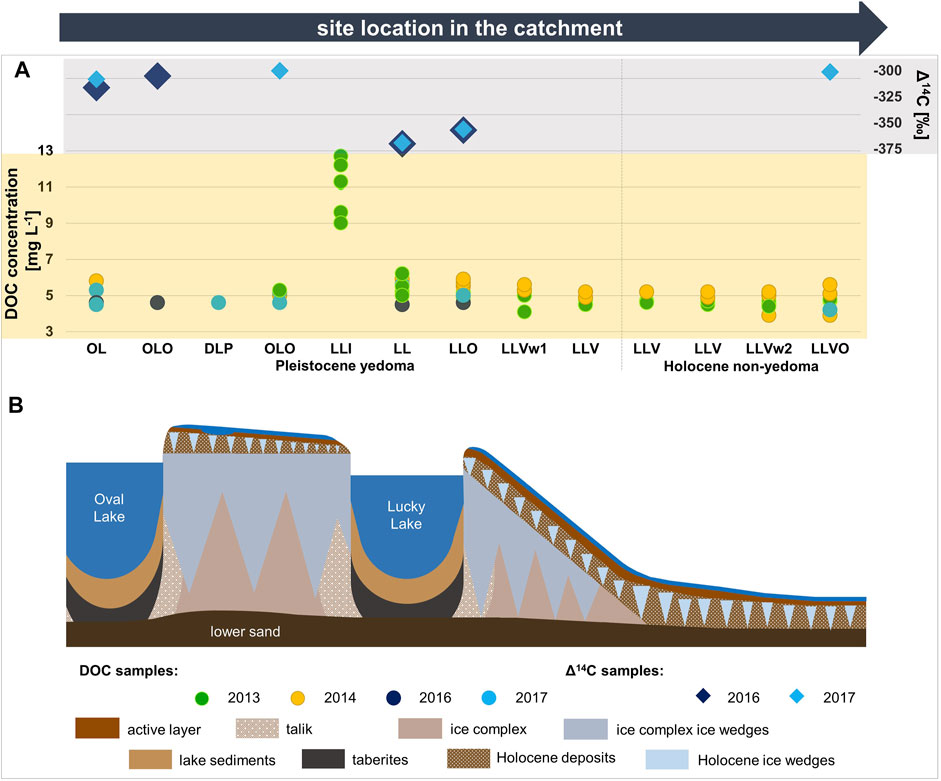
FIGURE 4. Lucky Lake flow path with (A) DOC concentrations and Δ14C along Pleistocene yedoma and Holocene non-yedoma with inflows from yedoma uplands (LLI), thermokarst lake Oval Lake (OL) and its outflow (OLO) draining a drained lake pond (DLP) and then draining into the Lucky Lake (LL), Lucky Lake outflow (LLO) and Lucky Lake stream (LLV) on Pleistocene yedoma with weir 1 (LLVw1), Lucky Lake stream on Holocene non-yedoma and weir 2 (LLVw2), and mouth of Lucky Lake stream (LLVO) to the Olenyokskaya Channel; and (B) schematic 2-dimensional cross section of the study site.
Radiocarbon Content of DOC
To define the origin of DOC in our study site, we conducted DOC radiocarbon analyses for a total of 9 samples. The Δ14C values ranged from −373 ‰ (3,637 14C y BP) to -300 ‰ (2,782 14C y BP) (Figure 4). We found lowest Δ14C values in the Lucky Lake samples and highest Δ14C values in Oval Lake samples and in the Lucky Lake stream at the mouth to Olenyokskaya Channel (Table 2). We found decreasing Δ14C values from Oval Lake to Lucky Lake and increasing Δ14C values from Lucky Lake to the mouth at the Olenyokskaya Channel.
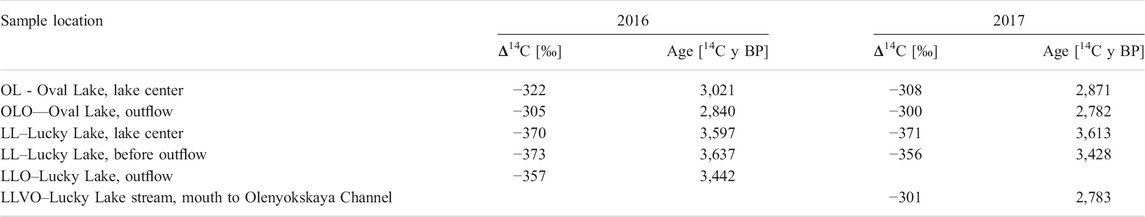
TABLE 2. Results of the radiocarbon analyses of DOC samples collected in July and August 2016 and July 2017.
Stable Isotopes of δ18O and δD
To discuss the origin of the sampled surface waters in our study site we used the stable isotopic composition of the water samples. We found a negative correlation between DOC concentration and water isotopic composition with significantly lower values in δ18O and δD in samples of higher DOC concentration (ρ = −0.57 and −0.45, respectively; p < 0.05). The stable isotopic composition ranged from −21.3 to −14.7 ‰ VSMOW in δ18O and from −162.6 to −119.4 ‰ VSMOW in δD. Most of the samples fell below the Global Meteoric Water Line (GMWL) (Figure 5). For lakes and ponds, we found lower values for δ18O and δD on Pleistocene yedoma compared to Holocene non-yedoma, and increasing values for δ18O from Lucky Lake via the Lucky Lake stream from Pleistocene yedoma to Holocene non-yedoma. Additionally, two samples with lowest δ18O and δD were outliers from the Lucky Lake stream on Holocene non-yedoma.
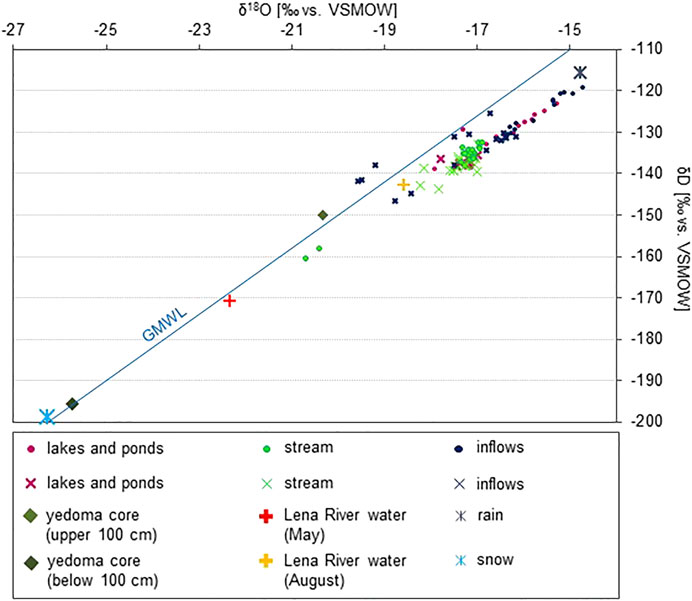
FIGURE 5. δD and δ18O values of lakes and ponds, Lucky Lake stream, and inflows in the Lucky Lake catchment by Holocene non-yedoma (dots) and Pleistocene yedoma (crosses). As references we added δD and δ18O values of Lena River water samples from May and August 2014, rain and snow samples from Bykovsky Peninsula in the Lena River Delta (Meyer et al., 2002), a yedoma core collected north of the Lucky Lake catchment, and the GMWL.
Water isotopic values of one sample lay close (within δD 10 ‰ and δ18O 1 ‰) to the GMWL. This sample was collected in early September from a small polygonal pond on Holocene non-yedoma, draining into the Lucky Lake stream. Isotopic values of three samples of the yedoma upland inflows lay above the GMWL. We found the highest δ18O and δD in samples of inflows and lakes on Holocene non-yedoma.
Discharge and DOC Flux
For the observation period from July 27, 2013 to August 26, 2013 we found decreasing discharge from 1,700 to 200 m3 d−1 at weir 1, corresponding to decreasing DOC concentrations from 5 to 4.1 mg L−1 at weir 1. For weir 2, the discharge decreased from 3,000–500 m3 d−1, corresponding to decreasing DOC concentrations from 4.6 to 4.4 mg L−1 at weir 2. Based on these values, we estimated a DOC flux of 92.5 kg at weir 1 and 220.5 kg at weir 2 for 29 days in 2013. With an estimated watershed area of 6.45 km2, we calculated a DOC flux of 34.2 kg km−2 for 29 days of discharge measurements and 1.2 kg km−2 per day.
Discussion
Differing DOC Concentrations in Inflows, Lakes, and Outflows on Holocene Non-yedoma and Pleistocene Yedoma
Yedoma deposits are especially prone to degradation processes (Strauss et al., 2013) such as erosion of thermokarst lake shores (Larsen et al., 2017), as for Lucky Lake and Oval Lake, and thermo-erosional gullies, as for yedoma thaw streams in our study area. During these processes organic-rich materials from degrading yedoma deposits are thawed and transported into lakes and streams, resulting in higher median DOC concentration in surface waters on Pleistocene yedoma. Whereas findings from Siberia and Alaska show that yedoma lakes have significantly higher DOC concentrations compared to non-yedoma lakes (Sepulveda-Jauregui et al., 2015), the differences in lake DOC concentration at our study site between Pleistocene yedoma and Holocene non-yedoma are statistically not significant (Figure 3B). We found high DOC concentration of 15.6 mg L−1 in the smallest pond in the catchment on Holocene non-yedoma, which is characterized by low water depth and a high amount of submerged vegetation, whereas Lucky Lake and the neighboring Oval Lake on Pleistocene yedoma are lakes of lowest DOC concentrations and largest lake surface area. This negative correlation of lake DOC concentration and lake surface area was already shown for lakes in western Siberia with discontinuous and sporadic permafrost (Shirokova et al., 2013). As possible causes, they suggest low water depth and the fast release of DOC from vegetation in small ponds. Furthermore, small ponds are known to have a high input of allochthonous DOC due to a higher ratio of lake surface area and lake volume. Here, short water residence time results in reduced lake processes, such as mineralization or photo-degradation, causing higher DOC concentrations (Shirokova et al., 2013; Manasypov et al., 2014, 2015). In larger lakes an increasing consumption of dissolved organic matter by bacterio-plankton and photo-degradation takes place, resulting in decreasing DOC concentrations from small ponds to large thermokarst lakes. As a result of an increase in lake surface area due to thermokarst lake shore erosion, solar irradiance becomes increasingly important for stimulating photo-chemical processes such as photo-oxidation of DOC, causing a decrease in DOC concentrations in such larger lakes (Surdu et al., 2014; Williamson et al., 2014).
Coch et al. (2019) analyzed two catchments in the high and low Canadian Arctic, finding generally higher DOC concentrations in samples of standing waters compared to stream water samples. For our study site, we contrastingly found high DOC concentrations in samples of thaw streams from the yedoma uplands on Pleistocene yedoma, which are two to three times higher than in lakes of our study site. Additionally, DOC concentrations of Lucky Lake stream are partially higher than DOC concentrations of some of the lakes in our study site. This difference between their study and our results can be attributed to the presence of C-rich yedoma deposits on Pleistocene yedoma in our study site, whereas the study sites of Coch et al. (2019) are characterized by marine and glacial sediments underlain by bedrock deposits. A study in the Kolyma River basin also found the highest concentrations of highly labile DOC in small yedoma thaw streams compared to larger rivers and streams in the basin (Mann et al., 2015). Another study reports DOC concentrations from 155 to 196 mg L−1 in actively eroding streams of a yedoma exposure on the Kolyma River bank (Vonk et al., 2013b), which is more than ten times higher than in thaw streams of our study site. In contrast, inflows on Holocene non-yedoma have DOC concentrations between 2.9 and 3.6 mg L−1. By mixing with water from the yedoma upland these inflows might cause a dilution effect in the Lucky Lake stream, resulting in decreasing DOC concentrations along the flow path to the Olenyokskaya Channel.
DOC Flux From Pleistocene Yedoma to the Olenyokskaya Channel
When discussing fluxes in permafrost affected landscapes we need to clarify the role of groundwater. Walvoord and Kurylyk (2016) summarized supra-permafrost aquifers including unfrozen taliks below lakes and streams and the active layer on top of the permafrost table, intra-permafrost groundwater, and sub-permafrost aquifers as groundwater zones in discontinuous permafrost. In our study area in the continuous permafrost zone, groundwater exchange predominantly occurs in the supra-permafrost aquifer (Helbig et al., 2013). The amount of DOC released from permafrost to Arctic freshwaters changes in response to climate change (Wickland et al., 2018). These changes differ e.g. by permafrost composition and catchment characteristics, such as permafrost distribution. In regions of warmer discontinuous permafrost with connected intra- and supra-permafrost ground water aquifers, the DOC was shown to decline over the past 40 years (Striegl et al., 2005). In contrast, in regions of cold continuous permafrost with limited ground water flow, DOC mobilization increases (Wickland et al., 2018). Vonk et al. (2019) defined permafrost continuity, ice content, soil composition and morphology, as well as topography, as critical factors for C mobilization and transport in waters in thaw affected permafrost landscapes. In yedoma regions, DOC mobilization and transport is presumably accelerated by permafrost thaw and associated processes (Vonk et al., 2013a; Drake et al., 2015; Mann et al., 2015; Spencer et al., 2015). Moreover, it is important to mention climate change driven influencing processes such as abrupt thaw of permafrost, drainage of thaw lake basins, and active layer deepening (Opfergelt, 2020). Changes and especially increasing of active layer depth reveal subsurface fluxes (Helbig et al., 2013), which may affect the transport and flux of DOC. The stream from Lucky Lake to its mouth at the Lena River branch is dominated by rapid fluvial processes, transporting sediments and dissolved material. For our small lake catchment, we estimate a DOC flux of 1.2 kg km−2 per day. Lewis et al. (2012) found comparable DOC flux of 350 kg km−2 per year and a downscaled value of approximately 1 kg km−2 per day for a small watershed of 8 km2 in the high Canadian Arctic. For the entire Lena River a DOC flux of 6.79 Tg C per year was calculated (Juhls et al., 2020). This corresponds to a DOC flux of approximately 2,602 kg km−2 and to 7 kg km−2 per day, which is almost 6 times higher than DOC flux in our small catchment. With an estimation of approximately 3 kg km−2 per day the Mackenzie River has a lower summer DOC flux (Coch et al., 2018). This lower flux might be caused by the absence of ice-rich yedoma deposits, the presence of large lakes, which might decrease DOC fluxes, and extensive wetlands in the Mackenzie Delta, as well as the glacial history (Raymond et al., 2007; Burn and Kokelj, 2009). Moreover, in contrast to previously mentioned catchments and watersheds the Mackenzie River catchment covers large areas with only sporadic permafrost distribution and also without permafrost deposits. On the other hand, peatlands, which occur in the Mackenzie Delta, are known to increase DOC mobilization (Frey and Smith, 2005; Olefeldt and Roulet, 2012).
Our estimates do not account for the impacts of rain or storm events, and DOC flux at our study site was calculated for only 29 days of a year. Furthermore, we do not account for seasonal variability in discharge, especially during spring snowmelt, since we are focusing on the summer season. In a recent study of Juhls et al. (2020) it was possible to calculate the seasonal variability of DOC flux for the Lena River. They found that approximately half of the annual DOC flux of 6.79 Tg C is transported in summer and 41% in spring, when spring snowmelt, the biggest hydrological event in this region, occurs. Furthermore, Ahmed et al. (2020) predicted a shift of seasonal discharge towards earlier spring floods resulting in decreasing summer discharge, which may lead to a decrease in summer DOC flux. Our estimations suggest that if we merge all catchments in the Lena River Delta or even in the Lena River watershed that are similar to the small catchment on Kurungnakh Island we present here, comparatively less DOC is released to the Lena River than further upstream in the catchment, and that this DOC is relatively young. Coch et al. (2018) compared their calculations of a 17 days summer DOC flux (mean flux: 82.7 ± 30.7 kg km−2) of a small watershed on Herschel Island in the Canadian Arctic with different Arctic locations and found higher DOC fluxes in their low Arctic site compared to high Arctic locations. They also highlight the contribution of small watersheds and consider the snowmelt and related discharge to be a major influencing process of DOC flux. Based on expected changes in discharge due to climate change (Bintanja and Andry, 2017), such as shifting seasonal discharge, we assume changing DOC fluxes from small Arctic catchments as well as for major Arctic river catchments, and especially increasing DOC fluxes from yedoma catchments (Tank et al., 2020) like our Lucky Lake stream catchment in the coming decades.
DOC Sources in the Lucky Lake Catchment
Generally, lake DOC can be produced in the lake itself (autochthonous) and in the lake catchment (allochthonous), and previous studies identified several parameters influencing lake DOC concentration, such as lake perimeter and lake elevation (Xenopoulos et al., 2003), lake area (Tranvik et al., 2009; Shirokova et al., 2013; Zabelina et al., 2021), and hydrological connectivity of a lake (Bogard et al., 2019; Johnston et al., 2020). Lucky Lake is a thermokarst lake where lake shore erosion is active and causes transport of old organic material from the surrounding late Pleistocene permafrost deposits into the lake. For streams, erosion of stream banks leads to a higher amount of 14C depleted DOC (Mann et al., 2015). Pleistocene yedoma is rich in fossil OC. But also Holocene deposits are rich in OC (Schirrmeister et al., 2011) and a Holocene surface layer overlies yedoma deposits on the 3rd delta unit. However, yedoma C is more bioavailable (Vonk et al., 2013a; Strauss et al., 2015) and decomposable than C in other thawed mineral soils (Walter Anthony et al., 2014). We found the lowest Δ14C values in samples of Lucky Lake. Here, the DOC in our water samples is approximately 3,600 years old. Δ14C values in an aquatic system such as Lucky Lake may result from fresh aquatic production in the water body, from leached material from the active layer, and/or from leached organic matter from eroded yedoma deposits.
Our results show DOC concentrations of 9–12.7 mg L−1 in inflows in the north-east of Lucky Lake, where yedoma upland is drained by thaw streams. After thaw stream water reaches Lucky Lake, DOC concentrations decrease to less than half, suggesting that yedoma-derived DOC likely is rapidly utilized or that low Lucky Lake DOC concentration causes a dilution. Regarding C input from the two delta units in our study area, we assume that C in the Lucky Lake also originates from both eroding Holocene materials and from the older yedoma deposits. With a DOC age of approximately 3,600 14C y BP we found the oldest DOC of the entire dataset in samples from the Lucky Lake with Δ14C values between -370 and -373 ‰.
DOC in the Flow Path From Yedoma Uplands to the Olenyokskaya Channel
According to Figure 6, yedoma thaw streams, draining Pleistocene yedoma uplands, represent the hydrological start of the flow path in our study area. These inflows (Figure 6A) show DOC concentrations more than twice as high as the dataset’s median. The inflows drain thaw-affected yedoma uplands and mobilize OC, as well as active layer and tundra vegetation. Unfortunately, we did not perform radiocarbon dating for samples of these inflows in our study site but for small yedoma thaw streams in the Kolyma River basin, Mann et al. (2015) found Δ14C signatures of 883 ± 41 ‰, which corresponds to an age of more than 20,000 years. In contrast, DOC in large rivers and streams of the Kolyma River basin is modern (Neff et al., 2006; Vonk et al., 2013b; Mann et al., 2015; Spencer et al., 2015). The water isotopic composition (δ18O and δD) of three yedoma inflow samples plot above the GMWL (Figure 5) caused by disequilibrium processes like thawing and freezing of the active layer in spring and fall.
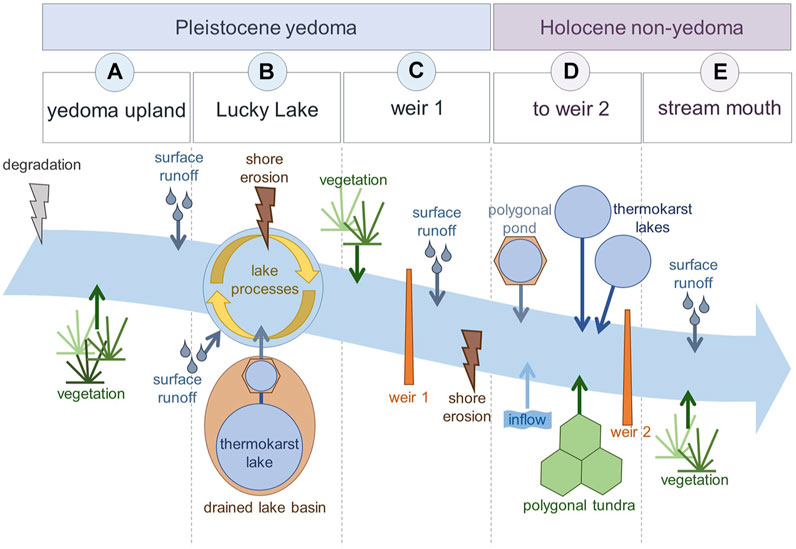
FIGURE 6. Top view scheme of the flow path with (A) yedoma thaw stream as hydrological start of the flow path, draining into (B) the Lucky Lake, draining into (C) the Lucky Lake stream on Pleistocene yedoma to weir 1, and further on (D) Holocene non-yedoma to weir 2, and finally to (E) the stream mouth to the Olenyokskaya Channel. Arrows symbolize the input of OC from different sources. Whereas input from surface runoff and vegetation occurs at each sampling point, input from degradation of the yedoma upland, lake shore and stream bank erosion, inflows, thermokarst lakes, polygonal ponds, and polygonal tundra occur selectively.
After water from the yedoma thaw streams reached Lucky Lake (Figure 6B), we observed an abrupt decrease of DOC concentrations. The question of what happens to DOC in the lake arises. In contrast to yedoma thaw streams, which are small trickles with low discharge, Lucky Lake has a greater water volume of low DOC concentration and may dilute the inflowing yedoma thaw stream water of higher DOC concentrations. Moreover, the neighboring thermokarst lake Oval Lake, situated in a drained lake basin, drains into Lucky Lake via a small stream and a drained pond. Whereas DOC concentrations of Oval Lake are similar to those of Lucky Lake, Δ14C signatures of Oval Lake (between −322 and −300 ‰) are much higher comparing to Lucky Lake Δ14C signatures (between −373 and −370 ‰). These samples contain the oldest DOC in our entire dataset and might be a result of eroding yedoma lake shore and Holocene deposits. There are a number of lake processes that may lead to decreasing lake DOC concentration. Photo-oxidation or microbial activity lead to mineralization of DOC to CO2 and CH4, which can be emitted to the atmosphere (Tranvik et al., 2009; Vonk et al., 2013a, b). Studies of Mann et al. (2015) and Spencer et al. (2015) found that the lability of old yedoma DOC causes rapid mineralization and further lower DOC concentrations when yedoma thaw stream waters reach main stream water. Additionally, the process of flocculation may lead to deposition of DOC in lake sediments and hence to decreasing DOC concentration in the lake water (Tranvik et al., 2009). If we assume a yedoma age from the Pleistocene of approximately 30,000 years, DOC from this material should have a Δ14C value of -980 ‰. Using isotope mass balance calculation and assuming that one part of this old DOC mixes with two parts of young DOC from surface leaching (Holocene, Δ14C = -80 ‰) a theoretical lake DOC Δ14C value of -373 ‰ is estimated. This suggests that dilution, rather than preferential utilization of DOC supplied to the lake by inflows, caused the decrease in DOC concentration from yedoma upland thaw streams to the Lucky Lake. We also assume a smaller amount of DOC released along the lake shore and from the talik than DOC that is mobilized at the surface and transported via inflows.
Directly after the Lucky Lake outflow, where Lucky Lake drained into the Lucky Lake valley and formed the Lucky Lake stream on Pleistocene yedoma (Figure 6C), we observed an increase in Δ14C signature to -356 ‰. Samples from the Lucky Lake stream on Pleistocene yedoma show similar values of δ18O and δD compared to those of Lucky Lake, and let us assume that the flowing water at this point is mostly influenced by Lucky Lake water. We found slightly decreasing DOC concentrations downstream to weir 1, where the concentration of DOC is mainly influenced by hydrological connectivity and erosion along river stream banks (Raymond et al., 2007; Mann et al., 2015). The main DOC sources here are Lucky Lake waters, as well as fresh DOC leached from vegetation, which also leads to younger DOC ages.
Where Lucky Lake stream reaches Holocene non-yedoma (Figure 6D), the setting changes rapidly to wetter polygonal tundra vegetation and the eroding Lucky Lake valley with its incised stream. Two small thermokarst lakes in the north of Lucky Lake stream and a stream from a neighboring side valley have low DOC concentrations between 3.1 and 3.6 mg L−1 and are connected with the Lucky Lake stream. Up to weir 2 we observed slightly decreasing DOC concentrations and similar δ18O and δD values compared to δ18O and δD values of thermokarst lakes of Pleistocene yedoma as well as Lucky Lake stream on Pleistocene yedoma.
After weir 2, the DOC concentration further decreases towards the mouth of Lucky Lake stream at the Olenyokskaya Channel (Figure 6E). In contrast, we observed increasing δ18O values attributed to contributions from melted ice frozen during conditions of higher air temperatures during the Holocene. Two Lucky Lake stream samples close to the mouth at the Olenyokskaya Channel show especially low values for δ18O and δD (Figure 5). These samples were collected in mid-June. Here, expedition members observed high flow on Olenyokskaya Channel during spring flood, causing tailback from river channel water into the Lucky Lake stream. At the mouth of Lucky Lake stream to the Olenyokskaya Channel we found an increased Δ14C signature of -301 ‰, which corresponds to a DOC age of 2,783 14C y BP. For comparison, major streams and the main stream of the Kolyma River basin have Δ14C signatures of 22–51 ‰ (Mann et al., 2015), and the averaged Δ14C of DOC in the Lena River was determined to be 78 ‰ (Raymond et al., 2007). The younger DOC ages combined with decreasing DOC concentrations after the water of Lucky Lake exit the lake and drains into Lucky Lake stream and further to the mouth at the Olenyokskaya Channel could be caused by several processes: 1) Supply to the Lucky Lake stream fresh and young DOC leached from vegetation (e.g. Schuur et al., 2008; Coch et al., 2020). The downstream changes in Δ14C along the flow path might thus result from mixing of water of different DOC concentrations and radiocarbon levels when the stream drains different geomorphological units. A mixing with younger DOC contributed from water of Holocene non-yedoma and deposits likely causes an overall dilution of older DOC signatures with younger DOC with increasing distance from the old DOC sources. 2) Old DOC might be re-mineralized. Old yedoma DOC has been shown to decompose and outgas faster than younger DOC because of higher bioavailability of the materials leached from yedoma permafrost (Vonk et al., 2013a; Drake et al., 2015). Drake et al. (2015) highlighted an especially rapid DOC turnover to CO2 due to yedoma permafrost thaw and directly initiated DOC mineralization. Spencer et al. (2015) analyzed water samples of the Kolyma River basin and found the youngest C signature downstream at the river mouth. They suggest that a faster utilization of ancient C and thus outgassing is a possible cause for this observed downstream gradient. Our results show increasing Δ14C from Pleistocene yedoma to the Holocene non-yedoma, which would be consistent with both scenarios, preferential re-mineralization of old DOC and a dilution by inflows. Because DOC radiocarbon values are higher (younger) at the mouth at the Olenyokskaya Channel, photochemical or microbial processes from Lucky Lake to the Olenyokskaya Channel might be rapidly degrading old DOC. Our observation of progressively younger signature of DOC downstream is consistent with trends also described for major Arctic rivers (Benner et al., 2004; Raymond et al., 2007; Striegl et al., 2007; Aiken et al., 2014). Changes in the isotopic composition with increasing values for δ18O and δD from Pleistocene yedoma suggest the mixing of different waters.
In order to assess whether preferential re-mineralization of old DOC or mixing of waters with different DOC concentrations and higher ∆14C values is the more likely process, we can again use isotope mass balance calculations. As radiocarbon measurements were only carried out for samples from a limited number of sites and no streams from Holocene non-yedoma were sampled for this purpose, we need to estimate which radiocarbon signature DOC in those streams would need to carry in order to explain the observed trend through mixing. We used as input parameters the DOC concentrations and the discharge measured at both weirs (minimum and maximum values to determine the possible range), and the ∆14C values measured for DOC at the Lucky Lake outflow, and at the outflow of the small drainage system to the Olenyokskaya Channel. Based on this mass balance calculation, we estimate the DOC ∆14C values of inflows between weir 1 and 2 to range between −292 and −287 ‰, respectively. Note that for this estimate, DOC concentrations and radiocarbon ages from different sampling years and months were used. We consider this an acceptable assumption, since we found no major inter-annual changes in DOC concentration and no major ranges in the sampled years. The Δ14C signature of −292 to −287 ‰ (corresponding to 14C ages of approximately 2,800 14C years) estimated for Holocene non-yedoma tributaries to the drainage system appears a plausible value considering the geological setting. While not excluded, preferential re-mineralization of old DOC likewise resulting in a progressive increase in ∆14C and decrease in DOC concentration along the flow path is at least not the only plausible scenario for our study site.
Conclusion
In our study we analyze the influence of lakes and ponds, which are interposed in a stream catchment, on DOC concentrations and export; we discuss the origin of DOC in a small lake catchment on Kurungnakh Island in the central Lena River Delta, and how it may transform on its flow path to the river outlet. We show decreasing DOC concentrations from the beginning of the flow path at the yedoma upland thaw streams to the biggest lake in our study site, the Lucky Lake. Additionally, we found decreasing DOC concentration from Lucky Lake via the Lucky Lake stream to the Olenyokskaya Channel. Further, our data indicate that old yedoma and Holocene C might be mobilized into thermokarst lake systems. We found progressively younger DOC signatures in the downstream segments of the catchment. We discussed degrading yedoma and non-yedoma permafrost, active layer, and vegetation to be the major DOC sources in the catchment. Changes and especially the decrease of DOC concentration on the flow path might be ascribed to 1) dilution/mixing with water of lower concentrations and/or younger DOC; 2) lake processes such as photo-oxidation, microbial activity, and flocculation; and 3) a possible outgassing of DOC on the flow path downstream; or a combination of these processes. Finally, the input of DOC from our catchment to the Lena River is dominated by younger DOC compared to Lucky Lake DOC age. In our study, we discuss how OC from yedoma deposits enters aquatic systems as DOC and how DOC is transformed during transport in fluvial networks. Under future climate, degrading yedoma permafrost will cause changes in groundwater and subsurface flow in Arctic watersheds and may increase DOC export. We demonstrate that lakes and ponds may act as DOC filters by diluting incoming waters of higher DOC concentrations and modifying DOC to CO2 and CH4. Small thermokarst lake catchments may therefore critically determine C emissions of yedoma landscapes in a rapidly warming Arctic.
Data Availability Statement
The 14C, discharge, DOC and stable water isotopes data presented in this study are deposited in the PANGAEA repository (Hammes and Mollenhauer, 2020; Stolpmann et al., 2021b; Stolpmann et al., 2021c).
Author Contributions
LS, GM, and AM developed the study design. JB designed the hydrological set up for lake level and discharge measurements in the field. Field work was conducted by AM in 2013, 2014. LS and JH ran laboratory analyses for DOC concentration and radiocarbon ages. LS performed statistical analyses, interpreted the data with input from JH, GM, AM, JB, PO, and GG and prepared the paper with contributions from all co-authors.
Funding
LS was funded by a PhD stipend of the Potsdam Graduate School, the Koordinationsbüro für Chancengleichheit of the University of Potsdam, and the ERC PETA-CARB project (338335). Field work was supported by the AWI base funds for the German-Russian LENA expedition and the BMBF project KoPf (# 03F0764).
Conflict of Interest
The authors declare that the research was conducted in the absence of any commercial or financial relationships that could be construed as a potential conflict of interest.
The reviewer JO declared a past co-authorship with one of the authors GG to the handling editor.
Publisher’s Note
All claims expressed in this article are solely those of the authors and do not necessarily represent those of their affiliated organizations, or those of the publisher, the editors and the reviewers. Any product that may be evaluated in this article, or claim that may be made by its manufacturer, is not guaranteed or endorsed by the publisher.
Acknowledgments
We thank all colleagues involved in the organization of field work and in the sample collection during the Russian-German LENA expeditions in 2013, 2014, 2016, and 2017 and the staff of the Research Station Samoylov Island for their great support. In particular, we thank Hanno Meyer, Mikaela Weiner, Niko Bornemann, Sascha Niemann, Vera Meyer and Thorsten Riedel, Hendrik Grotheer, Maria Winterfeld, Antje Eulenburg from the laboratory of AWI Potsdam, and the MICADAS staff at AWI Bremerhaven. Furthermore, we thank the editor Duane Froese, and the two reviewers Jonathan Andrew O’Donnell and Suzanne Tank, who helped to improve the paper.
References
Abnizova, A., Siemens, J., Langer, M., and Boike, J. (2012). Small Ponds with Major Impact: The Relevance of Ponds and Lakes in Permafrost Landscapes to Carbon Dioxide Emissions. Glob. Biogeochem. Cycles 26, a–n. doi:10.1029/2011GB004237
Ahmed, R., Prowse, T., Dibike, Y., Bonsal, B., and O’Neil, H. (2020). Recent Trends in Freshwater Influx to the Arctic Ocean from Four Major Arctic-Draining Rivers. Water 12, 1189. doi:10.3390/w12041189
Aiken, G. R., Spencer, R. G. M., Striegl, R. G., Schuster, P. F., and Raymond, P. A. (2014). Influences of Glacier Melt and Permafrost Thaw on the Age of Dissolved Organic Carbon in the Yukon River basin. Glob. Biogeochem. Cycles 28, 525–537. doi:10.1002/2013GB004764
AMAP (2021). Arctic Climate Change Update 2021: Key Trends and Impacts. Summary for Policy-Makers. Tromsø, Norway: Arctic Monitoring and Assessment Programme, 16.
Battin, T. J., Kaplan, L. A., Findlay, S., Hopkinson, C. S., Marti, E., Packman, A. I., et al. (2008). Biophysical Controls on Organic Carbon Fluxes in Fluvial Networks. Nat. Geosci. 1, 95–100. doi:10.1038/ngeo101
Benner, R., Benitez-Nelson, B., Kaiser, K., and Amon, R. M. W. (2004). Export of Young Terrigenous Dissolved Organic Carbon from Rivers to the Arctic Ocean. Geophys. Res. Lett. 31, a–n. doi:10.1029/2003GL019251
Bintanja, R., and Andry, O. (2017). Towards a Rain-Dominated Arctic. Nat. Clim. Change 7, 263–267. doi:10.1038/nclimate3240
Biskaborn, B. K., Smith, S. L., Noetzli, J., Matthes, H., Vieira, G., Streletskiy, D. A., et al. (2019). Permafrost Is Warming at a Global Scale. Nat. Commun. 10, 264. doi:10.1038/s41467-018-08240-4
Bogard, M. J., Kuhn, C. D., Johnston, S. E., Striegl, R. G., Holtgrieve, G. W., Dornblaser, M. M., et al. (2019). Negligible Cycling of Terrestrial Carbon in many Lakes of the Arid Circumpolar Landscape. Nat. Geosci. 12, 180–185. doi:10.1038/s41561-019-0299-5
Boike, J., Nitzbon, J., Anders, K., Grigoriev, M., Bolshiyanov, D., Langer, M., et al. (2019). A 16-year Record (2002-2017) of Permafrost, Active-Layer, and Meteorological Conditions at the Samoylov Island Arctic Permafrost Research Site, Lena River delta, Northern Siberia: an Opportunity to Validate Remote-Sensing Data and Land Surface, Snow, and Permafrost Models. Earth Syst. Sci. Data 11, 261–299. doi:10.5194/essd-11-261-2019
Burn, C. R., and Kokelj, S. V. (2009). The Environment and Permafrost of the Mackenzie Delta Area. Permafr. Periglac. Process 20 2, 83–105. doi:10.1002/ppp.655
Coch, C., Juhls, B., Lamoureux, S. F., Lafrenière, M. J., Fritz, M., Heim, B., et al. (2019). Comparisons of Dissolved Organic Matter and its Optical Characteristics in Small Low and High Arctic Catchments. Biogeosciences 16, 4535–4553. doi:10.5194/bg-16-4535-2019
Coch, C., Lamoureux, S. F., Knoblauch, C., Eischeid, I., Fritz, M., Obu, J., et al. (2018). Summer Rainfall Dissolved Organic Carbon, Solute, and Sediment Fluxes in a Small Arctic Coastal Catchment on Herschel Island (Yukon Territory, Canada). Arctic Sci. 4, 750–780. doi:10.1139/as-2018-0010
Coch, C., Ramage, J. L., Lamoureux, S. F., Meyer, H., Knoblauch, C., and Lantuit, H. (2020). Spatial Variability of Dissolved Organic Carbon, Solutes, and Suspended Sediment in Disturbed Low Arctic Coastal Watersheds. J. Geophys. Res. Biogeosci. 125 (2). e2019JG005505. doi:10.1029/2019JG005505
Drake, T. W., Wickland, K. P., Spencer, R. G. M., McKnight, D. M., and Striegl, R. G. (2015). Ancient Low-Molecular-Weight Organic Acids in Permafrost Fuel Rapid Carbon Dioxide Production upon Thaw. PNAS 112 (45), 13946–13951. doi:10.1073/pnas.1511705112
Eijkelkamp (2010). Operation Instructions of 13.17.08 RBC Flume. Giesbeek, Netherlands: Eijkelkamp Agrisearch Equipment.
Emmerton, C. A., Lesack, L. F. W., and Vincent, W. F. (2008). Mackenzie River Nutrient Delivery to the Arctic Ocean and Effects of the Mackenzie Delta during Open Water Conditions. Glob. Biogeochem. Cycles 22, a–n. doi:10.1029/2006GB002856
Evans, C. D., Futter, M. N., Moldan, F., Valinia, S., Frogbrook, Z., and Kothawala, D. N. (2017). Variability in Organic Carbon Reactivity across lake Residence Time and Trophic Gradients. Nat. Geosci. 10, 832–835. doi:10.1038/NGEO3051
Frey, K. E., and McClelland, J. W. (2009). Impacts of Permafrost Degradation on Arctic River Biogeochemistry. Hydrol. Process. 23, 169–182. doi:10.1002/hyp.7196
Frey, K. E., and Smith, L. C. (2005). Amplified Carbon Release from Vast West Siberian Peatlands by 2100. Geophys. Res. Lett. 32, L09401. doi:10.1029/2004GL022025
Grigoriev, M. N. (1993). Cryomorphogenesis of the Lena River Mouth Area, Siberian branch. Yakutsk: USSR Academy of Sciences, 176. (in Russian).
Grosse, G., Jones, B., and Arp, C. (2013). “8.21 Thermokarst Lakes, Drainage, and Drained Basins,” in “Thermokarst Lakes, Drainage, and Drained Basins” in Treatise on Geomorphology Vol 8, Glacial and Periglacial Geomorphology. Editors J. F. Shroder, R. Giardino, and J. Harbor (San Diego: Academic Press), 325–353. doi:10.1016/b978-0-12-374739-6.00216-5
Guo, L., Ping, C.-L., and Macdonald, R. W. (2007). Mobilization Pathways of Organic Carbon from Permafrost to Arctic Rivers in a Changing Climate. Geophys. Res. Lett. 34, a–n. doi:10.1029/2007GL030689
Hammes, J. S., and Mollenhauer, G. (2020). Radiocarbon content of dissolved and particulate organic matter in small water bodies of the Lena Delta. PANGAEA doi:10.1594/PANGAEA.913354
Helbig, M., Boike, J., Langer, M., Schreiber, P., Runkle, B. R. K., and Kutzbach, L. (2013). Spatial and Seasonal Variability of Polygonal Tundra Water Balance: Lena River Delta, Northern Siberia (Russia). Hydrogeol. J. 21, 133–147. doi:10.1007/s10040-012-0933-4
Hughes‐Allen, L., Bouchard, F., Laurion, I., Séjourné, A., Marlin, C., Hatté, C., et al. (2021). Seasonal Patterns in Greenhouse Gas Emissions from Thermokarst Lakes in Central Yakutia (Eastern Siberia). Limnol. Oceanogr. 66, S98–S116. doi:10.1002/lno.11665
Johnston, S. E., Striegl, R. G., Bogard, M. J., Dornblaser, M. M., Butman, D. E., Kellerman, A. M., et al. (2020). Hydrologic Connectivity Determines Dissolved Organic Matter Biogeochemistry in Northern High‐latitude Lakes. Limnol. Oceanogr. 65, 1764–1780. doi:10.1002/lno.11417
Jones, B. M., Grosse, G., Arp, C. D., Jones, M. C., Walter Anthony, K. M., and Romanovsky, V. E. (2011). Modern Thermokarst lake Dynamics in the Continuous Permafrost Zone, Northern Seward Peninsula, Alaska. J. Geophys. Res. 116, G00M03. doi:10.1029/2011JG001666
Juhls, B., Stedmon, C. A., Morgenstern, A., Meyer, H., Hölemann, J., Heim, B., et al. (2020). Identifying Drivers of Seasonality in Lena River Biogeochemistry and Dissolved Organic Matter Fluxes. Front. Environ. Sci. 8, 53. doi:10.3389/fenvs.2020.00053
Kling, G. W., Kipphut, G. W., Miller, M. M., and O'Brien, W. J. (2000). Integration of Lakes and Streams in a Landscape Perspective: the Importance of Material Processing on Spatial Patterns and Temporal Coherence. Freshw. Biol. 43, 477–497. doi:10.1046/j.1365-2427.2000.00515.x
Langer, M., Westermann, S., Boike, J., Kirillin, G., Grosse, G., Peng, S., et al. (2016). Rapid Degradation of Permafrost underneath Waterbodies in Tundra Landscapes-Toward a Representation of Thermokarst in Land Surface Models. J. Geophys. Res. Earth Surf. 121, 2446–2470. doi:10.1002/2016JF003956
Larsen, A. S., O'Donnell, J. A., Schmidt, J. H., Kristenson, H. J., and Swanson, D. K. (2017). Physical and Chemical Characteristics of Lakes across Heterogeneous Landscapes in Arctic and Subarctic Alaska. J. Geophys. Res. Biogeosci. 122, 989–1008. doi:10.1016/j.jhydrol.2004.03.02810.1002/2016jg003729
Lewis, T., Lafrenière, M. J., and Lamoureux, S. F. (2012). Hydrochemical and Sedimentary Responses of Paired High Arctic Watersheds to Unusual Climate and Permafrost Disturbance, Cape Bounty, Melville Island, Canada. Hydrol. Process. 26, 2003–2018. doi:10.1002/hyp.8335
Littlefair, C. A., Tank, S. E., and Kokelj, S. V. (20172017). Retrogressive Thaw Slumps Temper Dissolved Organic Carbon Delivery to Streams of the Peel Plateau, NWT, Canada. Biogeosciences 14, 5487–5505. doi:10.5194/bg-14-5487-2017
Manasypov, R. M., Pokrovsky, O. S., Kirpotin, S. N., and Shirokova, L. S. (2014). Thermokarst lake Waters across the Permafrost Zones of Western Siberia. The Cryosphere 8, 1177–1193. doi:10.5194/tc-8-1177-2014
Manasypov, R. M., Vorobyev, S. N., Loiko, S. V., Kritzkov, I. V., Shirokova, L. S., Shevchenko, V. P., et al. (2015). Seasonal Dynamics of Organic Carbon and Metals in Thermokarst Lakes from the Discontinuous Permafrost Zone of Western Siberia. Biogeosciences 12, 3009–3028. doi:10.5194/bg-12-3009-2015
Mann, P. J., Eglinton, T. I., McIntyre, C. P., Zimov, N., Davydova, A., Vonk, J. E., et al. (2015). Utilization of Ancient Permafrost Carbon in Headwaters of Arctic Fluvial Networks. Nat. Commun. 6, 7856. doi:10.1038/ncomms8856
Manual Shimadzu/Toc-V, (2008). Shimadzu TOC-V Series Total Organic Carbon Analysator. TOC-V CPH/CPN, TOC-Control V. Version 2.00. Japan: Kyoto.
Meyer, H., Dereviagin, A. Y., Siegert, C., and Hubberten, H.-W. (2002). Paleoclimate Studies on Bykovsky Peninsula, North Siberia – Hydrogen and Oxygen Isotopes in Ground Ice. Polarforschung 70, 37–51.
Meyer, H., Schönicke, L., Wand, U., Hubberten, H. W., and Friedrichsen, H. (2000). Isotope Studies of Hydrogen and Oxygen in Ground Ice - Experiences with the Equilibration Technique. Isotopes Environ. Health Stud. 36 (2), 133–149. doi:10.1080/10256010008032939
Mollenhauer, G., Grotheer, H., Gentz, T., Bonk, E., and Hefter, J. (2021). Standard Operation Procedures and Performance of the MICADAS Radiocarbon Laboratory at Alfred Wegener Institute (AWI), Germany. Nucl. Instr. Methods Phys. Res. Section B: Beam Interactions Mater. Atoms 496, 45–51. doi:10.1016/j.nimb.2021.03.016
Morgenstern, A., Grosse, G., Günther, F., Fedorova, I., and Schirrmeister, L. (2011). Spatial Analyses of Thermokarst Lakes and Basins in Yedoma Landscapes of the Lena Delta. The Cryosphere 5, 849–867. doi:10.5194/tc-5-849-2011
Morgenstern, A., Ulrich, M., Günther, F., Roessler, S., Fedorova, I. V., Rudaya, N. A., et al. (2013). Evolution of Thermokarst in East Siberian Ice-Rich Permafrost: A Case Study. Geomorphology 201, 363–379. doi:10.1016/j.geomorph.2013.07.011
Neff, J. C., Finlay, J. C., Zimov, S. A., Davydov, S. P., Carrasco, J. J., Schuur, E. A. G., et al. (2006). Seasonal Changes in the Age and Structure of Dissolved Organic Carbon in Siberian Rivers and Streams. Geophys. Res. Lett. 33, L23401. doi:10.1029/2006gl028222
Olefeldt, D., and Roulet, N. T. (2012). Effects of Permafrost and Hydrology on the Composition and Transport of Dissolved Organic Carbon in a Subarctic Peatland Complex. J. Geophys. Res. 117, G01005. doi:10.1029/2011JG001819
Opfergelt, S. (2020). The Next Generation of Climate Model Should Account for the Evolution of mineral-organic Interactions with Permafrost Thaw. Environ. Res. Lett. 15 (9), 091003. doi:10.1088/1748-9326/ab9a6d
Raymond, P. A., McClelland, J. W., Holmes, R. M., Zhulidov, A. V., Mull, K., Peterson, B. J., et al. (2007). Flux and Age of Dissolved Organic Carbon Exported to the Arctic Ocean: A Carbon Isotopic Study of the Five Largest Arctic Rivers. Glob. Biogeochem. Cycles 21, a–n. doi:10.1029/2007GB002934
Rogers, J. A., Galy, V., Kellerman, A. M., Chanton, J. P., Zimov, N., and Spencer, R. G. M. (2021). Limited Presence of Permafrost Dissolved Organic Matter in the Kolyma River, Siberia Revealed by Ramped Oxidation. J. Geophys. Res. Biogeosci. 126, e2020JG005977. doi:10.1029/2020JG005977
Ruff, M., Szidat, S., Gäggeler, H. W., Suter, M., Synal, H. A., and Wacker, L. (2010). Gaseous Radiocarbon Measurements of Small Aamples. Nucl. Instrum. Methods Phys. Res. B. 268 (7–8), 790–794. doi:10.1016/j.nimb.2009.10.032
Schirrmeister, L., Grosse, G., Wetterich, S., Overduin, P. P., Strauss, J., Schuur, E. A. G., et al. (2011). Fossil Organic Matter Characteristics in Permafrost Deposits of the Northeast Siberian Arctic. J. Geophys. Res. 116, G00M02. doi:10.1029/2011JG001647
Schneider, J., Grosse, G., and Wagner, D. (2009). Land Cover Classification of Tundra Environments in the Arctic Lena Delta Based on Landsat 7 ETM+ Data and its Application for Upscaling of Methane Emissions. Remote Sens. Environ. 113 (2), 380–391. doi:10.1016/j.rse.2008.10.013
Schuur, E. A. G., Bockheim, J., Canadell, J. G., Euskirchen, E., Field, C. B., Goryachkin, S. V., et al. (2008). Vulnerability of Permafrost Carbon to Climate Change: Implications for the Global Carbon Cycle. BioSci. 58, 701–714. doi:10.1641/B580807
Schuur, E. A. G., McGuire, A. D., Schädel, C., Grosse, G., Harden, J. W., Hayes, D. J., et al. (2015). Climate Change and the Permafrost Carbon Feedback. Nature 520, 171–179. doi:10.1038/nature14338
Schwamborn, G., Rachold, V., and Grigoriev, M. N. (2002). Late Quaternary Sedimentation History of the Lena Delta. Quat. Int. 89 (1), 119–134. doi:10.1016/S1040-6182(01)00084-2
Sepulveda-Jauregui, A., Walter Anthony, K. M., Martinez-Cruz, K., Greene, S., and Thalasso, F. (2015). Methane and Carbon Dioxide Emissions from 40 Lakes along a north-south Latitudinal Transect in Alaska. Biogeosciences 12, 3197–3223. doi:10.5194/bg-12-3197-2015
Shirokova, L. S., Pokrovsky, O. S., Kirpotin, S. N., Desmukh, C., Pokrovsky, B. G., Audry, S., et al. (2013). Biogeochemistry of Organic Carbon, CO2, CH4, and Trace Elements in Thermokarst Water Bodies in Discontinuous Permafrost Zones of Western Siberia. Biogeochemistry 113, 573–593. doi:10.1007/s10533-012-9790-4
Spencer, R. G. M., Mann, P. J., Dittmar, T., Eglinton, T. I., McIntyre, C., Holmes, R. M., et al. (2015). Detecting the Signature of Permafrost Thaw in Arctic Rivers. Geophys. Res. Lett. 42, 2830–2835. doi:10.1002/2015GL063498
Stolpmann, L., Coch, C., Morgenstern, A., Boike, J., Fritz, M., Herzschuh, U., et al. (2021a). First Pan-Arctic Assessment of Dissolved Organic Carbon in Lakes of the Permafrost Region. Biogeosciences 18, 3917–3936. doi:10.5194/bg-18-3917-2021
Stolpmann, L., Boike, J., Morgenstern, A., Eulenburg, A., Bornemann, N., Niemann, S., et al. (2021b). Discharge Measurements in the Lucky Lake Catchment, Kurungnakh Island, Lena River Delta in 2013. PANGAEA. doi:10.1594/PANGAEA.939614
Stolpmann, L., Morgenstern, A., Boike, J., Eulenburg, A., Heim, B., Niemann, S., et al. (2021c). Measurements of Dissolved Organic Carbon and Stable Water Isotopes in the Lucky Lake Catchment, Kurungnakh Island, Lena River Delta (2013–2016). PANGAEA. doi:10.1594/PANGAEA.939591
Strauss, J., Schirrmeister, L., Grosse, G., Wetterich, S., Ulrich, M., Herzschuh, U., et al. (2013). The Deep Permafrost Carbon Pool of the Yedoma Region in Siberia and Alaska. Geophys. Res. Lett. 40, 6165–6170. doi:10.1002/2013GL058088
Strauss, J., Schirrmeister, L., Mangelsdorf, K., Eichhorn, L., Wetterich, S., and Herzschuh, U. (2015). Organic-matter Quality of Deep Permafrost Carbon - a Study from Arctic Siberia. Biogeosciences 12, 2227–2245. doi:10.5194/bg-12-2227-2015
Striegl, R. G., Aiken, G. R., Dornblaser, M. M., Raymond, P. A., and Wickland, K. P. (2005). A Decrease in Discharge-Normalized DOC export by the Yukon River during Summer through Autumn. Geophys. Res. Lett. 32, L21413. doi:10.1029/2005GL024413
Striegl, R. G., Dornblaser, M. M., Aiken, G. R., Wickland, K. P., and Raymond, P. A. (2007). Carbon export and Cycling by the Yukon, Tanana, and Porcupine Rivers, Alaska, 2001-2005. Water Resour. Res. 43, W02411. doi:10.1029/2006WR005201
Surdu, C. M., Duguay, C. R., Brown, L. C., and Fernández Prieto, D. (2014). Response of Ice Cover on Shallow Lakes of the North Slope of Alaska to Contemporary Climate Conditions (1950-2011): Radar Remote-Sensing and Numerical Modeling Data Analysis. The Cryosphere 8, 167–180. doi:10.5194/tc-8-167-2014
Synal, H.-A., Stocker, M., and Suter, M. (2007). MICADAS: a New Compact Radiocarbon AMS System. Nucl. Instr. Methods Phys. Res. Section B: Beam Interactions Mater. Atoms 259 (1), 7–13. doi:10.1016/j.nimb.2007.01.138
Tank, S. E., Vonk, J. E., Walvoord, M. A., McClelland, J. W., Laurion, I., and Abbott, B. W. (2020). Landscape Matters: Predicting the Biogeochemical Effects of Permafrost Thaw on Aquatic Networks with a State Factor Approach. Permafrost and Periglac. Process. 31 (3), 358–370. doi:10.1002/ppp.2057
Tranvik, L. J., Downing, J. A., Cotner, J. B., Loiselle, S. A., Striegl, R. G., Ballatore, T. J., et al. (2009). Lakes and Reservoirs as Regulators of Carbon Cycling and Climate. Limnol. Oceanogr. 54 (6/2), 2298–2314. doi:10.4319/lo.2009.54.6_part_2.2298
Turetsky, M. R., Abbott, B. W., Jones, M. C., Anthony, K. W., Olefeldt, D., Schuur, E. A. G., et al. (2020). Carbon Release through Abrupt Permafrost Thaw. Nat. Geosci. 13, 138–143. doi:10.1038/s41561-019-0526-0
Ulrich, M., Morgenstern, A., Günther, F., Reiss, D., Bauch, K. E., Hauber, E., et al. (2010). Thermokarst in Siberian Ice-Rich Permafrost: Comparison to Asymmetric Scalloped Depressions on Mars. J. Geophys. Res. 115, E10009. doi:10.1029/2010JE003640
Vonk, J. E., Mann, P. J., Davydov, S., Davydova, A., Spencer, R. G. M., Schade, J., et al. (2013a). High Biolability of Ancient Permafrost Carbon upon Thaw. Geophys. Res. Lett. 40, 2689–2693. doi:10.1002/grl.50348
Vonk, J. E., Mann, P. J., Dowdy, K. L., Davydova, A., Davydov, S. P., Zimov, N., et al. (2013b). Dissolved Organic Carbon Loss from Yedoma Permafrost Amplified by Ice Wedge Thaw. Environ. Res. Lett. 8, 035023. doi:10.1088/1748-9326/8/3/035023
Vonk, J. E., Tank, S. E., and Walvoord, M. A. (2019). Integrating Hydrology and Biogeochemistry across Frozen Landscapes. Nat. Commun. 10, 5377. doi:10.1038/s41467-019-13361-5
Walter Anthony, K. M., Zimov, S. A., Grosse, G., Jones, M. C., Anthony, P. M., Iii, F. S. C., et al. (2014). A Shift of Thermokarst Lakes from Carbon Sources to Sinks during the Holocene Epoch. Nature 511, 452–456. doi:10.1038/nature13560
Walter Anthony, K., Daanen, R., Anthony, P., Schneider von Deimling, T., Ping, C.-L., Chanton, J. P., et al. (2016). Methane Emissions Proportional to Permafrost Carbon Thawed in Arctic Lakes since the 1950s. Nat. Geosci. 9, 679–682. doi:10.1038/ngeo2795
Walvoord, M. A., and Kurylyk, B. L. (2016). Hydrologic Impacts of Thawing Permafrost-A Review. Vadose Zone J. 15 (6), vzj2016. doi:10.2136/vzj2016.01.0010
Wickland, K. P., Waldrop, M. P., Aiken, G. R., Koch, J. C., Jorgenson, M. T., and Striegl, R. G. (2018). Dissolved Organic Carbon and Nitrogen Release from Boreal Holocene Permafrost and Seasonally Frozen Soils of Alaska. Environ. Res. Lett. 13 (6), 065011. doi:10.1088/1748-9326/aac4ad
Wik, M., Thornton, B. F., Bastviken, D., Uhlbäck, J., and Crill, P. M. (2016). Biased Sampling of Methane Release from Northern Lakes: A Problem for Extrapolation. Geophys. Res. Lett. 43 (3), 1256–1262. doi:10.1002/2015GL066501
Williamson, C. E., Zepp, R. G., Lucas, R. M., Madronich, S., Austin, A. T., Ballaré, C. L., et al. (2014). Solar Ultraviolet Radiation in a Changing Climate. Nat. Clim. Change 4, 434–441. doi:10.1038/NCLIMATE2225
Xenopoulos, M. A., Lodge, D. M., Frentress, J., Kreps, T. A., Bridgham, S. D., Grossman, E., et al. (2003). Regional Comparisons of Watershed Determinants of Dissolved Organic Carbon in Temperate Lakes from the Upper Great Lakes Region and Selected Regions Globally. Limnol. Oceanogr. 48, 2321–2334. doi:10.4319/lo.2003.48.6.2321
Keywords: Arctic lakes, ice complex, yedoma, thermokarst lakes, DOC, aquatic carbon cycle, permafrost, radiocarbon dating
Citation: Stolpmann L, Mollenhauer G, Morgenstern A, Hammes JS, Boike J, Overduin PP and Grosse G (2022) Origin and Pathways of Dissolved Organic Carbon in a Small Catchment in the Lena River Delta. Front. Earth Sci. 9:759085. doi: 10.3389/feart.2021.759085
Received: 15 August 2021; Accepted: 06 December 2021;
Published: 05 January 2022.
Edited by:
Duane Froese, University of Alberta, CanadaReviewed by:
Jonathan Andrew O'Donnell, National Park Service, United StatesSuzanne Tank, University of Alberta, Canada
Copyright © 2022 Stolpmann, Mollenhauer, Morgenstern, Hammes, Boike, Overduin and Grosse. This is an open-access article distributed under the terms of the Creative Commons Attribution License (CC BY). The use, distribution or reproduction in other forums is permitted, provided the original author(s) and the copyright owner(s) are credited and that the original publication in this journal is cited, in accordance with accepted academic practice. No use, distribution or reproduction is permitted which does not comply with these terms.
*Correspondence: Lydia Stolpmann, lydia.stolpmann@awi.de