

Abstract
Diode lasers generating optical pulses with high peak power and lengths in the nanosecond range are key components for light detection and ranging systems, e.g. for autonomous driving and object detection. We present here an internally wavelength stabilized distributed Bragg reflector broad area laser bar with 48 emitters. The vertical structure based on AlGaAs (confinement and cladding layers) and InGaAs (active quantum well) is specifically optimized for wavelength-stabilized pulsed operation, applying a surface Bragg grating with high reflectivity. The bar is electrically driven by a new in-house developed high-speed driver based on GaN transistors providing current pulses with amplitudes of up to 1000 A and a repetition frequency of 10 kHz. The generated 4 ns to 10 ns long optical pulses are nearly rectangular shaped and reach a pulse peak power in excess of 600 Watts at 25 °C. The optical spectrum with a centre wavelength of about 900 nm has a width of 0.15 nm (FWHM) with a side mode suppression ratio > 30 dB.
Export citation and abstract BibTeX RIS

Original content from this work may be used under the terms of the Creative Commons Attribution 4.0 license. Any further distribution of this work must maintain attribution to the author(s) and the title of the work, journal citation and DOI.
1. Introduction
Diode lasers generating short optical pulses with high peak power are key components for LiDAR (light detection and ranging) systems, e.g. for autonomous driving and object detection or other applications such as free-space communication, metrology, material processing and spectroscopy. In LiDAR systems the distance to objects can be determined by measuring the time difference between the emission of a pulse by the laser and its return, after being reflected by an object. To build up a three-dimensional point cloud of object distances, point, line or flash scanning systems can be employed.
For automotive LiDAR systems 100 ps—10 ns long optical pulses with powers of more than 100 W are needed. Although shorter pulses offer higher spatial resolution and have advantages concerning eye safety due to lower pulse energy the generation of correspondingly short electrical pulses with high current amplitudes is challenging.
Tarasov et al [1] obtained 145 W at an injection current of 200 A (stripe width 100 µm, pulse width 100 ns). Wang et al [2] reported pulse powers of about 120 W from 200 μm, 100 W from 100 µm and 90 W from 60 µm stripe width lasers at an injection current of 240 A (pulse width 300 ns) using a commercial current source. Hoffmann et al [3] generated current pulses with a compact electronic driver based on GaN transistors and obtained 250 W pulse power at an injection current of 430 A (stripe width 400 µm, pulse width 50 ns). The company OSRAM reported the generation of 5 ns long optical pulses with its nanostack lasers (comprising three vertically monolithic integrated lasers). An output power of 85 W at a current of 30 A has been claimed2 .
Beside the requirements on pulse length and power, laser sources to be used for automotive LiDAR systems have to fulfil additional conditions. For example, to avoid absorption by water vapor the emission wavelength has to be shorter than 920 nm, e.g. around 900 nm. To improve the signal to noise ratio, the sun light shining on the detector must be suppressed by optical narrow-band filters. This necessitates emission within a small spectral window over a large temperature range. These requirements can be fulfilled by integrating a wavelength-selective element (e.g. a Bragg grating) as a part of the laser cavity.
In this paper we present for the first time an internally wavelength stabilized diode laser bar with 48 emitters emitting 4 ns to 10 ns long optical pulses with a peak power of 600 watts at a wavelength near 900 nm at room temperature.
2. Laser structure, electronic circuit and experimental setup
The design of layer structure and Bragg grating of the laser bar presented here is similar to that of the distributed Bragg reflector (DBR) broad area (BA) lasers published recently [4–6]. The vertical structure shown in figure 1 is based on AlGaAs confinement and cladding layers and is specifically optimized for wavelength-stabilized pulsed operation to allow the integration of a higher-order surface Bragg grating with high reflectivity. The active region consists of a 12 nm thick InGaAs single quantum well (SQW) sandwiched between GaAsP spacer layers. The relatively large thickness of the SQW was chosen to ensure stable operation over a wide temperature range.
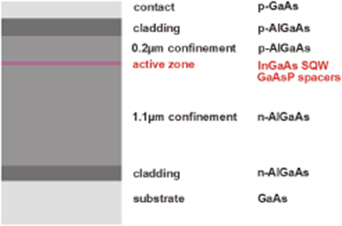
Figure 1. Vertical laser structure.
Download figure:
Standard image High-resolution imageFor a line scanning LiDAR requiring high pulse energy, 48 single emitters with a pitch of 200 µm are combined on a single chip to a DBR BA laser bar. The total cavity length of each emitter is 4 mm. The gain section marked with the violet rectangle in the inset of figure 2 has a length of 3 mm whereas the length of the DBR section is 1 mm (yellow rectangle). For cost-effective manufacturing a 7th order Bragg grating is implemented by dry-etching narrow V-shaped grooves, defined by e-beam lithography, into the surface of the completed epitaxial layer structure so that no regrowth is necessary. The lateral optical and current confinement is provided by trenches dry-etched into the layer structure. The contact stripes have widths of 50 µm. The rear (DBR side) facet is anti-reflection coated and the front facet low-reflection coated to a reflectivity of 1%.
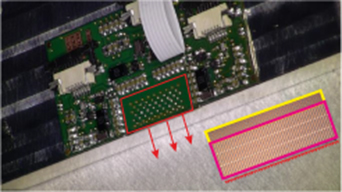
Figure 2. DBR BA laser bar integrated in an electrical pulse driver having four final stages based on GaN transistors. Inset: Bar with the 48 emitters having a total cavity length of 4 mm with a 3 mm gain section (violet) and a 1 mm DBR section (yellow).
Download figure:
Standard image High-resolution imageThe laser bar is soldered p-side down on a CuW submount, mounted between a thin printed circuit board assembly and the ground to minimize inductances, and finally integrated into an electrical driver unit newly developed in-house, see figure 2. The position of the bar is marked with a red rectangle. The arrows show the direction of emission.
To obtain the desired high optical power from the bar, a current of about 20 A has to be injected in each emitter, so that for 48 emitters driven in parallel the driver has to deliver peak currents up to 1000 A. The unique challenges are to provide high-speed high-current switching and to handle the parasitic inductances resulting from the assembly of the laser diode and the driver board. Due to their advantageous semiconductor material properties transistors based on GaN are used in the final stages of the driver board. To obtain the current needed, four driver stages are connected in parallel and are triggered by an external Digital Delay Generator DG 645. Pulse amplitude and width can be controlled internally and externally. Power losses result from the voltage drop over the laser bar, the feeding lines and the switching transistors. The main part of the losses originates from the on-resistance of the transistors. The losses occur only during the on-state of the transistors, i.e. during the laser pulse. Therefore, they are proportional to the repetition rate which is thus limited to about 100 to 150 kHz depending on the cooling system. However the conversion efficiency, i.e. the ratio between optical power and electrical power does not change when varying the repetition rate in the range between 10 and 100 kHz.
The experimental setup used for time resolved electro-optical characterization of the laser bars is shown in figure 3. The power supply used is a HAMEG HM7044. The output of one channel (CH2) is used for voltage feed of the electronics. With a second channel (CH3) the pulse current amplitude can be controlled with a dc output voltage UHAMEG. The averaged current of channel CH3 is measured with a multimeter. Pulse width and repetition frequency are adjusted with a trigger generator DG645. The electrical input power is calculated from measured average current and UHAMEG. With a temperature controller and a water cooled heat sink the temperature of the bar can be varied between 15 °C and 90 °C.
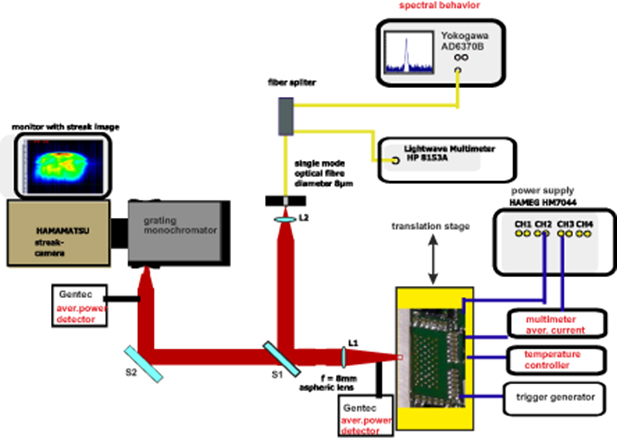
Figure 3. Experimental setup for characterization of the laser bars.
Download figure:
Standard image High-resolution imageThe dependence of the average optical pulse power Pav on the average current Iav flowing into the pulse board is measured directly at the front facet of the bar with a Gentec SOLO 2 equipped with a thermopile power detector HLP12-3 S-H2. The electronic pulse board shown in figure 2 was triggered with electrical pulses τtrig having lengths between 4 and 10 ns and repetition frequencies frep between 10 and 100 kHz. To calculate the pulse power P(t) from the average power, the temporal shape of the optical pulses must be known. For this purpose the pulses emitted by the DBR BA laser bar are coupled into the slit of the monochromator and focussed onto the photocathode of the streak camera by an aspheric lens. Thus lateral near-field profiles and the time resolved optical spectra are measured by coupling the 0th and 1st diffraction orders, respectively, into the streak camera. The pulse shape is obtained by integrating the near-field profiles measured versus time along the lateral position. Due to the fact that the input slit of the monochromator is limited in size, only one emitter of the bar can be measured at the same time. Therefore, a high-precision translation stage (indicated in yellow in figure 3) is used to shift the laser bar so that each emitter can be measured at the same position. For measuring the pulse power of each emitter a Si-detector (PH100-Si-HA) is placed in front of the monochromator. The time-averaged spectra are measured with a 50 µm multimode fibre and an optical spectrum analyser AD6370B with a resolution of 20 pm.
3. Experimental results
In figure 4, an example of a near field measurement of one emitter of the bar and the analysis of the data are given. Figure 4(a) shows the time resolved intensity of the near field of one emitter of the bar with an effective aperture with a width of 60 µm in the time range 0–12 ns as colour scaled mapping, measured with the streak camera. The electrical driver circuit provided current pulses with a width τgen = 5 ns and a total amplitude of 850 A (for all 48 emitters). Clearly, different lateral modes can be seen. By integrating the measured data in horizontal (spatial) direction the dependence of the optical power on time, i.e. the pulse shape is obtained (figure 4(b)). From this curve, the full width at half maximum (FWHM) of the pulse is determined (here τFWHM ∼ 5.1 ns). With the knowledge of repetition frequency frep and optical pulse width τFWHM the optical pulse power Ppulse and pulse current Ipulse can be calculated from the measured average optical power Pav and average current Iav, respectively. The latter can be adjusted by the driver voltage (UHAMEG). By integrating figure 4(a) in vertical (temporal) direction, the total near field intensity in dependence on the lateral position is calculated (figure 4(c)).
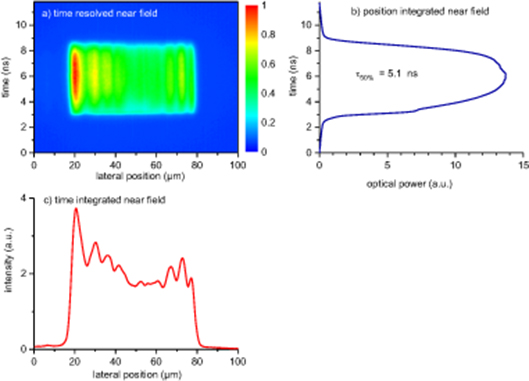
Figure 4. Example of a near field measurement and the analysis of the measured data, (a) colour scaled mapping in time range 0–12 ns, (b) pulse shape calculated by integrating the measured data in horizontal (spatial) direction, (c) near field intensity in dependence on the lateral position by integrating figure 4(a) in vertical (temporal) direction.
Download figure:
Standard image High-resolution imageThe pulse power in dependence on the pulse current of a 48 emitter bar mounted in the quadrupole driver module is shown in figure 5 for 4 ns (blue dots), 5 ns (red solid line) and 10 ns (green asterics) long pulses at a repetition frequency of 10 kHz and a temperature of 25 °C. An optical pulse power of more than 600 W (dotted grey line in figure 5) is reached for all pulse widths. The threshold current is about 30 A and the slope efficiency 0.8 W A−1 up to a pulse current of 500 A. The efficiency drops due to non-linear effects at higher currents. For the maximum pulse current of 1000 A (10 ns pulse width, frep = 10 kHz), a voltage of UHAMEG = 50 V is needed so that only a total conversion efficiency of the complete pulse driver module of 1.2% is reached. This means that more than 98% of the electrical power is lost in the electronic circuits and the laser bar, resulting in a corresponding heating of the whole assembly.
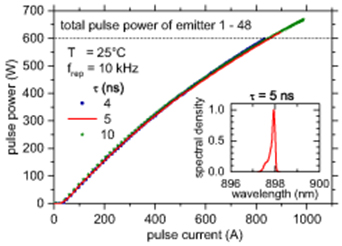
Figure 5. Power–current characteristics of a DBR BA array with 48 emitters at pulse width of 4 ns (blue dots), 5 ns (green asterisks) and 10 ns (red line) as given in the legend. Inset: Optical spectrum of a central emitter for a bar power of 600 W at a pulse width of 5 ns.
Download figure:
Standard image High-resolution imageThe optical spectrum of the central emitter at a peak power of 600 W and a pulse width of 5 ns is shown in the inset of figure 5. The integrated Bragg grating results in a narrow optical spectrum with a width of less than 0.15 nm (FWHM) and a centre wavelength of about 898 nm with a side mode suppression ratio larger than 30 dB.
The temporal behaviour of the generated optical pulses with widths 4 ns (blue), 5 ns (red) and 10 ns (green) for a pulse peak current of 850 A is shown in figure 6. Stable optical pulses with nearly rectangular shapes are generated. The rise and fall times (from 10% to 90% intensity) are about 1.5 ns.
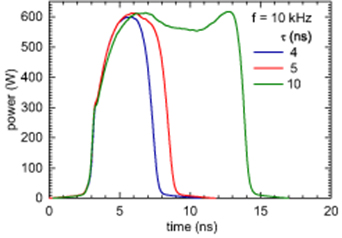
Figure 6. Optical power versus time for pulse widths of 4 ns (blue), 5 ns (green) and 10 ns (red) and a peak current of 850 A.
Download figure:
Standard image High-resolution imageFigure 7 shows the pulse power—pulse current characteristics of the 48-emitter bar in the temperature range between 25 °C and 85 °C at repetition frequencies of 10 kHz (solid lines) and 100 kHz (dashed). The pulse width is 5 ns. At 10 kHz, the maximum pulse power decreases from 700 W at 25 °C to 450 W at 85 °C. A decrease of the maximum pulse current is observed, too, which can be explained by the aforementioned heating up of the electronics. Additionally, a decrease of the efficiency above 500 A (dotted line) occurs. Up to a current of 500 A the power—current characteristics are almost the same for both repetition frequencies. Above 500 A a more pronounced change in efficiency is observed for the repetition frequency of 100 kHz due to additional heating.
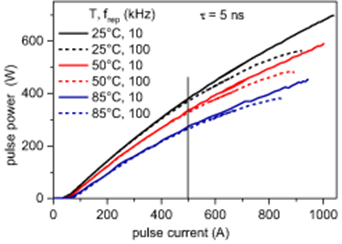
Figure 7. Pulse power—pulse current characteristics in the temperature range 25 °C to 85 °C at repetition frequencies of 10 kHz (solid lines) and 100 kHz (dashed).
Download figure:
Standard image High-resolution imageSingle emitter average power—average current characteristics of 9 of the 48 emitters of the bar are shown in figure 8 for a repetition frequency of 10 kHz and a pulse width of 5 ns. Here the high-precision translation stage is used to shift the laser bar so that each emitter is measured at the same position. Emitters on the outer parts of the laser bar are plotted with solid lines, while more central emitters are shown in dashed lines. The central emitter is depicted as a cyan dotted line.
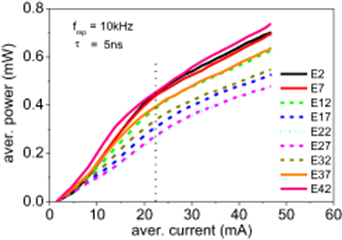
Figure 8. Single emitter average power—average current characteristics of nine different single emitters of the bar at a repetition frequency of 10 kHz and a pulse width of 5 ns. Emitters on the outer parts of the laser bar (2, 7, 37, 42) are plotted with solid lines while more central emitters (12, 17, 27, 32) are dashed. The central emitter (22) is depicted as a cyan dotted line.
Download figure:
Standard image High-resolution imageIt can be seen that the output power depends on the position of the emitter on the bar. The outer emitters (2, 7, 37, 42) have a higher average power in comparison to the inner ones. The difference in power between emitter 42 (highest power) to emitter 22 (lowest power) at about Iaver ∼ 47 mA is 35%. This means that the current distribution is inhomogeneous along the bar. The efficiency of the emitters and its variation with current are different, too. The average spectral behaviour of the emitted power of the central emitter of the bar (see figure 4 inset) was investigated under different injection conditions: by varying UHAMEG, temperatures and repetition frequencies. Figure 9 shows the average optical spectra at UHAMEG = 20 V (black curves), 30 V (red), 40 V (green) and 50 V (blue) for T = 25 °C (solid lines) and T = 85 °C (dashed) measured at repetition frequencies of 10 kHz (figure 9(a)) and 100 kHz (figure 9(b)) with an optical spectrum analyser. The pulse width is 5 ns. At 25 °C, UHAMEG = 20 V and frep = 10 kHz the central wavelength is 897.86 nm (black curve). By increasing UHAMEG to 50 V, the wavelength increases to 897.94 nm corresponding to a very small wavelength shift Δλ of about 0.1 nm and a corresponding temperature increase ΔT of about 1.5 °C. By increasing the temperature from 25 °C to 85 °C the measured wavelength shift is 3.9 nm corresponding to Δλ/Δ T ∼ 65 pm K−1. At T = 85 °C the wavelength shift of Δλ = 0.1 nm with voltage (current) is the same as for 25 °C. Hence, for a repetition frequency of 10 kHz, the wavelength shift of the averaged spectra is independent of the temperature.
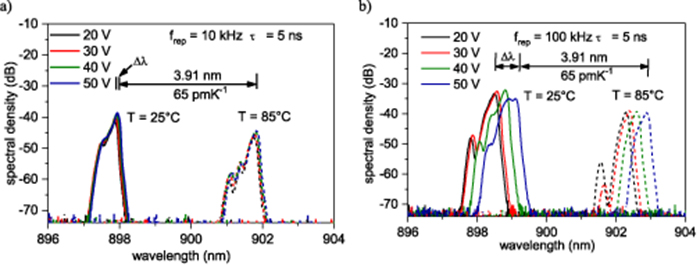
Figure 9. Time averaged optical spectra at UHAMEG = 20 V (black curves), 30 V (red), 40 V (green) and 50 V (blue) for T = 25 °C (solid lines) and T = 85 °C (dashed) measured at repetition frequencies of 10 kHz (a) and 100 kHz (b) and a pulse width of 5 ns. The wavelength shift Δλ with increasing HAMEG voltage is indicated.
Download figure:
Standard image High-resolution imageBy increasing the repetition frequency from 10 kHz to 100 kHz (figure 9(b)) the shift Δλ of the wavelength with increasing UHAMEG rises. At 25 °C and UHAMEG = 20 V the central wavelength is 898.51 nm (black curve) and increases to 899.11 nm at UHAMEG = 50 V. This wavelength shift of Δλ = 0.6 nm during the measuring time of the spectrum analyser corresponds to a temperature increase of about 9 K. The measured wavelength shift with temperature (25 °C to 85 °C) is again 3.9 nm.
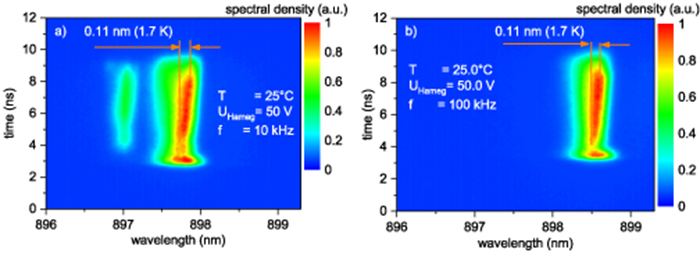
To investigate the reason for the wavelength shift Δλ, time resolved optical spectra are measured with the streak camera. Figure 10 shows the time resolved intensity of the optical spectrum of one emitter of the bar during a single pulse in the time range between 0 ns and 12 ns as colour scaled mapping for repetition frequencies of 10 kHz (figure 10(a)) and 100 kHz (figure 10(b)) at UHAMEG = 50 V. After the decay of the turn-on behaviour a moderate shift of about 0.11 nm to longer wavelengths due to local heating occurs (temperature rise 1.7 K). This wavelength shift is the same for repetition frequencies frep of 10 kHz and 100 kHz indicating that the heating during a single pulse is independent of frep. By comparing the peak wavelengths between 10 kHz and 100 kHz a difference of about 0.7 nm can be seen comparable with the blue curve in figure 9.
Figure 10. Color-scaled mapping of time resolved optical spectra measured with a streak camera at repetition frequencies of 10 kHz (a) and 100 kHz (b) and a pulse width of 5 ns at UHAMEG = 50 V.
Download figure:
Standard image High-resolution image
From this measurement it can be concluded, that the shift Δλ = 0.6 nm of the wavelength with rising HAMEG voltages, seen in figure 9(b), is a result of a temperature rise of the laser mount due to higher averaged electrical power losses in the electronic circuit at 100 kHz compared to that for 10 kHz repetition frequency.
4. Summary
DBR BA laser bars comprising 48 emitters with internal wavelength stabilisation were realized. The laser properties were investigated in dependence of pulse width, temperature, repetition frequency and emitter position.
With a novel in-house developed high-speed electrical pulse driver based on GaN transistors 4 ns to 10 ns long current pulses with amplitudes of up to 1000 A were generated. With a 4 mm long laser bar an optical pulse power of more than 600 W was reached for a repetition frequency of 10 kHz at a temperature of 25 °C. The integrated Bragg grating resulted in a narrow optical spectrum with a width of less than 0.15 nm (FWHM) and a peak wavelength of about 900 nm. The side mode suppression ratio exceeded 30 dB. By increasing the repetition frequency the pulse power decreased and the spectrum shifted to longer wavelengths due to a heating of the assembly caused by higher electrical power losses in the electronic circuit. The output powers of different emitters of the bar were significantly different due to an inhomogeneous current distribution over the bar. Thus for line scanning LiDAR applications, where a high pulse energy is needed DBR BA lasers are well suited. The presented properties enable the use of such laser bars in automotive line scanning LiDAR systems.
Acknowledgments
This work was supported by the German Federal Ministry of Education and Research contract 13N14026 as part of the EffiLAS/PLuS project. We thank P Ressel for facet coating and M Krichler and J Hopp for experimental support.
Footnotes
- 2
Osram presents prototype multi-channel laser for scanning LIDAR in self-driving cars (available at: http://www.semiconductortoday.com/news_items/2016/nov/osram_071116.shtml).