Operational Flood Risk Index Mapping for Disaster Risk Reduction Using Earth Observations and Cloud Computing Technologies: A Case Study on Myanmar
 Kittiphong Phongsapan1
  Farrukh Chishtie1*
  Ate Poortinga2
  Biplov Bhandari1
  Chinaporn Meechaiya1
  Thannarot Kunlamai1
  Khun San Aung1
  David Saah2,3
  Eric Anderson4,5
  Kel Markert4,5
  Amanda Markert4,5
  Peeranan Towashiraporn1
- 1Asian Disaster Preparedness Center, Bangkok, Thailand
- 2Spatial Informatics Group, LLC, Pleasanton, CA, United States
- 3Geospatial Analysis Lab, University of San Francisco, San Francisco, CA, United States
- 4Earth System Science Center, The University of Alabama in Huntsville, Huntsville, AL, United States
- 5SERVIR Science Coordination Office, NASA Marshall Space Flight Center, Huntsville, AL, United States
People, livelihoods, and infrastructure in Myanmar suffer from devastating monsoonal flooding on a frequent basis. Quick and effective management of flood risk relies on planning and preparedness to ensure the availability of supplies, shelters and emergency response personnel. The mandated government agency Department of Disaster Management (DDM) as well as local and international organizations play roles in producing, disseminating, and using accurate and timely information on flood risk. Currently, systematic flood risk maps are lacking, which leaves DDM to rely on inconsistent historic reports and local knowledge to inform their emergency planning. Although these types of knowledge are critical, they can be complemented to reduce bias and human error to planning processes and decisions. As such, the present situation has led to ineffective distribution of emergency response resources prior to flooding, leaving vulnerable populations less-than-prepared for inevitable flood events. Given these issues, we have developed a flood risk decision-support tool in collaboration with DDM. The tool uses surface water maps developed by the Joint Research Center (JRC), which were derived from more than 30 years of Landsat imagery. We have also incorporated population data, land cover data, and other information on flood exposure and vulnerability to create the first scalable and replicable Flood Risk Index (FRI) for flood risk reduction in Myanmar.
1. Introduction
Floods are considered to be one of the most recurrent natural hazards which can rapidly become significant disasters. Impacts of floods are amplified in the wake of increased vulnerability due to many factors such as rapid land cover changes (Markert et al., 2018b), urbanization, and changing climate (Tolentino et al., 2016). According to a recent United Nations Office for Disaster Risk Reduction report, floods were reported to be the most frequent disasters, where 3,148 occurrences accounted for 43.4% of total types of disasters from 1998 to 2017. The damages from these events were also found to be the largest at an estimated 2 billion lives affected, which accounted for 45% of the total impacts from all disasters (Wannous and Velasquez, 2017). Developing countries are particularly vulnerable to floods due to the lack of resources to prevent, mitigate, and adequately respond to floods (Adger et al., 2003; Douglas et al., 2008; Poortinga et al., 2017).
Given the occurrence and widespread damages due to floods, it becomes imperative to address flood risks from a disaster risk reduction (DRR) approach. In this regard, a variety of scientific approaches are being used for mapping flood hazard and informing risk assessments. Risk assessment is a key component in risk management and reduction in the broader sense. Disaster management aims to avoid or reduce potential risks from floods and assure immediate and appropriate response to flood events. Furthermore, effective disaster management enables rapid and effective recovery after a flood event. Four phases of disaster management have been used by governments, including mitigation, preparation, response, and recovery (Thieken et al., 2007; Carter, 2008). Implementing these four components in a disaster risk reduction approach is expected to increase resilience and reduce economic and human losses.
Flood risk is a function of spatio-temporal hazard of floods, exposure to floods, and vulnerability to floods (UNISDR, 2011). Flood hazard is defined by the spatial extent and temporal frequency of flood events themselves (Winsemius et al., 2013). Exposure is considered by the intersection of the hazard with the people and assets who may experience the hazard. Vulnerability refers to the susceptibility of those people and objects to potential loss and is defined by their intrinsic characteristics (Alexander, 2002; Plate, 2002). Flood risk is a combination of the magnitude and frequency of the hazard, along with the vulnerability of people and assets exposed to floods (Alexander, 2002). Hence, understanding of the geographic location and extents is an essential input into any flood risk assessment.
Winsemius et al. (2013) identified the probability density of flood hazard, socio-economic indicators, resilience, and adaptive capacity as main components of their flood risk framework. Reducing the probability of a flood hazard affecting populations is therefore a straightforward way to reduce flood risk. Probability of flood can be derived from historic records and flood forecasting systems (Carsell et al., 2004; Verkade and Werner, 2011). However, forecasting systems adequate for local and national disaster management often rely on complex models that require extensive inputs and computational power. Developing countries often lack the capacity, infrastructure and data to run such sophisticated models. Despite the complex nature of flood events, knowledge of the location and extent of floods is often concentrated in specific flood prone areas. Thorough analysis of historical data is therefore crucial in complementing existing knowledge to better identify flood prone areas.
It has been recognized that socio-economic and vulnerability data are crucial components in disaster risk reduction (Gornitz, 1991). Studies of e.g., Abuodha and Woodroffe (2006) and Boruff et al. (2005) include examples of vulnerability analyses that include statistical data on education, family structure, and social dependence in a robust and consistent manner. Such vulnerability indices are useful in distinguishing the relative vulnerabilities of different areas to disasters (Balica et al., 2012). Recognition of the spatio-temporal dimensions in the local context are important in determining the degree of flood exposure and vulnerability. Geographic Information Systems (GIS) are useful in managing and analyzing data from different sources to map and understand the spatio-temporal dynamics of flood risk.
Recent advances in the field of EO have resulted in technologies and products that make data more easily accessible for non-experts. Examples are cloud-based platform for planetary-scale environmental data analysis (Gorelick et al., 2017) that allow for the development of real-time applications to monitor environmental conditions (Simons et al., 2017; Markert et al., 2018b; Poortinga et al., 2018, 2019). Moreover, there are a large variety of readily available EO derived global products on surface water extent (Pekel et al., 2016), rainfall (Funk et al., 2015), surface elevation (Farr et al., 2007; Tadono et al., 2016), and others. These data can be used directly without experience in processing raw satellite data. These products are a great resource in a wide variety of disciplines including hazard and risk mapping.
In this study we present an innovative approach to flood risk mapping in a disaster risk reduction framework, leveraging open data and state-of-the-art cloud computing technologies. We present a framework to map spatially explicit flood hazard, exposure and vulnerability, and to merge those data into a single flood risk index (FRI). The study is presented in the context of Myanmar, a developing nation that faces many challenges in the field of disaster risk reduction. The work conducted was under the auspices of the SERVIR-Mekong project, which is a collaborative venture between the US National Aeronautics and Space Administration (NASA) and the US Agency for International Development. Given the mandate of serving the Lower Mekong countries, SERVIR-Mekong presently addresses the needs of Cambodia, Laos, Myanmar, Thailand and Vietnam. Driven by user-based needs, this program responds to local issues via provision of cutting edge EO, science and associated technologies as solutions to development challenges. Key among these needs are requirements for addressing various aspects of floods, which includes hazard and risk mapping, monitoring, and forecasting, via provision of publicly available EO within user-defined web based applications. Toward addressing flood hazard mapping, SERVIR-Mekong has developed a Historical Flood Analysis (HFA) product which was modified to meet the flood hazard mapping requirement by the Department of Disaster Management (DDM), Myanmar. This product is based on open source approach and is available here: https://hfa.adpc.net/en/.
2. Materials and Methods
2.1. Study Area
Myanmar is located in Southeast Asia and shares its borders with China, Lao People's Democratic Republic, Thailand, Bangladesh and India (Figure 1). Myanmar's climate is classified as a tropical monsoon climate and experiences heavy rainfall events. It has high humidity and an annual average temperature ranging from 22 to 27°C. The monsoon gives variations in the water levels of the Ayeyarwaddy, Chindwin, Thanlwin, and Sittoung, which are the four main rivers in the country (Taft and Evers, 2016). These rivers are a vital source for drinking water, transportation, irrigation and generation of electricity. However, due to regular flooding events in the monsoon season, effective disaster management is a major concern which requires a systematic approach to address the impacts of these events. Toward meeting these aims, in the following sections, we provide details of an operational index developed for flood risk assessment for Myanmar.
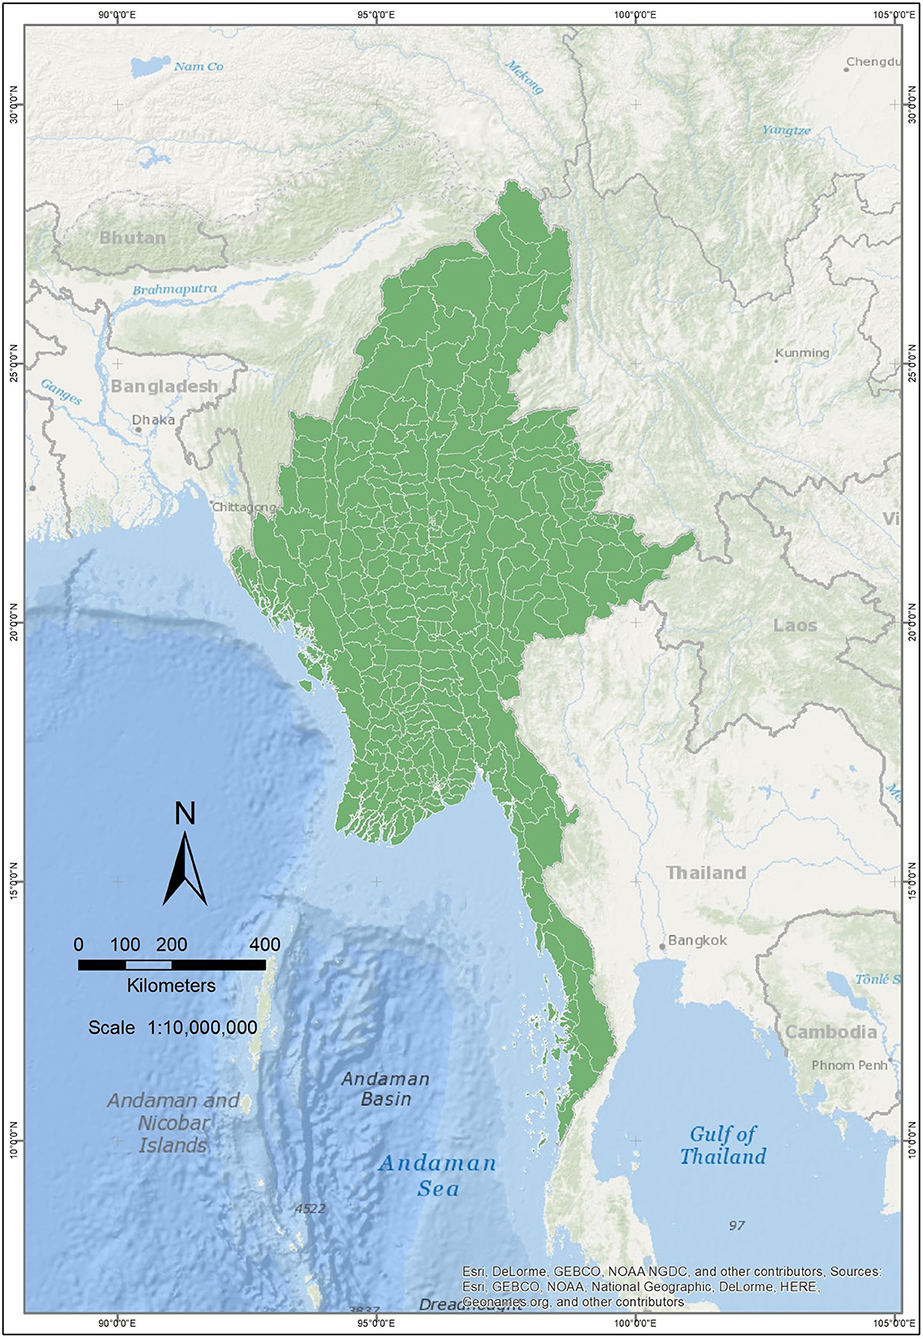
Figure 1. Political map of Myanmar/Southeast Asia.
2.2. Flood Risk Assessment
Flood risk is calculated from various sources of information including satellite-derived data products and area-aggregated statistical data. Most data layers are normalized so that data from different sources can be compared qualitatively. The final risk map is calculated using Equation (1), multiplying the flood hazard, flood exposure, and flood vulnerability indices. Figure 2 shows that different data layers are used to calculate the hazard, exposure, and vulnerability and how those layers are combined into the final flood risk index. The flood risk index (FRI) is calculated from the risk map, in which risk values are aggregated over a township. We describe how the different indices are calculated in the following sections.
where:
FHI = Flood frequency (-)
FEI = Exposure (-)
FVI = Vulnerability (-).
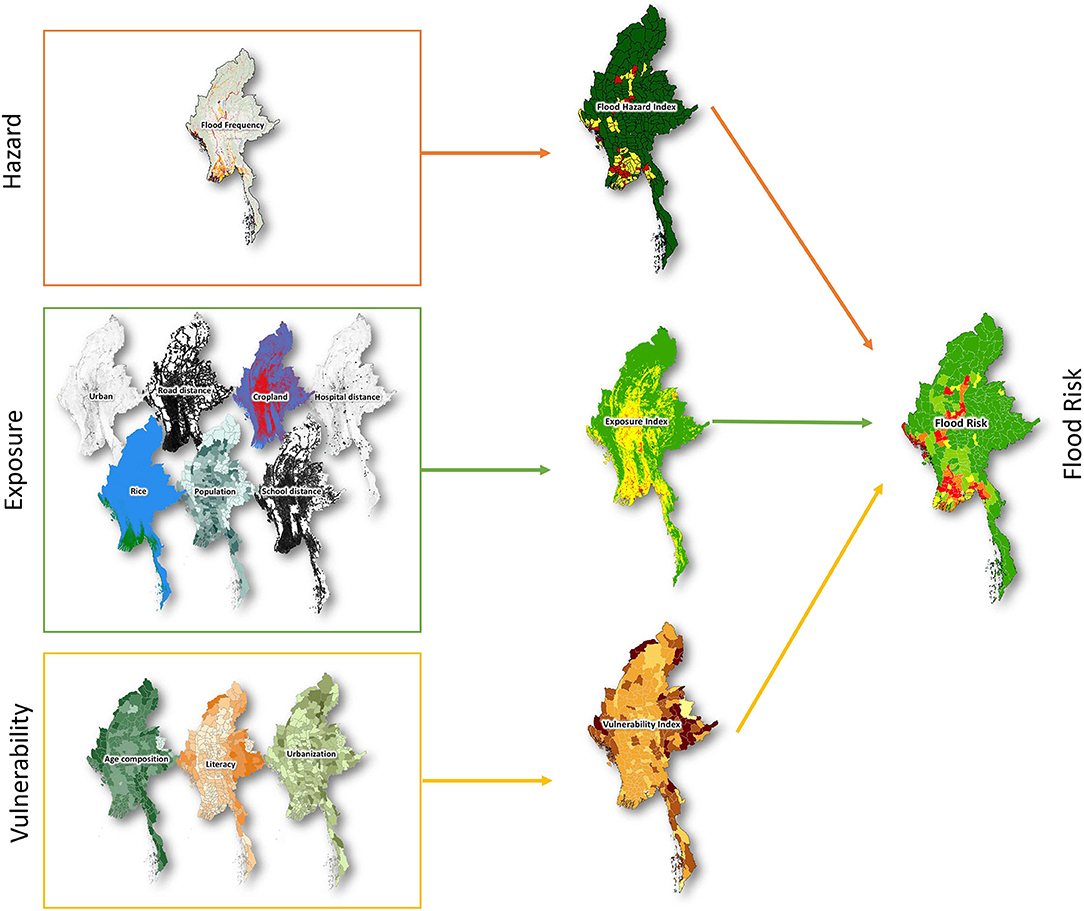
Figure 2. Schematic overview of how the indices on Hazard, Exposure, and Vulnerability are combined into the flood risk index.
2.3. Flood Hazard Index
Historical trends in flooding are important for understanding the current risk and what might happen in the future (Klis et al., 2005). As field data are scattered and difficult to obtain in Myanmar, we used remote sensing derived products to estimate flood hazard from historical data. The JRC global water dataset was used to generate flood frequency maps across Myanmar. The JRC team developed a method to calculate water pixels from Landsat satellite imagery. The imagery is going through a sequence of steps where they detect water while accounting for false positives including shadow effects. The JRC Monthly Water History (V1) was used in this study. The dataset contains monthly layers of the location and temporal distribution of surface water from 1984 to 2015. The data contains information on (0) no data, (1) not water and (2) water. The flood frequency for any given period is calculated by dividing the number of water observation by total number of observation where no data is not taken into account. We used all available Landsat data in the JRC tool as historical occurrence contain valuable information on the probability of occurrence. As the data-series contains monthly layers, different time-slices such as months or seasons could also be investigated.
Permanent water was removed from the data in order to only include flood events. The United Nations Institute for Training and Research (UNITAR) provides data on natural disasters through the Operational Satellite Applications Programme (UNOSAT) including flood maps. The UNOSAT flood map is a well recognized data source and was used to distinguish permanent from temporary water. We used the 2015 data for the comparison. Figure 3 shows both our water occurrence map and the UNOSAT permanent water data. It can be seen that pixels with high water occurrence values are marked as permanent water in the UNOSAT data. By cross-walking the data, we found 82% a suitable threshold to distinguish permanent from temporary water in our study area. Permanent waters were masked out to distinguish them from flooded areas.
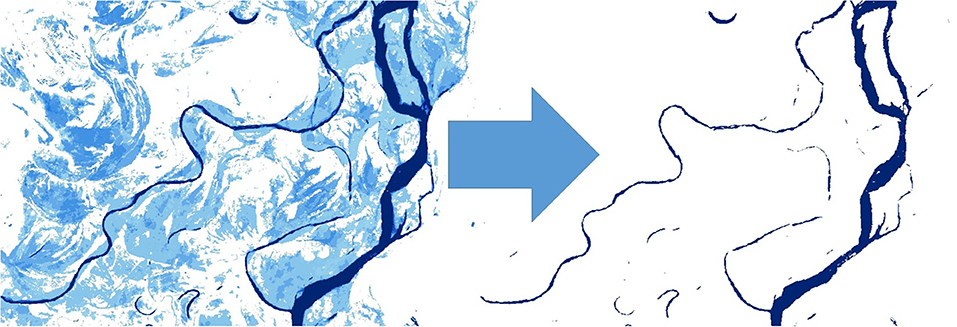
Figure 3. The water occurrence map calculated from the JRC surface water data (left) and UNOSAT permanent water map data on the right.
2.4. Flood Exposure Index
Exposure to floods is defined by the assets and values located in flood-prone areas (Jongman et al., 2014). We separated between assets that are under direct threat from flood (i.e., land use) and the distance from assets that offer potential relief to people exposed to floods. In the category of assets we used a landcover map containing information on urban, cropland and rice. We consider these classes important for supporting livelihood which could be negatively impacted by floods. In the other category we calculated distance from hospitals, schools and roads as they provide shelter to the people in case of flood emergencies. The population density was taken into account as the most important factor. The calculation for exposure is shown in Equation (2) and the data sources are shown in Table 1. The different data-layers are described in the next sections.
where:
FEI = Flood Exposure Index (-)
Wp = Population data (-)
C = Cropland (-)
R = Rice (-)
U = Urban (-)
Sd = School distance (-)
Hd = Hospital distance (-)
Rd = Road distance (-).
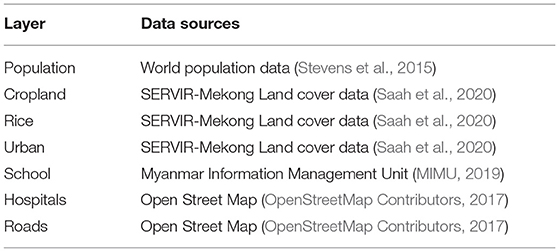
Table 1. Data sources for the Flood Exposure Index (FEI; Equation 2).
2.4.1. Land Cover
Buildings and agricultural lands are directly affected by floods due to loss of property and means of production. Whereas floods have played an important role in traditional agricultural systems (Van Liere, 1980), they have also caused severe damage to the major crops and threatening the food security of large regions (Del Ninno et al., 2003). We used the SERVIR-Mekong cropland, rice and urban probability layers from the regional land cover monitoring system (https://rlcms-servir.adpc.net/en/). These yearly maps were created from the Landsat legacy archive using reference data from the field and collected through high resolutions satellite imagery (Saah et al., 2019) in a machine learning algorithm. The probability layers were scaled between 0 and 1. The rice map was multiplied by a 0.5 fraction as the negative consequences of floods on rice are generally less severe in comparison to other land cover types.
2.4.2. Infrastructure
Infrastructure is a key component in disaster risk reduction as failure or capacity degradation directly affects the community (Luathep et al., 2013). We selected hospitals, schools and roads as the key components for the risk assessment. Roads are the lifeline for communities of goods and services and enable people to evacuate from the area in case of emergency. Hospitals also provide direct relief to crisis situations for affected people in the neighborhood. Schools play an important role in raising awareness among students, teachers, and parents (Strike, 2000). The school can also serve as a shelter when the integrity of the building compromised during the flood. We used the Open Street Map data vector data and calculated the shortest distance to a feature on a 30 by 30 meter grid. The maximum distance was set to 10 km. These data were normalized to values between 0 and 1.
2.4.3. Population
Inundation of densely populated areas poses many threats including the loss of human lives and property as well as the spread of infectious diseases (Levy et al., 2016). Population exposure was calculated with the Worldpop dataset. We used the 2015 national totals adjusted to match UN population division estimates (Stevens et al., 2015). The product was created using a random forest regression tree-based mapping approach integrating census and a wide range of remotely-sensed and geospatial datasets.
2.5. Flood Vulnerability Index
Vulnerability reduction and increasing resilience are key components in disaster risk reduction. A first step is to analyze the current vulnerability of a community, township or region to floods. However, there are a wide variety of definitions of vulnerability including a variety of different indicators (e.g., Cannon, 1994; Pelling et al., 2004; Borden et al., 2007). We include three main socio-economic indicators of literacy, age composition and urbanization, as data on other indicators were found to be scarce. These data were collected from (http://www.dop.gov.mm/en) and contain data on the township level. All data were scaled between 0 and 1 using the maximum value. This approach was suited to be appropriate as it reflects the relative vulnerability on a country level. Higher literacy was considered to decrease vulnerability. In the age composition young and old people were considered to be more vulnerable. Rural people were also considered to be more vulnerable than people in the city. The composition of these vulnerabilities are formulated in an equation shown below (Equation 3).
where:
FVI = Vulnerability Index (-)
A = Age composition (-)
U = Urbanization (-)
L = Literacy (-).
2.6. Flood Risk Index
The flood risk data were aggregated based on administrative boundaries, which was used for risk index calculations. Data aggregation on the administrative level was done to align it with the scales of social-economic including information on social vulnerability, environmental vulnerability and capacity. Another advantage of data aggregation is the reduction of uncertainty related to individual pixels.
We aggregated the pixel based maps on flood hazard and exposure into administrative boundaries (with township boundary representing a particular flood hazard index) by summing up all the pixel values and then divided this by the township area. The FRI Equation (1) and figure below describe the calculation of the flood hazard index for individual Township. Flood risk per pixel is represented by Fi, N is the number of pixels per township and A the area of Township (km2). A graphical presentation is shown in Figure 4, where two townships are compared. It can be seen that township A has a higher FHI than township B.
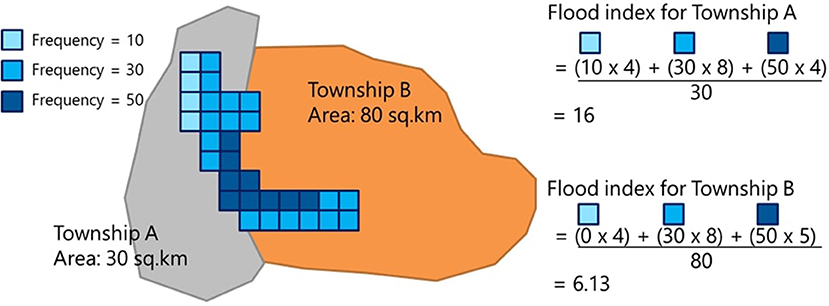
Figure 4. Example of flood hazard index calculation for individual Townships.
2.7. Computational Framework
The workflow was built using Google Earth Engine (GEE). This is an online platform that applies cloud computing and storage frameworks to allow for parallel calculations of large geospatial datasets (Gorelick et al., 2017). The archive contains a large amount of Earth observations data such as the JRC global surface water product. Detailed information on the GEE can be found in the website (https://earthengine.google.com/). The GEE has a Python Application Programming Interface (API) which can be used to develop web applications. The web application provides an interface to the data while calculations and visualizations are done in real time. All data layers were ingested into the GEE which enables users to investigate the separate risk components and apply different weighing factors in the flood risk analysis.
3. Results
The flood hazard map containing the flood frequencies for the period 1984–2015 is shown in Figure 5. Areas with high flood occurrence can be found near the Irrawaddy river and in the delta and near the coast. The central part of the country also shows areas with historical floods. It can be noted that recently constructed dams are visible in the map.
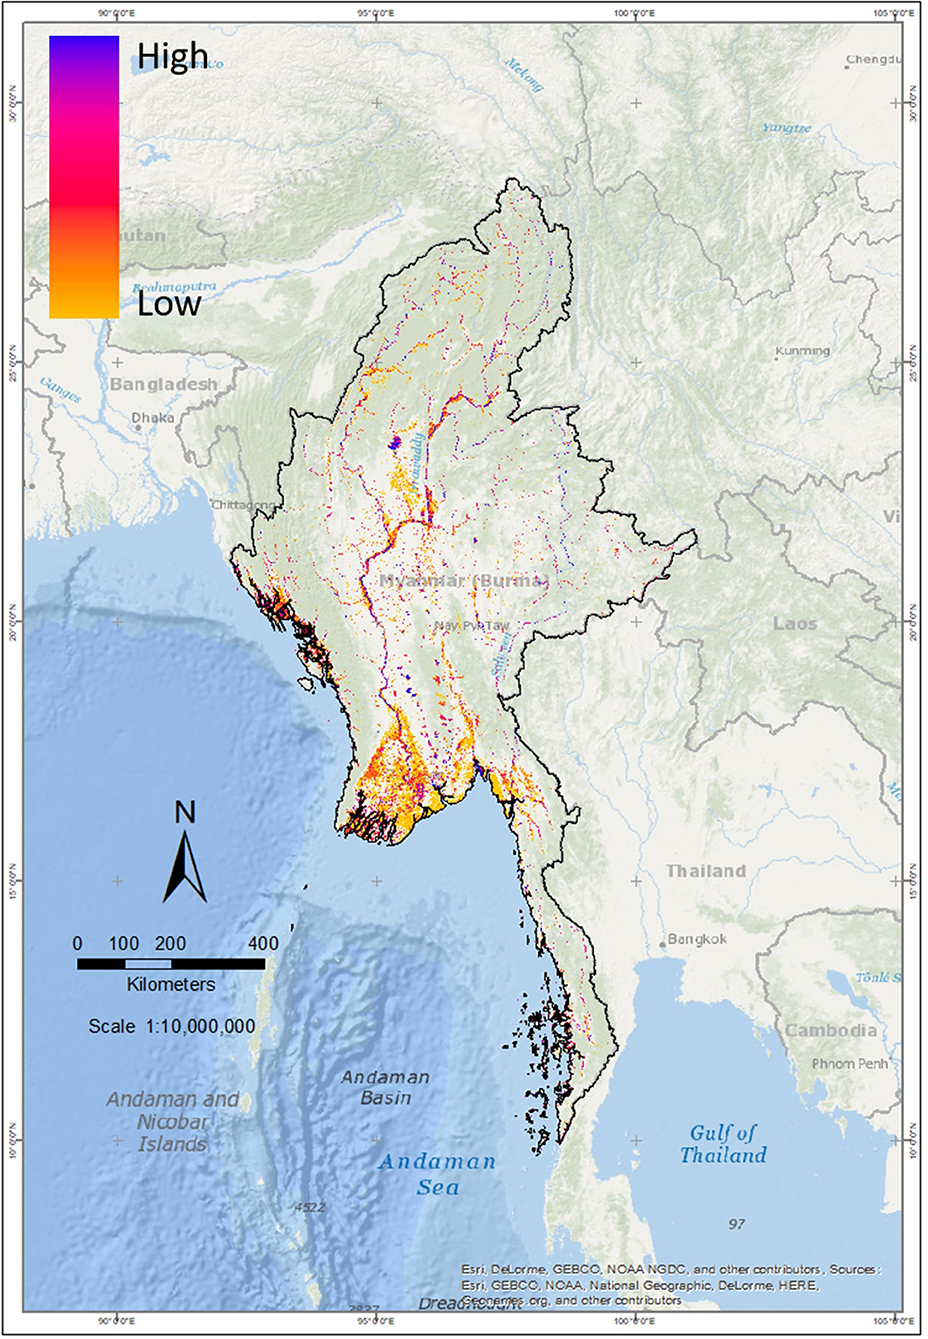
Figure 5. Flood frequency map of Myanmar calculated from the JRC surface water data.
The exposure map is shown in Figure 6. It can be seen that the vegetated highlands have a low exposure while the higher exposure can be found in the agricultural and population centers. The coastal areas of the Rakhine State, located at the western coast also show high exposure rates. Naypyitaw is the modern capital of and Yangon, the former capital also show high exposure risk. We also found higher exposure risk along the Irrawaddy river. This river is one of the least regulated rivers in Asia (Hedley et al., 2010; Taft and Evers, 2016) and known for its dynamic morphology.
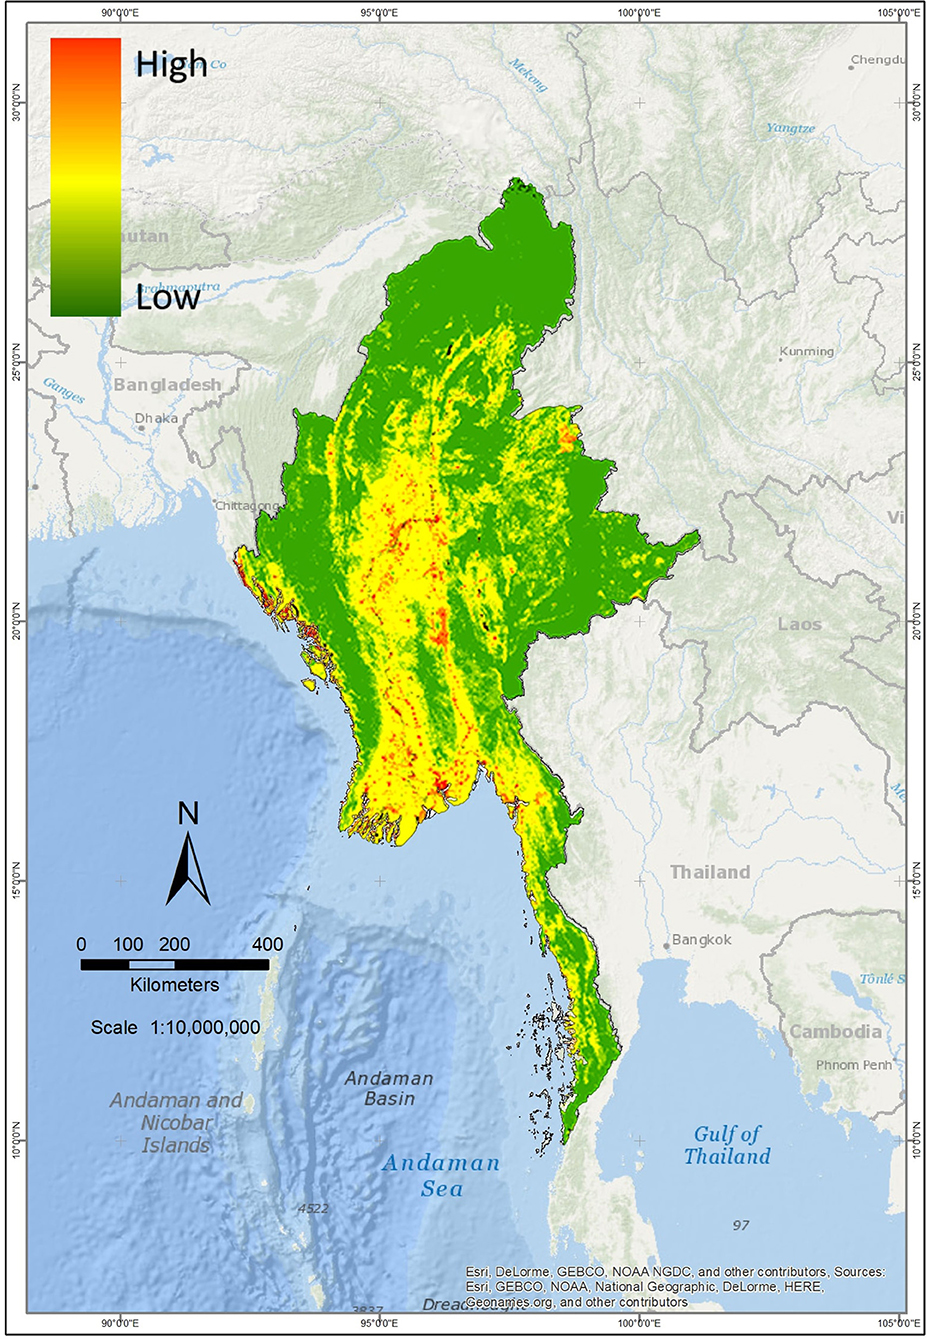
Figure 6. Flood exposure map of Myanmar. Flood exposure includes land cover, infrastructural, and population data.
The flood vulnerability map composed from age composition, literacy, and urbanization, is shown in Figure 7. The map shows the risk in different shades of brown and districts with no information are shown in white. In contrast to the flood frequency and exposure map, the vulnerability map is calculated on a district level. Shan State in the eastern part of the country bordering China and Thailand shows a particular high vulnerability. But also districts in western Myanmar show high vulnerability. The lowlands show a generally low to medium level of vulnerability.
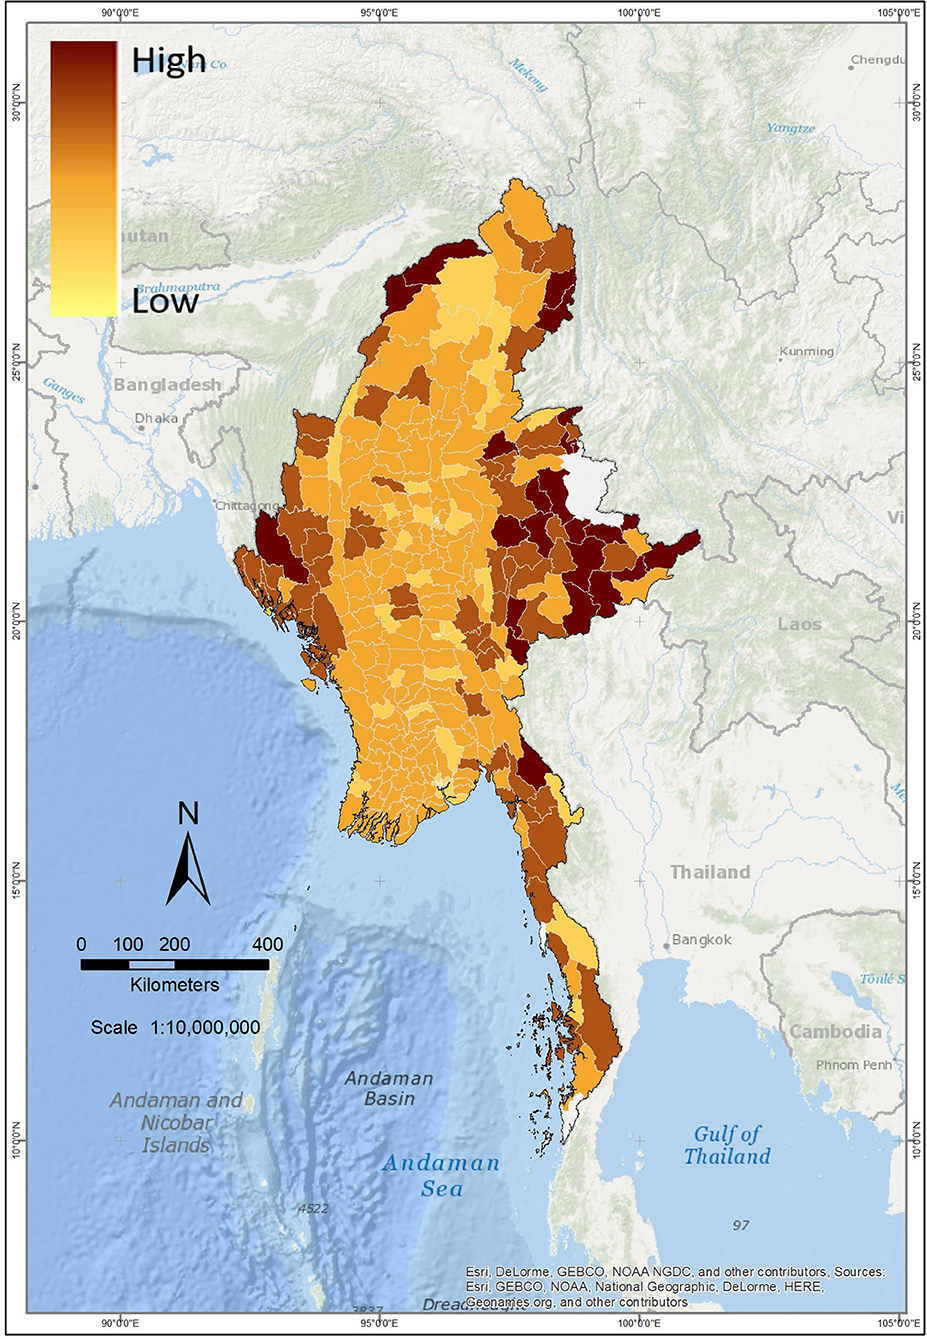
Figure 7. Flood vulnerability on a township level for Myanmar. Vulnerability was calculated from literacy, population composition, and urbanization.
The flood risk map for the country on a pixel level is shown in Figure 8. It can be seen that the Irrawaddy delta and coastal regions in western Myanmar have the highest risk. But also riverine areas throughout the country show higher risk. The high risk in central Myanmar is particularly notable. It can also be seen that the eastern and western provinces, which have vulnerability show a low risks because of the low hazard and exposure rates.
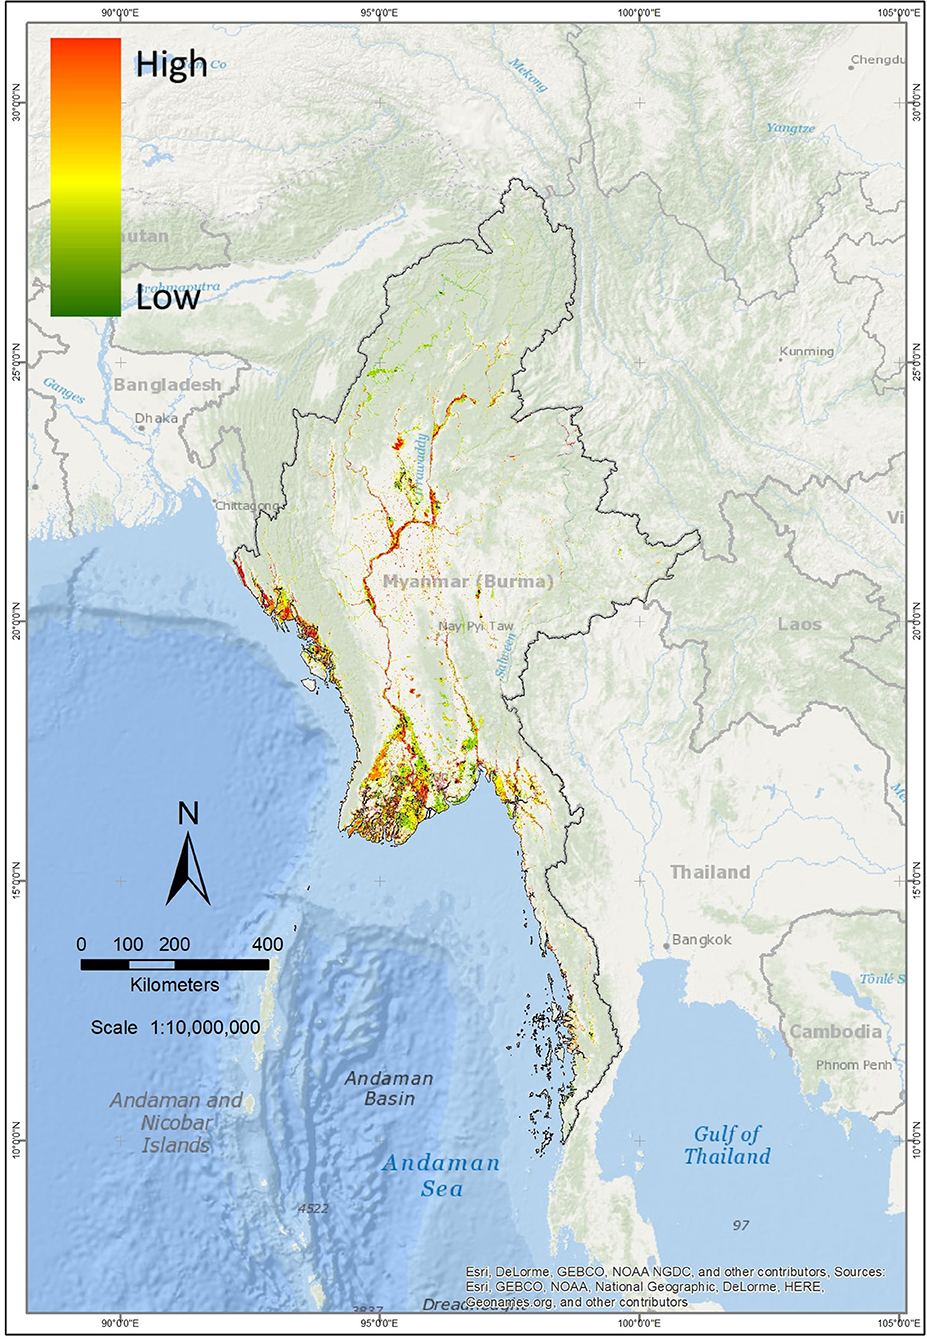
Figure 8. Flood risk at the country-wide scale for Myanmar.
We calculated the FHI for all townships in Myanmar and normalized the values between 0 an 100 using the minimum and maximum values. We then created three categories of low, moderate and high to classify township in an easy to understand manner. Classification was done by means of data exploration and expert knowledge. The threshold classification are <5 percent, 5–10 percent and more than 10 percent. Those percentage represents low, moderate and high classification respectively. The resulting map is shown in Figure 9. It can be seen that districts with a high risk are concentrated in the deltas and central parts of the country. Population centers such as Yangon and Mandalay were found to have a high risk whereas Naypyitaw has a low risk.
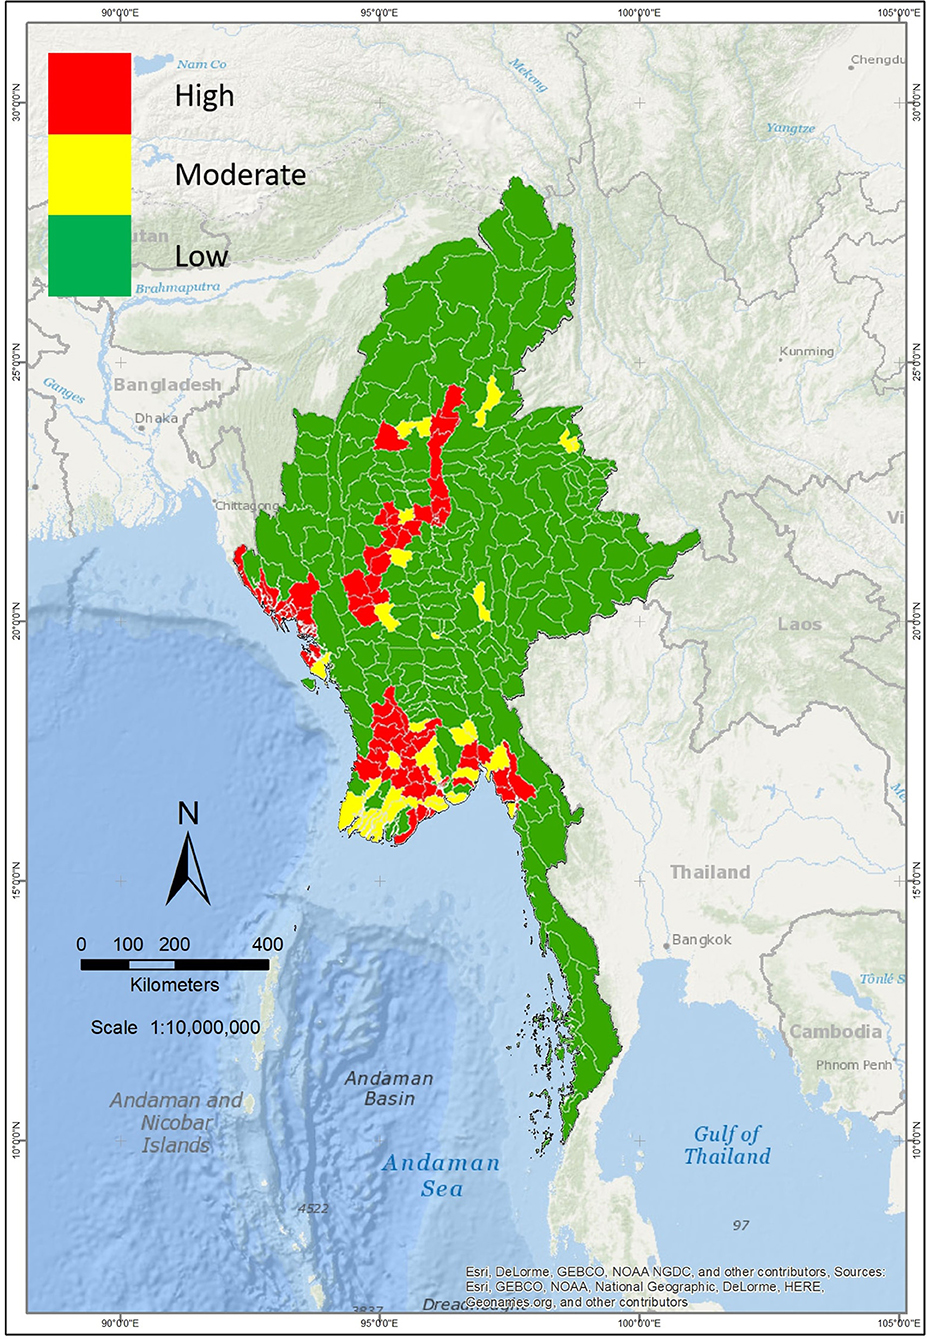
Figure 9. Flood risk index at a township level in Myanmar.
4. Discussion
There is very limited detailed knowledge on river basins and water dynamics in Myanmar (Taft and Evers, 2016). Although at a relatively coarse resolution, this study and the tool provides valuable information on water dynamics and potential human impacts on a district level. Applications of the tool were identified from various organizations and departments in Myanmar. They included the Department of Urban and Housing Development (DUHD) can use the flood frequency results as one of their consideration on selecting construction site locations to avoid frequently flooded areas. The Directorate of Water Resources and Improvement of River Systems (DWIR) may potentially use the flood hazard index to identify townships along rivers where the level of hazard is high to consider for constructing of the mitigation infrastructure. The Department of Meteorology and Hydrology (DMH) are interested to use flood frequency maps for selecting locations of new meteorological stations. The Department of Disaster Management (DDM) wants to use the flood hazard index to adjust the amount of the relief items for the stockpiling. The threshold value of flood hazard index is applicable only for Myanmar. Different countries may need to re-adjust the threshold with the expert consultation.
A limitation of this study it that we have not performed any validation of the data to quantify the uncertainty and errors. This could not be done as there very limited field data available from Myanmar. This was also identified by previous studies of for example Salmivaara et al. (2013), Varis et al. (2012), and Taft and Evers (2016). Remote sensing can fill an important data gaps, but has limitations. For example, Landsat has a revisit schedule of 16 days, and does not capture surface data in cloudy conditions. Hence, some historical flood events might not be captured, or the maximum extents of historical floods may be underrepresented. The MODIS archive could add valuable information to the system as it contains daily imagery for the period 2000–2018. With the recent availability of the European Space Agency (ESA) Copernicus Sentinel-1a/b satellites that acquire synthetic aperture radar (SAR) data, observations of flood extent during cloudy conditions will improve. The forthcoming NASA-ISRO SAR (NISAR) mission will acquire additional SAR data. Radarsat-1 archived data and ALOS PALSAR-1 data have also recently become available and could add to the flood record. Furthermore, including data fusion methods that incorporate multiple sensors (both optical and SAR data) can potentially increase temporal resolution across cloudy regions (Markert et al., 2018a), thus improving surface water observations which in turn can improve the flood frequency analysis.
In this work, we have developed a novel approach to distinguish surface water from floods. However, the JRC tool Pekel et al. (2016) does not separate water in paddy from other floods; therefore, a process to distinguish standing water in paddy field from floods that impact populations, infrastructure, and other land use types, would enhance the FHI. Additionally, the current FHI data derived from the JRC surface water data is only available from 1984 to 2015. Further improvements to this approach are planned including the update of the JRC tool to the present date for the Lower Mekong Region and beyond. Inputs to each of the indices were available at different spatial resolutions. The FHI relied on Landsat pixels at a 30m horizontal resolution. The FEI used 30 m land cover data and 100 m gridded population data. Inputs to the FVI were available at the township level, and the final FRI was produced at the township level.
The method to calculate FHI could consider other parameters that influence floods (e.g., rainfall intensity, elevation, land use, distance from drainage network). Other approaches could capture more sudden, fleeting flash floods that are unlikely to appear in the Landsat-based observations. Therefore, the final FRI produced in this study likely represents riverine and coastal floods, and not flash or finer scale urban floods.Future studies could integrate potential damage assessments as inferred from flood depth and duration as well (Oddo et al., 2018). While GIS allows for overlaying and combination of disparate data layers, it does not solve the decision-making processes involved in assigning weights or significance to quantitative and qualitative data. Roy (2018) discusses multi-criteria analysis (MCA) approach in applying geospatial indices toward reducing flood risk in India, the lessons of which could be applied to risk mapping and related decisions in Myanmar.
New cloud based geo-computational technologies make it easy to develop online tools that perform real time calculation. This enables end users with limited knowledge in the field of remote sensing and GIS to perform analysis which were beyond their reach before. This is particularly useful in the context of developing countries and disaster risk reduction. The end-user will be able to select and prioritize variables of the model and assign different weight to them. Results can be calculated and displayed in real time in a spatial explicit manner.
5. Conclusions
For the purposes of incorporating EO into planning and risk reduction, it is important to distinguish between flood and surface water, and our approach achieves this objective for the DDM in Myanmar. We have applied an index-based approach to reclassify historic flood frequency into a flood hazard index. We have also created geospatial exposure and vulnerability indices using socioeconomic and land use data. Combined, this resulted in a nationwide flood risk map, summarized at the township scale for Myanmar as depicted in Figure 9. Such knowledge aids in a more objective and complete understanding of historic flood patterns, which may inform annual budget decisions on the pre-allocation of flood relief supplies before each monsoon season. Further, this new characterization of overall flood risk by township pinpoints critical areas for additional disaster risk reduction investments.
Further refinement of the present work are planned in order to address the limitations outlined in section 3.1 above. This includes an update of the JRC dataset including data from additional sensors such as Sentinel-2, inclusion of other layers of locally available exposure and vulnerability data (including different types of social and socio-economic data) as are made available in the collaboration with DDM and other participating departments in Myanmar.
The risk map developed in this work and in collaboration with DDM is now being considered by other relevant departments including the Road Transportation Administration Department (RTAD) in Myanmar. With the feedback from end-user's, we expect to refine and build upon methods for improved decision support and planning for flood hazards.
Data Availability Statement
The datasets generated for this study are available on request to the corresponding author.
Author Contributions
KP, AP, BB, DS, and FC contributed to the conception and design of the study. KP organized the data collection. KP, AP, BB, and FC performed the statistical analysis. KP, AP, and FC wrote the first draft of the manuscript. All authors contributed to manuscript revision, read, and approved the submitted version.
Conflict of Interest
FC, AP, and DS are employed by Spatial Informatics Group, LLC.
The remaining authors declare that the research was conducted in the absence of any commercial or financial relationships that could be construed as a potential conflict of interest.
Acknowledgments
The authors would like to thank the support and feedback from Myanmar's Department of Disaster Management (DDM) on the tool and analysis. A special thanks is given to the Google Earth Engine team for their support and use of the platform. Support for this work was provided through the joint US Agency for International Development (USAID) and National Aeronautics and Space Administration (NASA) initiative SERVIR-Mekong, Cooperative Agreement Number: AID-486-A-14-00002. Individuals affiliated with the Earth System Science Center, University of Alabama in Huntsville (UAH) are funded through the NASA Applied Sciences Capacity Building Program, NASA Cooperative Agreement: NNM11AA01A.
References
Abuodha, P. A. O., and Woodroffe, C. D. (2006). Assessing Vulnerability of Coast to Climate Change: A Review of Approaches and Their Application to the Australian Coast. University of Wollongong, Faculty of Science Papers.
Adger, W. N., Huq, S., Brown, K., Conway, D., and Hulme, M. (2003). Adaptation to climate change in the developing world. Prog. Dev. Stud. 3, 179–195. doi: 10.1191/1464993403ps060oa
Alexander, D. (2002). Principles of Emergency Planning and Management. London: Oxford University Press.
Balica, S. F., Wright, N. G., and van der Meulen, F. (2012). A flood vulnerability index for coastal cities and its use in assessing climate change impacts. Nat. Hazards 64, 73–105. doi: 10.1007/s11069-012-0234-1
Borden, K. A., Schmidtlein, M. C., Emrich, C. T., Piegorsch, W. W., and Cutter, S. L. (2007). Vulnerability of US cities to environmental hazards. J. Homel. Secur. Emerg. Manage. 4, 1–21. doi: 10.2202/1547-7355.1279
Boruff, B. J., Emrich, C., and Cutter, S. L. (2005). Erosion hazard vulnerability of us coastal counties. J. Coastal Res. 21, 932–942. doi: 10.2112/04-0172.1
Cannon, T. (1994). Vulnerability analysis and the explanation of ‘natural’ disasters. Disast. Dev. Environ. 1, 13–30.
Carsell, K. M., Pingel, N. D., and Ford, D. T. (2004). Quantifying the benefit of a flood warning system. Nat. Hazards Rev. 5, 131–140. doi: 10.1061/(ASCE)1527-6988(2004)5:3(131)
Carter, W. N. (2008). Disaster Management: A Disaster Manager's Handbook. Manila: Asian Development Bank. Available online at: http://hdl.handle.net/11540/5035
Del Ninno, C., Dorosh, P. A., and Smith, L. C. (2003). Public policy, markets and household coping strategies in bangladesh: Avoiding a food security crisis following the 1998 floods. World Dev. 31, 1221–1238. doi: 10.1016/S0305-750X(03)00071-8
Douglas, I., Alam, K., Maghenda, M., Mcdonnell, Y., McLean, L., and Campbell, J. (2008). Unjust waters: climate change, flooding and the urban poor in africa. Environ. Urban. 20, 187–205. doi: 10.1177/0956247808089156
Farr, T. G., Rosen, P. A., Caro, E., Crippen, R., Duren, R., Hensley, S., et al. (2007). The shuttle radar topography mission. Rev. Geophys. 45, 1–13. doi: 10.1029/2005RG000183
Funk, C., Peterson, P., Landsfeld, M., Pedreros, D., Verdin, J., Shukla, S., et al. (2015). The climate hazards infrared precipitation with stations-a new environmental record for monitoring extremes. Sci. Data 2:150066. doi: 10.1038/sdata.2015.66
Gorelick, N., Hancher, M., Dixon, M., Ilyushchenko, S., Thau, D., and Moore, R. (2017). Google earth engine: planetary-scale geospatial analysis for everyone. Remote Sens. Environ. 202, 18–27. doi: 10.1016/j.rse.2017.06.031
Gornitz, V. (1991). Global coastal hazards from future sea level rise. Global Planet. Change 3, 379–398. doi: 10.1016/0921-8181(91)90118-G
Hedley, P. J., Bird, M. I., and Robinson, R. A. (2010). Evolution of the irrawaddy delta region since 1850. Geograph. J. 176, 138–149. doi: 10.1111/j.1475-4959.2009.00346.x
Jongman, B., Koks, E. E., Husby, T. G., and Ward, P. J. (2014). Increasing flood exposure in the Netherlands: implications for risk financing. Nat. Hazards Earth Syst. Sci. 14, 1245–1255. doi: 10.5194/nhess-14-1245-2014
Klis, H., Baan, P. J. A., and Asselman, N. E. M. (2005). Historische analyse van de gevolgen van overstromingen in Nederland: een globale schatting van de situatie rond 1950, 1975 en 2005. Q4005.
Levy, K., Woster, A. P., Goldstein, R. S., and Carlton, E. J. (2016). Untangling the impacts of climate change on waterborne diseases: a systematic review of relationships between diarrheal diseases and temperature, rainfall, flooding, and drought. Environ. Sci. Technol. 50, 4905–4922. doi: 10.1021/acs.est.5b06186
Luathep, P., Suwanno, P., and Taneerananon, P. (2013). “Identification of critical locations in road networks due to disasters,” in Proceedings of the Eastern Asia Society for Transportation Studies, Vol. 9 (Hat Yai), 206.
Markert, K., Chishtie, F., Anderson, E. R., Saah, D., and Griffin, R. E. (2018a). On the merging of optical and sar satellite imagery for surface water mapping applications. Results Phys. 9, 275–277. doi: 10.1016/j.rinp.2018.02.054
Markert, K., Schmidt, C., Griffin, R., Flores, A., Poortinga, A., Saah, D., et al. (2018b). Historical and operational monitoring of surface sediments in the lower mekong basin using landsat and google earth engine cloud computing. Remote Sens. 10:909. doi: 10.3390/rs10060909
Myanmar Information Management Unit (MIMU). Formal Sector School Location Upper Myanmar (2019). Available online at: http://geonode.themimu.info/ (accessed May 20, 2019).
Oddo, P. C., Ahamed, A., and Bolten, J. D. (2018). Socioeconomic impact evaluation for near real-time flood detection in the lower mekong river basin. Hydrology 5:23. doi: 10.3390/hydrology5020023
OpenStreetMap Contributors (2017). Planet Dump. Retrieved from: https://planet.osm.org
Pekel, J.-F., Cottam, A., Gorelick, N., and Belward, A. S. (2016). High-resolution mapping of global surface water and its long-term changes. Nature 540:418. doi: 10.1038/nature20584
Pelling, M., Maskrey, A., Ruiz, P., Hall, P., Peduzzi, P., Dao, Q. H., et al. (2004). Reducing Disaster Risk: A Challenge for Development. New York, NY: United Nations Development Programme, Bureau for Crisis Prevention and Recovery.
Plate, E. J. (2002). Flood risk and flood management. J. Hydrol. 267, 2–11. doi: 10.1016/S0022-1694(02)00135-X
Poortinga, A., Bastiaanssen, W., Simons, G., Saah, D., Senay, G., Fenn, M., et al. (2017). A self-calibrating runoff and streamflow remote sensing model for ungauged basins using open-access earth observation data. Remote Sens. 9:86. doi: 10.3390/rs9010086
Poortinga, A., Clinton, N., Saah, D., Cutter, P., Chishtie, F., Markert, K. N., et al. (2018). An operational before-after-control-impact (baci) designed platform for vegetation monitoring at planetary scale. Remote Sens. 10:760. doi: 10.3390/rs10050760
Poortinga, A., Tenneson, K., Shapiro, A., Nquyen, Q., San Aung, K., Chishtie, F., et al. (2019). Mapping plantations in Myanmar by fusing landsat-8, sentinel-2 and sentinel-1 data along with systematic error quantification. Remote Sens. 11:831. doi: 10.3390/rs11070831
Roy, P. S. (2018). Flood risk assessment using multi-criteria analysis: a case study from kopili river basin, assam, india. Geomat. Nat. Hazards Risk 9, 79–93. doi: 10.1080/19475705.2017.1408705
Saah, D., Johnson, G., Ashmall, B., Tondapu, G., Tenneson, K., Patterson, M., et al. (2019). Collect earth: an online tool for systematic reference data collection in land cover and use applications. Environ. Modell. Softw. 118, 166–171. doi: 10.1016/j.envsoft.2019.05.004
Saah, D., Tenneson, K., Poortinga, A., Nguyen, Q., Chishtie, F., Aung, K. S., et al. (2020). Primitives as building blocks for constructing land cover maps. Int. J. Appl. Earth Observ. Geoinform. 85:101979. doi: 10.1016/j.jag.2019.101979
Salmivaara, A., Kummu, M., Keskinen, M., and Varis, O. (2013). Using global datasets to create environmental profiles for data-poor regions: a case from the Irrawaddy and Salween River basins. Environ. Manage. 51, 897–911. doi: 10.1007/s00267-013-0016-x
Simons, G., Poortinga, A., Bastiaanssen, W. G., Saah, D., Troy, D., Hunink, J., et al. (2017). On Spatially Distributed Hydrological Ecosystem Services: Bridging the Quantitative Information Gap Using Remote Sensing and Hydrological Models. Wageningen: FutureWater.
Stevens, F. R., Gaughan, A. E., Linard, C., and Tatem, A. J. (2015). Disaggregating census data for population mapping using random forests with remotely-sensed and ancillary data. PLoS ONE 10:e0107042. doi: 10.1371/journal.pone.0107042
Strike, K. A. (2000). Schools as communities: four metaphors, three models, and a dilemma or two. J. Philos. Educ. 34, 617–642. doi: 10.1111/1467-9752.00198
Tadono, T., Nagai, H., Ishida, H., Oda, F., Naito, S., Minakawa, K., et al. (2016). “Generation of the 30 m-mesh global digital surface model by alos prism,” in International Archives of the Photogrammetry, Remote Sensing and Spatial Information Sciences (Prague), 41. doi: 10.5194/isprs-archives-XLI-B4-157-2016
Taft, L., and Evers, M. (2016). A review of current and possible future human–water dynamics in Myanmar's river basins. Hydrol. Earth Syst. Sci. 20, 4913–4928. doi: 10.5194/hess-20-4913-2016
Thieken, A. H., Kreibich, H., Müller, M., and Merz, B. (2007). Coping with floods: preparedness, response and recovery of flood-affected residents in germany in 2002. Hydrol. Sci. J. 52, 1016–1037. doi: 10.1623/hysj.52.5.1016
Tolentino, P. L. M., Poortinga, A., Kanamaru, H., Keesstra, S., Maroulis, J., David, C. P. C., et al. (2016). Projected impact of climate change on hydrological regimes in the philippines. PLoS ONE 11:e0163941. doi: 10.1371/journal.pone.0163941
UNISDR (2011). Global Assessment Report on Disaster Risk Reduction: Revealing Risk, Redefining Development.
Van Liere, W. J. (1980). Traditional water management in the lower mekong basin. World Archaeol. 11, 265–280. doi: 10.1080/00438243.1980.9979766
Varis, O., Kummu, M., and Salmivaara, A. (2012). Ten major rivers in monsoon Asia-Pacific: an assessment of vulnerability. Appl. Geogr. 32, 441–454. doi: 10.1016/j.apgeog.2011.05.003
Verkade, J., and Werner, M. (2011). Estimating the benefits of single value and probability forecasting for flood warning. Hydrol. Earth Syst. Sci. 15, 3751–3765. doi: 10.5194/hess-15-3751-2011
Wannous, C., and Velasquez, G. (2017). “United Nations Office for Disaster Risk Reduction (UNISDR)-UNISDR's Contribution to Science and Technology for Disaster Risk Reduction and the Role of the International Consortium on Landslides (ICL),” in WLF 2017:Advancing Culture of Living with Landslides, eds K. Sassa, M. Mikoš, and Y. Yin (Cham: Springer), 99–115. doi: 10.1007/978-3-319-59469-9_6
Keywords: flood frequency, remote sensing, water management, Google Earth Engine, disaster preparedness, Myanmar, disaster management, earth observations
Citation: Phongsapan K, Chishtie F, Poortinga A, Bhandari B, Meechaiya C, Kunlamai T, Aung KS, Saah D, Anderson E, Markert K, Markert A and Towashiraporn P (2019) Operational Flood Risk Index Mapping for Disaster Risk Reduction Using Earth Observations and Cloud Computing Technologies: A Case Study on Myanmar. Front. Environ. Sci. 7:191. doi: 10.3389/fenvs.2019.00191
Received: 19 July 2019; Accepted: 20 November 2019;
Published: 11 December 2019.
Edited by:
Niall Patrick Hanan, New Mexico State University, United StatesReviewed by:
Nidhi Nagabhatla, United Nations University Institute for Water Environment and Health, CanadaSharad Kumar Jain, National Institute of Hydrology, India
Copyright © 2019 Phongsapan, Chishtie, Poortinga, Bhandari, Meechaiya, Kunlamai, Aung, Saah, Anderson, Markert, Markert and Towashiraporn. This is an open-access article distributed under the terms of the Creative Commons Attribution License (CC BY). The use, distribution or reproduction in other forums is permitted, provided the original author(s) and the copyright owner(s) are credited and that the original publication in this journal is cited, in accordance with accepted academic practice. No use, distribution or reproduction is permitted which does not comply with these terms.
*Correspondence: Farrukh Chishtie, farrukh.chishtie@adpc.net