


Abstract
Observations from the Interstellar Boundary Explorer (IBEX) of energetic neutral atoms (ENAs) reveal two populations, those emitted from a narrow (∼20°–40°) ribbon that is centered on the local interstellar magnetic field, and a globally distributed flux (GDF) that is controlled by processes in the heliosheath. This is a third study utilizing a previously developed technique to separate ENA emissions in the ribbon from the GDF. In the first ribbon separation study, we analyzed the first year of IBEX data at the energies of 0.7 keV and above; the second study analyzed data down to 0.2 keV using the first five years of IBEX data. Here, we utilize the separation analysis from 0.7 keV and above to study time evolution in 3 year intervals over the first nine years of IBEX data. This study is the first to reveal the global time evolution of the GDF distinct from that of the IBEX ribbon. We show that the time evolution of the GDF within 40° of the upwind pressure maximum is driven by changes in the solar wind ram pressure through compression and rarefaction in the heliosheath. In contrast, the GDF is relatively stable in the region centered on the heliotail downwind with respect to the interstellar flow. The evolution of the IBEX ribbon is observed to have a time lag with respect to the upwind GDF evolution, likely due to the secondary (neutral) solar wind source. The time lag observed in the ribbon evolution is consistent with the generation of ions retained for several years beyond the heliopause. These observations lend further support to secondary solar wind models of the IBEX ribbon, but also require that there is a significant several year time lag for reneutralization of ions that form the IBEX ribbon. We use this study of the 9 year separation of the IBEX ribbon from the globally distributed flux to prepare for a formal IBEX data release of ribbon and globally distributed flux maps to the heliophysics community.
Export citation and abstract BibTeX RIS
1. Introduction
The objective of the Interstellar Boundary Explorer (IBEX) mission (McComas et al. 2009b) is to study the global interaction between the solar wind and the local interstellar medium (LISM). IBEX carries two sensors, IBEX-Lo (Fuselier et al. 2009b) and IBEX-Hi (Funsten et al. 2009a), that measure energetic neutral atoms (ENAs) with energy ranges of ∼10 eV to 2 keV and ∼300 eV to 6 keV, respectively (McComas et al. 2009b, 2009a). The global ENA maps from IBEX (Funsten et al. 2009b; Fuselier et al. 2009a; McComas et al. 2009a; Schwadron et al. 2009) characterize the heated solar wind plasma within the heliosheath, beyond the termination shock, in addition to elevated ENA emissions along a narrow ribbon (∼20°–40° wide) that forms a circular arc roughly centered on ecliptic coordinates (long., lat.) ∼(219 2 ± 13, 399 ± 23; Funsten et al. 2013).
Increasingly sophisticated analyses indicate that the ribbon is centered near the direction of the LISM magnetic field (McComas et al. 2009a; Schwadron et al. 2009; Grygorczuk et al. 2011; Pogorelov et al. 2011; Ratkiewicz et al. 2012; Zirnstein et al. 2016). The IBEX ribbon center lies within the "B–V plane" (Lallement et al. 2005; Kubiak et al. 2016), a plane of symmetry that contains the LISM flow vector direction and the LISM magnetic field direction. The observational definition of the B–V plane was first derived from the difference between the velocities of interstellar H (Wood et al. 2007; Lallement et al. 2010) and interstellar He (Witte et al. 2004; Lallement et al. 2005; Bzowski et al. 2015; Leonard et al. 2015; McComas et al. 2015; Möbius et al. 2015; Schwadron et al. 2015b) measured within the heliosphere. The flow direction of interstellar H is strongly deflected along the B–V plane due to charge-exchange collisions within the outer heliosheath. In contrast, interstellar He undergoes very little charge-exchange in the outer heliosheath. The difference between the H and He velocity vectors is extrapolated to define the B–V plane. An increasing number of interstellar populations, including secondary He (Kubiak et al. 2016) and primary interstellar O (Schwadron et al. 2016), line up along the B–V plane, and are used to refine its definition.
Schwadron et al. (2015c) found that Voyager 1's observations of the local interstellar magnetic field direction are more than 40° off from the B–V plane. However, the interstellar magnetic field direction measured by Voyager 1 shows significant variations over time. During a particularly quiet period from year 2013.3 to mid 2014.6, the temporal gradient of the field direction measured by Voyager 1 can be extrapolated to a field direction that passes directly through the IBEX ribbon center (0.7–2.7 keV) and the B–V plane.
Grygorczuk et al. (2014) showed that the deflection of Voyager 1's observed magnetic field directions from the ribbon center was consistent with the draping of the interstellar magnetic field (at the ribbon center) around the heliopause. Furthermore, pressure variations driven by the solar wind are observed to propagate into the heliosheath, causing time-dependent changes in the direction of the interstellar magnetic field observed by Voyager 1 (Schwadron & McComas 2017).
Interstellar observations over large scales (∼50 pc) indicate that the magnetic field within the interstellar medium is roughly consistent with the direction of the ribbon center. The ribbon center direction is within ∼33° ± 20° of the magnetic field direction derived from interstellar polarization data using stars within 40 pc (Frisch et al. 2012; Frisch & Schwadron 2013; Frisch et al. 2015). Global anisotropies of TeV cosmic rays are consistent with streaming along the magnetic field directed toward the ribbon center (Schwadron et al. 2014, 2015a). This observation indicates a field direction within the interstellar medium that is roughly consistent with the ribbon center over ∼50 pc.
There is a remarkably broad array of proposed sources of the ribbon (McComas et al. 2009a, 2014), ranging in location from inside the termination shock to beyond the heliosphere. As one example, Siewert et al. (2012) considered ENA signatures from the inner heliosheath associated with shock-processed downstream pickup ions. A broad, ring-like high-emission pattern was obtained. Several observations, detailed below, qualitatively agree with the models associated with one class of solutions involving the neutral solar wind, which propagates out beyond the heliopause, becomes ionized and forms a suprathermal population within the outer heliosheath and LISM. This is often referred to as the "secondary solar wind source" for the ribbon, which was one of the sources originally postulated by McComas et al. (2009a), and subsequently modeled in numerous studies (Chalov et al. 2010; Heerikhuisen et al. 2010; Möbius et al. 2013; Zirnstein et al. 2016, 2018). Table 1 from Zirnstein et al. (2015) lists observations of the ribbon, different ribbon models, and how these signatures correspond to features associated with various ribbon models.
Originally, the secondary wind model for the ribbon was conceptualized as a ring-like distribution formed from the solar wind neutrals that move out roughly perpendicular to the LISM magnetic field. Once ionized, the ions begin to gyrate about the magnetic field, and when re-neutralized, some of these ring-beam-like particles move back toward IBEX, where they can be observed. The difficulty with this scenario is that reneutralization takes several years, and the mechanism requires the stability of a ring-like distribution over this long period of time. Simulations indicate that such distributions are unstable and should decay rapidly (Florinski et al. 2010; Liu et al. 2012; Niemiec et al. 2016; Min et al. 2017) over periods much less than the multiple-year period needed for stability. However, there is an array of studies in which it is concluded that there are circumstances in which a ring-like distribution that forms the ribbon can remain stable over years (Gamayunov et al. 2010; Summerlin et al. 2014; Florinski et al. 2016).
A different variant of the secondary solar wind models for the ribbon has also been suggested. Schwadron & McComas (2013) and Isenberg (2014) argued that the ribbon is formed within a spatial region, the "retention region," in directions roughly perpendicular to the LISM magnetic field where newly ionized atoms are temporarily contained through increased rates of scattering by locally generated waves in the electromagnetic fields. In a similar vein, Giacalone & Jokipii (2015) found that the pre-existing turbulent LISM magnetic field has sufficient amplitude in magnitude fluctuations to efficiently trap ions with initial pitch angles near 90°, primarily by magnetic mirroring, leading to a narrow region of enhanced pickup-proton intensity. The model also suggests that the ribbon may be double-peaked with a central depression.
Several lines of observational evidence support a secondary solar wind source for the ribbon (Zirnstein et al. 2015). First, the ribbon emissions are typically latitude-dependent, with higher-energy emissions coming from high latitudes where faster solar wind emanates from polar coronal holes (Schwadron et al. 2011; McComas et al. 2012). Swaczyna et al. (2016b) showed that this connection with the solar wind latitudinal structure can also explain the systematic variation of the ribbon's center in the energy range observed by IBEX-Hi (Funsten et al. 2013). Second, Swaczyna et al. (2016a) determined the ribbon's parallax that corresponds to an average radial distance to the ribbon emissions of  au, which favors models of the ribbon with the source located just outside the heliopause.
Figure 1 shows a comparison between the two major variants of secondary solar wind models and observations. In column (a) of Figure 1, we show the results of the spatial retention model (Schwadron & McComas 2013) in which ions created from neutral solar wind beyond the heliopause are scattered strongly, and aggregated near directions in which  . The rows in the figure show models and observations at IBEX energy bins from 0.71 to 4.29 keV. Column (b) shows the latest results of the ring-beam model that accounts for the guiding center motion of ions in the draped interstellar magnetic field outside of the heliopause (Zirnstein et al. 2018). Column (c) shows IBEX observations of the ribbon, which has been separated from the globally distributed flux using the first 5 years of IBEX observations (Schwadron et al. 2014).

Figure 1. Differential ENA fluxes modeled and observed by IBEX. The rows in the figure show models and observations at IBEX energy bins from 0.71 to 4.29 keV. Column (a) shows the results of the spatial retention model (Schwadron & McComas 2013) in which ions created from neutral solar wind beyond the heliopause are scattered most strongly, retained, and aggregated near the regions where the near-radial outflow of the neutral solar wind is orthogonal to the local interstellar magnetic field. Column (b) shows the latest results of the ring-beam model (Zirnstein et al. 2018). Column (c) shows the IBEX observations of the ribbon, which has been separated from the globally distributed flux using the first 5 years of IBEX observations (Schwadron et al. 2014).
Download figure:
Standard image High-resolution imageIn Figure 1, we observe in both models a pattern with the brightest emissions from lower latitudes at low energies. These are the signatures of low-speed solar wind. Typical low-speed solar wind (∼350–450 km s−1 with energies 0.64–1.1 keV) appears in the IBEX-Hi energy passbands centered on 0.71 and 1.11 keV. High-speed solar wind (∼600–750 km s−1 with energies 1.9–2.9 keV) appears in passbands centered on 1.74 keV and 2.73 keV. The highest speed solar wind (typically extending up to 850 km s−1 or up to 3.8 keV) from polar coronal holes appears in the highest-energy passband of IBEX-Hi centered on 4.29 keV. We note that the largest variations between the two variants of secondary models appear at energy passbands centered on 0.71 keV and sensitive to the lowest speeds of secondary solar wind, and at 4.29 keV centered on the highest speeds of solar wind. Both models make use of detailed empirical fits to the latitude solar wind distribution (Sokół et al. 2012, 2015) using Ulysses data, the OMNI 2 database, and remote sensing observations of interplanetary scintillations. Both models also take into account transit-time delays between observations of the solar wind in the heliosphere and the IBEX observations of the solar wind of the ribbon. However, these transit-time delays are inherently uncertain due to the model dependence concerning the spatial source of the ribbon.
At the IBEX-Hi energy band centered on 4.29 keV, we observe a characteristic change in ribbon emissions. The emission region appears much broader than it does at lower energy passbands. Furthermore, both the spatial retention model (Schwadron & McComas 2013) and ring-beam model (Zirnstein et al. 2018) show significant departures from the observations. We note in particular the broad low-latitude emission southward of the nose, which does not appear in either model. It is possible that this emission region comes not from secondary solar wind, but instead from neutral atoms generated through charge-exchange with pickup and suprathermal protons in the inner heliosheath (Siewert et al. 2012).
ENA emissions from a secondary suprathermal source extend above 5 keV, since suprathermal protons have energies up to many tens of keV. Observations by Cassini/INCA at energies of 5.2–55 keV show the existence of a "belt" (Krimigis et al. 2009), a high-intensity broad band of ENA emission across the sky. The belt is a relatively stable feature as a function of observed Cassini/INCA energies (Dialynas et al. 2013, 2017). While secondary suprathermal atoms likely contribute to the sources of ENAs above 5 keV, it is not understood currently whether there is a physical relationship between the IBEX ribbon and the belt.
The ribbon flux adds to the comparatively broad GDF emissions from the inner heliosheath. Schwadron et al. (2011) were the first to develop and apply a sophisticated technique for separating the ribbon flux from the GDF using the first year of IBEX data. Schwadron et al. (2014) provided a second study that applied the ribbon separation techniques to the first five years of IBEX data from 0.2 to 4.29 keV, enabling the first maps of the ribbon and the GDF across the full sky of ENA emissions.
One of the key results derived from the 5 year ribbon separation analysis (Schwadron et al. 2014) is an all-sky map of line-of-sight integrated pressure. These maps show a broad suprathermal pressure build-up centered near the nose, but deflected ∼20° south of the interstellar upwind direction. The southward deflection in the pressure maximum is consistent with the effects of the interstellar magnetic field's asymmetric draping around the heliopause nose. Given an interstellar magnetic field direction near the ribbon center, the pressure exerted by the interstellar magnetic field through the heliopause also has a maximum shifted southward from the upwind direction. The observed southward shift pressure maximum in ENAs is also consistent with the expected maximum pressure in the outer heliosheath's nearly sub-Alfvénic flow (Fuselier & Cairns 2013). The southern shift of the LOS-integrated ENA pressure confirms that the pressure from suprathermal ions observed by IBEX plays a fundamental role in the pressure balance maintained throughout the heliosheath.
The suprathermal pressure of plasma in the inner heliosheath generates pressure gradients that can deflect plasma flow. The direction of the gradient away from the pressure maximum observed by IBEX explains the rotation of plasma flows observed by Voyager 2 (McComas & Schwadron 2014). These Voyager 2 observations show flow rotations that are far more in the transverse direction and less in the polar direction than predicted based on a pressure maximum in the upwind direction. The fact that the suprathermal pressure maximum is southward of the upwind direction creates pressure gradients that strengthen transverse deflections in the plasma flow at the position of Voyager 2.
In this paper, we use a technique previously developed by Schwadron et al. (2011) to separate the GDF from the ribbon and discuss the properties of the two ENA populations. We apply the ribbon separation analysis in discrete 3 year intervals over a 9 year period, and, for the first time, explore the time dependence of the ribbon separated from the GDF. We focus on data from IBEX-Hi and ENA center energies from 0.7 to 4.29 keV because we investigate the time dependence of the ribbon and GDF. There is insufficient signal in IBEX-Lo to investigate the time variations on 3 year intervals. Furthermore, while the energies below 0.7 keV have been found to carry significant suprathermal pressure (Schwadron et al. 2014; Galli et al. 2017), the suprathermal pressure for energies above 0.7 keV appears to be a good proxy for the combined pressure (Schwadron et al. 2014).
The paper is organized as follows. Section 2 reviews the ribbon separation technique and discusses the results of the ribbon separation analysis applied over 9 years of IBEX data. Section 3 discusses the source of time variations in the inner heliosheath and the ribbon. Section 4 summarizes our conclusions.
2. Separation of the Ribbon from Globally Distributed Flux
We begin the ribbon separation analysis with a set of global ENA maps from the first nine years of IBEX data (McComas et al. 2018). We utilized only ENA data taken while viewing in the ram direction. Here, the ram direction is aligned with Earth's direction of motion about the Sun. These "ram maps" are Compton-Getting (CG) corrected to estimate fluxes at constant energies in the inertial reference frame of the Sun. As detailed by Schwadron et al. (2014), the CG correction of ram maps suppresses background, whereas the CG correction of "wake maps" (with viewing opposed to the ram direction) amplifies background. The result is that the CG-corrected ram maps used in this study have lower background contributions, resulting in a more accurate separation between the ribbon and the GDF. Survival probabilities are also applied so that fluxes are estimated at ∼100 au from the Sun. Pixels with a low signal-to-noise ratio (S/N, defined as the inverse of the fractional uncertainty), S/N < 3, are not used. In this paper, we only use maps where viewing is complete or almost complete across the entire sky, as is the case for IBEX-Hi maps from 0.7 through 4.29 keV. IBEX-Lo ram maps typically exclude about half of the sky centered on the tail, because during these periods the IBEX spacecraft is within the magnetosphere and IBEX-Lo experiences large backgrounds.
The ribbon separation technique (Schwadron et al. 2011) fits the ribbon in a frame with the polar axis at the ribbon center. The ribbon fits are used to create a transparency mask over the ribbon. We then solve for the distributed flux using an interpolation scheme. The ribbon separation technique is applied at each energy step independently, and results are weakly dependent on the choice of the polar axis at the ribbon center. We use a polar axis at ecliptic longitude, latitude (221°, 39°) within 2° of the observed ribbon center (Funsten et al. 2013). The ribbon separation methodology is detailed by Schwadron et al. (2011).
As in previous ribbon separation studies, we have calculated the plasma proton pressure times the line of sight (LOS):  . The quantity P × LOS applies to the protons over the region in which ENAs are formed, and the P characterizes the plasma pressure within the heliosheath and within the ribbon. The quantity is related to the differential flux of ENAs jENA through the following relation:
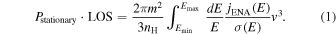
Here, m is the proton mass, nH = 0.1 cm−3 is the estimated neutral hydrogen density, E = mv2/2 is the energy of plasma protons in the frame of the Sun, v is the proton speed in the stationary frame of the Sun, and σ(E) is the charge-exchange cross section (Lindsay & Stebbings 2005). The integration limits are from Emin = 0. 5 keV to Emax = 6 keV. The pressure is characterized as the "stationary" pressure because we make the approximation that the plasma is stationary in the frame of the Sun. Furthermore, because we are averaging over relatively long times (3 years), we neglect the propagation time offsets between different measured energy channels.
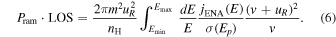
The pressure associated with the plasma moving at radial speed uR is

where


are the internal plasma pressure and ram pressure. The limits of integration extend over the portion of the plasma proton distribution function (fp) for which we have direct observational information from ENAs. The distribution function of ENAs is  , and σ(Ep) is the charge-exchange cross section at energy
  . Here, the subscript p indicates the plasma frame. The velocity of a particle in the plasma frame,
  , is related to the velocity in the inertial (or stationary) rest frame,
  , through the following relation,
  . The quantity
  is the plasma bulk flow, which is approximated as radial
  , where the unit radial vector is
  . The particle velocity is directed radially inward toward the observer so that
  . This relation allows us to solve for the limits of integration:
  and
and  , where
  and
and  . The observed differential flux,
  . Incorporating these transformations, we express the internal and ram pressure as follows:
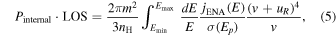
Equation (5) determines the correction factor that multiplies the observed LOS-integrated stationary pressure to determine the internal LOS-integrated pressure. The correction factor depends on the spectral slope α, where  . As a specific example, we consider the region near the nose where the spectral slope is typically
  . Using a downstream flow speed of 100 km s−1 in the heliosheath (Schwadron & McComas 2017; Schwadron & Bzowski 2018), we find that the ratio of the internal to stationary pressure is
  . Given the results of the ribbon separation study of Schwadron et al. (2014), the line-of-sight integrated pressure near the nose in the GDF was found to be
  pdyne-au/cm2, yielding a line-of-sight integrated internal pressure downstream of shock given by
  pdyne-au/cm2.
We can estimate the internal pressure downstream from the termination shock using a mass loading model, as detailed by Schwadron et al. (2014). Here, we consider a solar wind with a speed near 1 au of 400 km s−1 and a proton flux of  cm−2 s−1. We take the termination shock radial location of ∼85 au. This yields a downstream internal pressure given by Pinternal ∼ 1.75 pdyne cm−2. Given the internal pressure derived from ENAs, Pinternal · LOS ∼ 70 pdyne-au/cm2, this suggests an LOS of 40 au and a heliopause at 125 au.
The calculation depends fundamentally on the location of the termination shock. As discussed by Schwadron et al. (2014), the internal pressure must balance the pressures outside the heliopause imparted by the interstellar magnetic field, and the local interstellar flow. Here, we do not use the derived pressures from ENA maps for detailed pressure balanced calculations, as was done previously (Schwadron et al. 2014). The example shows how the ENA LOS-integrated pressure maps are used to derive the properties of the global heliosphere.
We apply the ribbon separation technique for overlapping three year intervals from the beginning of the IBEX mission in 2009. The first ribbon separation maps are analyzed over the period starting near the beginning of 2009 through the end of 2011, the second period 2010–2012, and so on, with the last of the seven periods extending 2015–2017.
Figure 2 shows the LOS-integrated proton plasma pressure in each of the observing periods, with the left column representing the total integrated pressure, the middle column representing the integrated pressure from the GDF, and the right column from the ribbon alone. Figure 3 shows the corresponding S/N for each of the integrated pressure maps. The maps are all shown centered on the nose, or the upwind direction of the heliosphere. Figure 4 shows the same total LOS-integrated pressure, GDF, and ribbon as in Figure 2; however, the projection is now shown centered on the tail, or in the downwind direction of the heliosphere.

Figure 2. The total LOS-integrated pressure (pdyne-au-cm−2) in the left column, the GDF in the middle column, and the ribbon in the right column. The ribbon separation is performed over 3 year intervals beginning in 2009–2011 and running through the last interval in 2015–2017.
Download figure:
Standard image High-resolution image
Figure 3. S/N for the ribbon separated maps of pressure times LOS shown in Figure 2.
Download figure:
Standard image High-resolution image
Figure 4. Maps of the LOS-integrated pressure (pdyne-au-cm−2) with the projections centered on the tail, or downwind direction. As in Figure 2, the total LOS-integrated pressure is shown in the left column, the GDF is shown in the middle column, and the ribbon is shown in the right column.
Download figure:
Standard image High-resolution imageWe note that there are regions on the map with low counting statistics and low S/N. In particular, in regions near −130° longitude in 2012–2014, 2013–2015, and 2014–2016, we observe low fluxes due to low exposure times and the resulting low counting statistics.
We determine the spectral slope, α, of the GDF using a χ2 fit of the differential flux J ∝ Eα as a function of energy E in each map pixel. The fit for the spectral slope is performed using a least squares minimization (Schwadron et al. 2011). The approximation of the differential flux with a single spectral slope is shown as a reasonable approximation over most of the map. We often observe broken ENA energy spectra (Dayeh et al. 2012), particularly near the poles. The spectral slope maps are shown in Figure 5 (middle column) along with the LOS-integrated pressure (left column) and the spectral slope S/N ratio (right column). The projection in Figure 5 is centered on the nose, or upwind direction. In Figure 6, the projection is centered on the tail, or downwind direction.

Figure 5. The GDF spectral slope (middle column) plotted along with the LOS-integrated pressure (left column) and the spectral slope signal-to-noise ratio (right column). In each map pixel, the differential flux, J, of the GDF is fit, using a minimization of the χ-square, to the functional form J ∝ Eα, where α is the spectral slope and the energy is E. The projection of the map is centered on the nose, or upwind direction.
Download figure:
Standard image High-resolution image
Figure 6. Same quantities as Figure 5, but with the projection of the map centered on the tail, or downwind direction. The GDF spectral slope (middle column) is plotted along with the LOS-integrated pressure (left column) and the spectral slope S/N (right column).
Download figure:
Standard image High-resolution image3. Discussion
In this section, we consider how the inner heliosheath and the ribbon respond to changes within the solar wind. In the first Section 3.1, we discuss the cooling time within the inner heliosheath. This cooling time is based on the formalism discussed by Schwadron & Bzowski (2018). In Section 3.2, we discuss the timing of observed changes in the GDF in the upwind direction and the comparative stability downwind, and in Section 3.3 we discuss the observed changes in the IBEX ribbon.
3.1. The Cooling Time within the Inner Heliosheath
There are a number of effects that must be taken into account when estimating the cooling or heating of plasma within the heliosheath (Schwadron & Bzowski 2018). A complete definition of the plasma cooling rate in the heliosheath takes into account cooling from plasma expansion (or heating from plasma compression) and charge-exchange. This leads to the following expression for the cooling rate:

where

is the cooling rate from flow divergence and

is the cooling rate from charge-exchange. Here, the bulk flow speed of the plasma is  and the spectral slope of the distribution function is γ, so that f0 ∝ p−γ, where p is particle momentum. Note that γ = 2–2α, where α is the spectral slope associated with the differential flux as a function of energy.
Plasma expansion is associated with a positive flow divergence,  , a positive cooling rate, and a reduction in the distribution function over time associated with the cooling process. Plasma compression is associated with a negative flow divergence,
  , and plasma heating. In this case,
  is negative, while the charge-exchange rate
  associated with cooling is positive. If the compression heats the plasma at a rate that exceeds the charge-exchange rate, then the heating rate (τheat = −τcool) becomes positive, which causes net acceleration of the suprathermal or energetic proton populations and therefore an increase in the distribution function over time.
As in Schwadron & Bzowski (2018), we use observations from Voyager 2 (V2) to determine the cooling rate (or heating rate). V2 crossed the termination shock on the last day of August 2007 at 83.7 au from the Sun (Burlaga et al. 2008; Richardson et al. 2008; Stone et al. 2008). As detailed by Schwadron & Bzowski (2018), the density V2 observed is used to determine the bulk flow divergence based on conservation of mass:

where the convective derivative is  . The changes in mass density,
  , are estimated in the frame of reference of V2.
A key result from Schwadron & Bzowski (2018) is that V2's density correlates with solar wind plasma observations at 1 au of ram pressure and magnetic field strength when correcting for the ∼1 year for plasma to travel from 1 au to the position of V2 in the inner heliosheath. Generally, when the ram pressure in the solar wind increases steadily over yearly timescales, we observe density increases at V2 with a 1 year time lag. In other words, increasing ram pressure causes plasma compression within the heliosheath, while decreasing ram pressure leads to plasma expansion. The density changes in the heliosheath also correlate over some time periods with solar activity when corrected for solar wind transit time into the heliosheath. From 2009–2012, increases in solar activity led to increases in the solar wind ram pressure, which in turn drove compression in the heliosheath. In contrast, from 2007–2009, decreases in solar activity lead to decreases in solar wind ram pressure, and expansion in the heliosheath.
The total cooling rate (Figure 7, bottom panel) from Equation (7) is the sum of the rate due to the charge-exchange rate (shown in the middle panel at 1 and 4 keV) and the plasma divergence term  (black dots in middle panel). We use the 1 year averaged density to form the plasma divergence used in the cooling scale. The ratio τcx/τflow is also shown (top panel). Periods when the flow divergence rate is larger than the charge-exchange rate, τcx/τflow > 1, are shown in the top panel by the blue shaded regions. We have taken γ = 6 as a representative value; this corresponds to α = −2 for the spectral slope.

Figure 7. We show the total cooling rate (bottom panel), which is the sum of the rate due to the charge-exchange rate  and the rate due to plasma divergence
  . These rates are shown separately in the middle panel. The top panel shows the ratio of these rates
  and the blue shaded region regions indicates periods in which the flow divergence rate exceeds the charge-exchange rate,
  .
.
Download figure:
Standard image High-resolution imageThe cooling timescale τcool is shown in Figure 8, on the right vertical scales (middle panel). The cooling scale-length shown on the left vertical scale is defined λcool = uτcool. The cooling timescale is typically positive due to charge-exchange and plasma expansion in the heliosheath. In contrast, plasma compression leads to heating of the energetic particle distributions. As such, the heating timescale and length-scale are opposite of the cooling timescale and length-scale τheat = −τcool and λheat = −λcool.

Figure 8. We show the cooling scale-length (middle panel) and cooling timescale (middle panel, right vertical scale) derived from the cooling rate (Figure 7). We show the heating scale-length and timescale in the top panel. Periods of cooling within the heliosheath are driven by plasma expansion, whereas heating is driven by compression. In the bottom panel, we show the sunspot number, which characterizes solar activity. The timeshift in the bottom panel takes into account the propagation of solar wind into the heliosheath.
Download figure:
Standard image High-resolution imageIn understanding and interpreting the changes observed in ENA maps, we highlight several key points. Reductions in the ram pressure within the solar wind lead to expansion in the heliosheath. In Figure 8, we observe cooling timescales of ∼1–2 years during periods of plasma expansion. Similarly, during periods of strong plasma compression driven by increases in ram pressure, we observe ∼1–2 year timescales for plasma heating. Although these results are derived from V2, which represents a single-point sample of the heliosheath, these observations suggest how the heliosheath responds to large-scale changes within the solar wind. In the next section, we associate the timing of changes in the GDF with changes in the solar wind.
3.2. Time-dependent Changes Upwind and Stability Downwind in the GDF
In the previous subsection we showed that the changes in the heliosheath near the nose are driven by changes in the ram pressure of the solar wind. Within this discussion, it is important to note that the highest pressure regions of the heliosphere are not directly in the upwind direction. As detailed by McComas & Schwadron (2014), the highest pressure regions near the nose are in fact shifted about ∼20° south of the nose due to the asymmetric pressure induced by the LISM magnetic field as it is deflected and bent around the heliosphere. In the nose-centered GDF maps shown in Figure 1, we observe the increased pressure region of the heliosphere consistently shifted south of the nose.
In analyzing the timing of changes within the pressure maps studied by IBEX, we must account for an array of transit-time effects. We approach the problem by developing an approximation for the minimum and maximum transit time. The minimum 1.5 year transit time takes into account: (1) the ∼1 year transit of an average speed 420 km s−1 solar wind to the termination shock at 90 au, and (2) the 0.5 year transit of a 4.29 keV ENA from 90 au to 1 au. The maximum 4.9 year transit time takes into account: (1) the ∼1 year transit of an average speed 420 km s−1 solar wind to the termination shock at 90 au, (2) the 0.6 year transit of a solar wind disturbance 40 au through the heliosheath, which assumes a vw + u = 300 km s−1 propagation speed from the sum of a u = 100 km s−1 bulk plasma speed and a vw = 200 km s−1 sound speed (Schwadron & McComas 2017; Schwadron & Bzowski 2018), (3) a 1.9 year transit of the disturbance back through the 40 au heliosheath from the heliopause to the termination at an inward propagation speed vw − u = 100 km s−1, and (4) 1.2 year transit time of a 0.7 keV ENA from 90 au back to 1 au. The minimum and maximum transit time are combined with the start times and end times of map observations to estimate the period over which the heliosheath near the pressure maximum responds to solar wind changes observed at 1 au. For example, the first LOS-integrated pressure map reported in Figure 2 had an observed start time of 2009.0 and an end time of 2012.0. Given the minimum transit time of 1.5 years and a maximum transit time of 4.7 years, we find that the heliosheath observed in the LOS-integrated pressure map responds to solar wind observed at 1 au over the period from 2004.3 (mapping start time 2009.0 minus maximum 4.7 year transit time) to 2010.5 (mapping end time 2012.0 minus minimum 1.5 year transit time).
In Figure 9, we compare V2's plasma density (a) with observations of the solar wind (b)–(c) made at 1 au to provide insight into the plasma conditions within the heliosheath during the period in which GDF LOS-integrated pressure maps (f) were affected by solar wind observed at 1 au. Panels (a)–(e) of Figure 9 were originally shown by Schwadron & Bzowski (2018), but over a longer time range including periods extending before 2008, which strongly affect the GDF LOS-integrated maps (f).

Figure 9. Transit-time corrections applied to the LOS-integrated pressure maps observed by IBEX over 9 years of data. Shown here are the V2 plasma density (a), the solar wind ram pressure (b), and magnetic field strength at 1 au (c) near Earth from OMNI data (King & Papitashvili 2005). The colored horizontal lines (b) correspond to the time periods over which solar wind conditions observed at 1 au affect conditions in the inner heliosheath observed in corresponding LOS-integrated pressure maps. The large colored dots in panel b show the average ram pressures over the periods indicated by the colored horizontal lines. Also shown are dose rates (d) of solar energetic particles and cosmic rays from the Cosmic Ray Telescope for the Effects of Radiation (CRaTER, Spence et al. 2010; Schwadron et al. 2012) on LRO and solar sunspot numbers (e) (Svalgaard & Schatten 2016). Solar energetic particle events appear as sharp increases in dose rate as observed by CRaTER and are typically associated with solar flares and subsequent coronal mass ejections (Gopalswamy et al. 2014), which propagate out through the solar wind and cause large-scale compressions in the inner heliosheath. Panels (a)–(e) were originally shown as part of the Schwadron & Bzowski (2018) study, although the time range indicated here is extended to periods prior to 2008. The LOS-integrated pressure maps of GDF observed by IBEX are shown (f), along with the spectral slope maps (g).
Download figure:
Standard image High-resolution imageAs discussed by Schwadron & Bzowski (2018), the association of conditions within the inner heliosheath with those at 1 au must account for the transit time of plasma from 1 au into the inner heliosheath to V2. An average plasma flow speed of 420 km s−1 is a typical reference value for low-latitude solar wind (Sokół et al. 2015). It takes ∼0.9 year for plasma parcels to move from 1 au to the termination shock at ∼84 au near the location where V2 crossed the termination shock (Richardson et al. 2008). Schwadron & Bzowski (2018) found that with the additional propagation time within the inner heliosheath included, there is a total transit time of ∼1 year for disturbances from 1 au to the location of V2.
The observed V2 density (Figure 9(a)) is compared to the solar wind ram pressure (b) at 1 au, and the magnetic field strength (c) at 1 au based on OMNI data (King & Papitashvili 2005). We have applied boxcar averaging over 1 year to show long-term trends. Daily V2 data (top panel in gray, Figure 9) were averaged over 1 year, resulting in the blue curve in the top panel.
The colored horizontal lines in Figure 9(b) indicate the averaging periods applied to the 1 au ram pressure. These averaging periods take into account the minimum transit time (1.5 year) and maximum transit time (5.2 year) over which solar wind disturbances travel from 1 au, move to the termination shock, and travel through the inner heliosheath. The transit times are applied along with the 3 year observation periods used for ENA LOS-integrated pressure maps to determine the time periods of solar wind at 1 au that affect the observed ENA maps. The LOS-integrated pressure maps of GDF observed by IBEX are shown (f) with the spectral slope maps (g).
In panel (d) of Figure 9, we show the dose rate observed by the Cosmic Ray Telescope for the Effects of Radiation (CRaTER, Spence et al. 2010; Schwadron et al. 2012) on the Lunar Reconnaissance Orbiter (LRO). In panel (e), we show solar sunspot number. We have shifted the horizontal scale in panel (a) relative to the subsequent panels (b)–(e) to represent the transit time (∼1 year) from 1 au from the inner heliosheath to the position of V2. CRaTER observations show solar energetic particle events as sporadic, abrupt increases in dose rate (Schwadron & McComas 2017), and are associated with coronal mass ejections that propagate through the heliosphere to form large-scale compressions that propagate through the heliosheath.
There is reasonable agreement between the changes in the GDF near the pressure maximum and the averaged ram pressures derived from transit-time-corrected 1 au data (colored data points in Figure 9). The averaged 1 au ram pressures generally decrease until the period corresponding to the 2013–2015 map (purple data point in panel (b). The period corresponding to the 2014–2016 map (corresponding to the gray data point in panel (b) is almost at the same level, but is slightly higher than the previous year. Similarly, the GDF maps in 2013–2015 and 2014–2016 have almost the same magnitude for the pressure maximum. Throughout most of the 9 year period observed, we find reductions in the GDF, consistent with an average decline in the ram pressure when correcting for solar wind propagation times. The conditions reflected by GDF maps from 2009 through 2016 are consistent with an expanding heliosheath, provided that plasma cooling overcomes any increase in the LOS from expanding heliospheric boundaries.
The conditions appear to change abruptly in the 2015–2017 GDF map. In fact, as reported by McComas et al. (2018), the conditions change so quickly that there appears to be a longitudinal discontinuity near the nose. The brightening observed within this 2015–2017 GDF map reflects a strongly time-dependent change manifesting most prominently in 2017.
The heliosheath responds to time-dependent changes in the solar wind ram pressure. Over most of the 9 year period analyzed we have observed drops in the LOS-integrated pressure due to expansion of the heliosheath driven by reductions in the solar wind ram pressure. In the 2015–2017 period, we have observed some recovery in the LOS-integrated pressure due to a significant increase in the ram pressure observed at 1 au beginning in 2015.
Despite the large changes near the nose, the LOS-integrated pressure near the tail shown in Figure 6 remain relatively stable. Accounting for the stability of the tail will require understanding how time variations propagate downtail along the LOS. Presumably this stability requires that the LOS in the tail is significantly longer than the LOS near the nose. This reinforces the conclusion that the structure of the heliosphere is not round, and has a long comet-like tail (Schwadron & Bzowski 2018).
3.3. Time-dependent Changes in the IBEX Ribbon
We approach the time-dependent changes in the IBEX ribbon by considering the secondary neutral solar wind as the source. In this model, the solar wind conditions at 1 au are reflected in the ENA flux from the IBEX ribbon after a time delay consisting of a travel time from 1 au to the source region, the charge-exchange lifetime of a newly ionized proton in the ribbon, and the time necessary to return from the source region to IBEX located at 1 au. We use the parallax distance of  au based on the study of Swaczyna et al. (2016a). We find that a 1 keV neutral atom moves from 1 au to the source region in
  years. The charge-exchange lifetime of a newly ionized proton in the ribbon at 1 keV is ∼2.5 years. The transit time of the neutral atom back to 1 au is also
  years. Adding up these terms, we find a time delay of
  years between the observation of solar wind at 1 au and the ENA observations of manifestations of this solar wind within the ribbon at 1 keV. At 4 keV, the propagation time from 1 au to the ribbon distance (and vice versa, for propagation from the ribbon to 1 au) is
  years. The charge-exchange lifetime of this 4 keV ENA is ∼2 years, yielding a time delay of
  . The estimations of these time delays are rough, largely due to uncertainties in our understanding of how the ribbon is formed, and its location. Although it is possible to formulate a more specific model, we limit our analysis here to this rough estimate, since any ribbon model has large associated uncertainties, and because there is an array of competing ideas for the formation of the ribbon, as detailed in the introduction.
The first LOS-integrated pressure map reported in Figure 2 had an observed start time of 2009.0 and an end time of 2012.0. Given the lower estimate of the time delay of 3.1 years and the larger estimate of 7.3 years for the ribbon, we find that the ribbon observed in the LOS-integrated pressure map responds to solar wind observed at 1 au over the period from 2001.7 to 2008.9. Figure 10 compares the solar wind conditions at 1 au with the LOS-integrated maps observed by IBEX. We show solar wind ram pressure at 1 au (a), and the magnetic field strength at 1 au (b) based on OMNI data (King & Papitashvili 2005). We have applied boxcar averaging over 1 year to show long-term trends. In the panel c we show the solar sunspot number.

Figure 10. Transit-time corrections applied to the LOS-integrated pressure maps of the ribbon observed by IBEX over 9 years of data. The solar wind ram pressure is shown in panel (a) and the magnetic field strength at 1 au is shown in panel (b) near Earth from OMNI data (King & Papitashvili 2005). The colored horizontal lines in panel (a) correspond to the time periods over which solar wind conditions observed at 1 au affect conditions in the inner heliosheath observed in corresponding LOS-integrated pressure maps (d). The large colored dots in panel (a) show the average ram pressures over the periods indicated by the colored horizontal lines. Solar sunspot numbers are shown in panel c (Svalgaard & Schatten 2016). The LOS-integrated pressure maps of ribbon observed by IBEX are shown in (d).
Download figure:
Standard image High-resolution image
The colored horizontal lines in Figure 10(a) indicate the averaging periods applied to the 1 au ram pressure. These averaging periods take into account the delay times between observations of solar wind at 1 au and the observations of the ribbon in ENAs along with the 3 year observation periods used for ENA LOS-integrated pressure maps. The LOS-integrated pressure maps of the ribbon observed by IBEX are shown in (d).
We observe changes in the LOS-integrated pressure that appear to be consistent with the changes in the average ram pressure of the solar wind observed at 1 au when correcting for the time delays. These time delays account for transit to and from the ribbon, and the 2–2.5 year charge-exchange lifetime of ions within the ribbon. This appears to support a ribbon source beyond the heliopause associated with the secondary solar wind.
4. Summary and Conclusions
We have separated the IBEX ribbon from the GDF in 3 year intervals over 9 years of IBEX observations. We observe time variations in the GDF across a broad region centered on the LOS-integrated pressure maximum (within ∼40° of the pressure maximum). These time variations are roughly correlated with variations in the ram pressure of the solar wind observed at 1 au, taking into account time delays associated with propagation through the solar wind and inner heliosheath. Similarly, we observe time variations in the LOS-integrated pressure of the ribbon that are associated with time variations in the solar wind ram pressure, taking into account time delays for propagation from 1 au to the ribbon, the time required for charge-exchange within the ribbon, and the propagation from the ribbon back to 1 au. In contrast to the time variations observed in the ribbon and observed near the noseward pressure maximum in the GDF, the LOS-integrated pressure near the heliotail is relatively stable. This strongly reinforces the conclusion that the heliosphere has a comet-like shape with a well-defined heliotail.
The key products of our analysis are separated LOS-integrated pressure maps of the IBEX ribbon and the globally distributed flux. These maps will be the subject of the next IBEX data release (release 14).
We are deeply indebted to all of the outstanding people who have made the IBEX mission possible. This work was carried out as part of the IBEX project, with support from NASA's Explorer Program. J. S., M. B., and M. A. K. were supported by the Polish National Science Centre (Grant 2015-18-M-ST9-00036).