Modelling crop production, river low flow, and sediment load trade-offs under agroforestry land-use scenarios in Nyangores catchment, Kenya
 Ann W. Kamamia
 Michael Strauch
 Hosea M. Mwangi3
  Karl-Heinz Feger
 Stefan Julich
- 1Institute of Soil Science and Site Ecology, Technische Universität Dresden, Dresden, Germany
- 2Department of Computational Landscape Ecology, Helmholtz Centre for Environmental Research GmbH-UFZ, Leipzig, Germany
- 3Department of Soil, Water, and Environmental Engineering, Jomo Kenyatta University of Agriculture and Technology, Nairobi, Kenya
- 4Faculty of Landscape Management and Nature Conservation, Eberswalde University for Sustainable Development, Eberswalde, Germany
The largest impact of land-use change on catchment hydrology can be linked to deforestation. This change, driven by exponential population growth, intensified food and industrial production, has resulted in alterations in river flow regimes such as high peaks, reduced base flows, and silt deposition. To reverse this trend more extensive management practices are becoming increasingly important, but can also lead to severe losses in agricultural production. Land-use optimization tools can help catchment managers to explore numerous land-use configurations for the evaluation of trade-offs amongst various uses. In this study, the Soil and water assessment tool (SWAT) model was coupled with a genetic algorithm to identify land-use/management configurations with minimal trade-offs between environmental objectives (reduced sediment load, increased stream low flow) and the crop yields of maize and soybean in Nyangores catchment (Kenya). During the land-use optimization, areas under conventional agriculture could either remain as they are or change to agroforestry or conservation agriculture (CA), where the latter was represented by introducing contour farming and vegetative filter strips. From the sets of the resulting Pareto-optimal solutions we selected mid-range solutions, representing a fair compromise among all objectives, for further analysis. We found that a combined measure implementation strategy (agroforestry on certain sites and conservation agriculture on other sites within the catchment) proved to be superior over single measure implementation strategies. On the catchment scale, a 3.6% change to forests combined with a 35% change to CA resulted in highly reduced sediment loads (−78%), increased low flow (+14%) and only slightly decreased crop yields (<4%). There was a tendency of the genetic algorithm to implement more extensive management practices in the upper part of the catchment while leaving conventional agriculture in the lower part. Our study shows that a spatially targeted implementation strategy for different conservation management practices can remarkably improve environmental sustainability with only marginal trade-offs in crop production at the catchment-level. Incentive policies such as payments for ecosystem services (PES), considering upstream and downstream stakeholders, could offer a practical way to effect these changes.
Introduction
The largest impact of land-use change on catchment hydrology can be linked to deforestation. This change, driven by exponential population growth, intensified food and industrial production (Foley et al., 2005; Kamamia et al., 2022), has resulted in alterations in the river flow regime such as high peaks, reduced base flows, and silt deposition in water bodies and reservoirs (Bajocco et al., 2012; Borrelli et al., 2017; Kamamia et al., 2021). Furthermore, climate change has accelerated land degradation by intensifying extreme events such as droughts and floods whose ramifications have been especially felt in the developing countries (Borrelli et al., 2017). Mounting evidence suggests an exacerbation of this situation by 2050 with more pronounced changes at the sub-regional/catchment scale (Boretti and Rosa, 2019). In Kenya, deforestation has greatly impacted the five major water towers (Mount Kenya, Mau Forest, Aberdare Forest, Mount Elgon, and Cherangani) which supply about 75% of the total freshwater and which support important ecosystems that are vital for the country’s sustainable production. Deforestation in Mount Kenya, Aberdare Forest, Mount Elgon, and Cherangani water towers has led to a decline in rainfall amounts (e.g., less cloud water interception) accompanied by shifting rainfall patterns thereby reducing their productivity (Mwangi et al., 2020). Additionally, climate change impacts associated with weather variability such as high temperatures have increased forest fires incidents, further threatening the existing forests (Schmitz and Kihara, 2021). Mulinge et al. (2016) reported a 32% decrease in forest cover for the Mau forest water tower (in which the Nyangores catchment is located) between 2001 and 2009. They attributed this to population expansion which stimulated: (i) an extension of cropland (with unsustainable agricultural practices) into forested areas, (ii) an encroachment of marginal lands and forests by pastoralist communities, and (iii) an increased demand for fuel wood and timber (Cohen et al., 2006; Mulinge et al., 2016; Kogo et al., 2020).
In this regard, catchment management is necessary in order to protect the natural ecosystem as well as to achieve a sustainable use of agricultural land in degraded areas. Soil and water conservation practices also referred to as catchment management strategies (CMSs) are the primary steps of catchment management whose purpose is to enhance agricultural productivity and protect catchments. Specifically, they aim at decreasing runoff rates, improving soil fertility, retarding soil erosion, and thus increasing soil-moisture availability and groundwater recharge (WOCAT, 2007). Agroforestry has in particular been the focus of many catchment management programs in the developing world (many countries in Africa, Asia, and Latin America whose economies are agriculture-driven) (World Agroforestry, 2021). Agroforestry has been considered a key pathway to restoring degraded ecosystems and achieving food security globally. Within these systems, reforestation efforts have been scaled up to combat the alarming rates of deforestation and forest degradation. The contribution of trees to carbon sequestration, nitrogen fixation and provision of a source of income has been ranked higher and is perceived more sustainable than other CMSs (Speranza, 2010). However, in order to reap the numerous benefits offered by trees, it is imperative to determine at the catchment scale where and what proportion of land can reasonably be converted. Since trees consume more water than other vegetation (Mwangi et al., 2016a; Kirschke et al., 2018) an improper allocation could magnify an already existing water scarcity situation. Moreover, CMSs threaten the productive capacity of catchments as their implementation may lead to losses in agricultural production. Thus, there is need for a comprehensive and systematic understanding of the possible adverse effects of agroforestry and its combination with other CMSs on the different ecosystem services. Tools such as hydrologic models have been used to conceptualize the impacts of the climatic and anthropogenic changes on the different sub-processes within the hydrologic cycle (Legesse et al., 2003). For instance, Asres and Awulachew (2010), Strauch and Volk (2013), and Memarian et al. (2014) used the soil water assessment tool (SWAT) hydrologic model in different tropical countries to assess the impact of land-use/land cover change on water discharge and sediment load. Mango et al. (2011) investigated the impact of complete deforestation and climate change on the catchment water balance in the Nyangores catchment-Kenya, using the SWAT model. Mwangi et al. (2016a) extended this study to assess the effect of implementing different agroforestry scenarios on the various water balance components. In the two latter studies, only a few pre-selected options were evaluated to characterize possible futures. Cao et al. (2011) and Seppelt et al. (2013) argue that classical approaches of scenario analysis result in the exclusion of more optimal solutions not considered during the scenario selection/formulation step. Also, using certain model outputs in isolation, focusing on only one target service, can prompt the enhancement of one ecosystem service while masking the deterioration of other essential ecosystem services.
Therefore, the use of such models for developing spatially-explicit catchment management plans has been supplemented with land-use optimization tools (Lautenbach et al., 2013; Verhagen et al., 2018; Strauch et al., 2019; Kaim et al., 2021). In reality, catchments have multifunctional uses, shared by different stakeholders who may have contradicting aims and interests (objectives) which they seek to defend (Kaim et al., 2020). Land-use optimization tools offer a solution by exploring a large number of land-use management configurations for the simultaneous optimization of various objectives (Lautenbach et al., 2013; Chapagain et al., 2021). Land-use optimization tools differ in the number of objectives, scale applied and the timing of inclusion of stakeholders and decision makers (Strauch et al., 2019). Multi-objective optimization problems can be solved using either scalarization or Pareto-based methods. Scalarizing methods combine multiple objective functions into one single scalar function, e.g., using a weighted sum. Pareto-based methods present the different trade-offs as a Pareto frontier which is a set of optimal solutions to the respective multi-objective optimization problem (Kaim et al., 2018). Within a Pareto frontier, no objective can be further improved without compromising the other objectives. Possible solutions are identified either by maximizing or minimizing the different objectives using genetic algorithms (GAs) (Deb et al., 2002). Genetic algorithms start with an initial population and use concepts such as selection, mating, and mutations to create the next set of solutions (Kaim et al., 2018). Parameters to be optimized are encoded in a genome and the individuals in a population are then evaluated based on objective functions. GAs are highly explorative and gradient free which means that they can deal with complex, non-linear and discontinuous problems (Mitchell, 1996; Kaim et al., 2018). However, these algorithms are unconstrained by nature and have to be modified to reflect real world scenarios. In terms of land-use allocation, this could include setting rules constricting the conversion of one land-use to another and/or setting the minimum and maximum area that can possibly be converted (Strauch et al., 2019). Land-use optimization tools using the non-sorting Genetic Algorithm-II (NSGA-II) have proven to solve complex land allocation problems based on the optimization of different user specified objectives. Wicki et al. (2021) applied a land-use optimization tool to aid in planning green and dense cities based on a trade-off between urban ecosystem services and compactness. Kaim et al. (2020) coupled SWAT and a bird species distribution model with NSGA-II in order to optimize land management strategies for biodiversity, water quality and quantity, and agricultural production. On the resulting set of Pareto-optimal solutions, they applied stakeholder preferences to identify “best-compromise” solutions. Rodriguez et al. (2011) as well as Panagopoulos et al. (2012) applied SWAT and NSGA-II in the selection and placement of best management practices which minimized pollution in a cost effective way. Also, Lautenbach et al. (2013) coupled SWAT with NSGA-II. They analyzed the biophysical trade-off between bioenergy crop production and stream water quality and quantity.
The Nyangores sub-catchment management plan (WRUA, 2011) created by the Mara River Water Users Association indicated that this catchment faces severe water quality and quantity problems. In order to address this situation, they proposed reforestation using indigenous trees in addition to the adoption of water and soil conservation measures. However, this report lacks information on exactly how and where within the catchment these measures should be targeted. This poses a potential challenge for all stakeholders in the area. Against this background, the main objective of this study is to determine functional trade-offs between environmental sustainability and food production in the Nyangores catchment, Kenya. To achieve this purpose, we coupled SWAT with NSGA-II to explore different land-use combinations representing the best-possible trade-off (or Pareto) solutions in a four-dimensional objective space defined by (i) minimizing sediment load, (ii) maximizing stream low flow, and (iii, iv) maximizing the crop yields of maize and soybeans, respectively. To the best of our knowledge, no previous study has considered the consequences of implementing the proposed CMSs for different, partly conflicting, dimensions of sustainability in the Nyangores catchment. This study therefore aims to provide practical solutions for solving the major problems experienced in the catchment. Moreover, although agroforestry is well promoted as a way of restoring trees in many other developing countries, its impact on several ecosystem services is not well researched (Muthee et al., 2022). The methodology adopted here can be customized for these regions. It also allows for an easy inclusion of stakeholders who can then be involved in developing targeted policy interventions which balance environmental goals and the social needs of the existing population.
Materials and methods
Nyangores catchment
The Nyangores catchment (Figure 1A) covers a total area of 694 km2 and is part of the greater Mara River basin which is shared between Kenya (65%) and Tanzania (35%). The altitude ranges from 2,970 m at the Mau escarpment to 1,905 m at Bomet stream gauging station. The mean annual rainfall ranges between 1,000 and 1,750 mm (Mati et al., 2008). Rainfall peaks twice a year: March–May (long rainy season) and September-November (short rainy season). The main river in the catchment is the Nyangores River (Figure 1B). Andosols, characterized by favorable aggregate structure and high porosity, are the dominant soils in the catchment (Figure 1C). The Nyangores catchment holds the largest proportion of Montane forests within the Mara basin and the remaining area is covered by small-scale agriculture. The main crops grown in the catchment include: maize, beans, soybeans, sorghum, potatoes, and oilseeds. In areas with high rainfall uncertainty the farmers practice intercropping (Omonge et al., 2020). Otherwise, maize is primarily grown within the first long rainy season (April/May) and harvested in September while the other crops take advantage of the short rains and are harvested in February, thus completing a crop rotation schedule. A major land-use shift from forest to agriculture has significantly affected the hydrological regime (water quality and quantity) in the catchment (Mwangi et al., 2016a). This has raised concern as the middle part of the Mara River basin hosts a major wildlife-reserve ecosystem, that heavily relies on the water resources (Mati et al., 2008; Mwangi et al., 2016a). Omonge et al. (2020) predicted an increase in water scarcity in the area driven by population expansion (+4% per annum) and intensified agriculture. Thus, there is urgent need for the development and implementation of CMSs to combat the water crisis in the catchment while still ensuring continued and sustained food production.
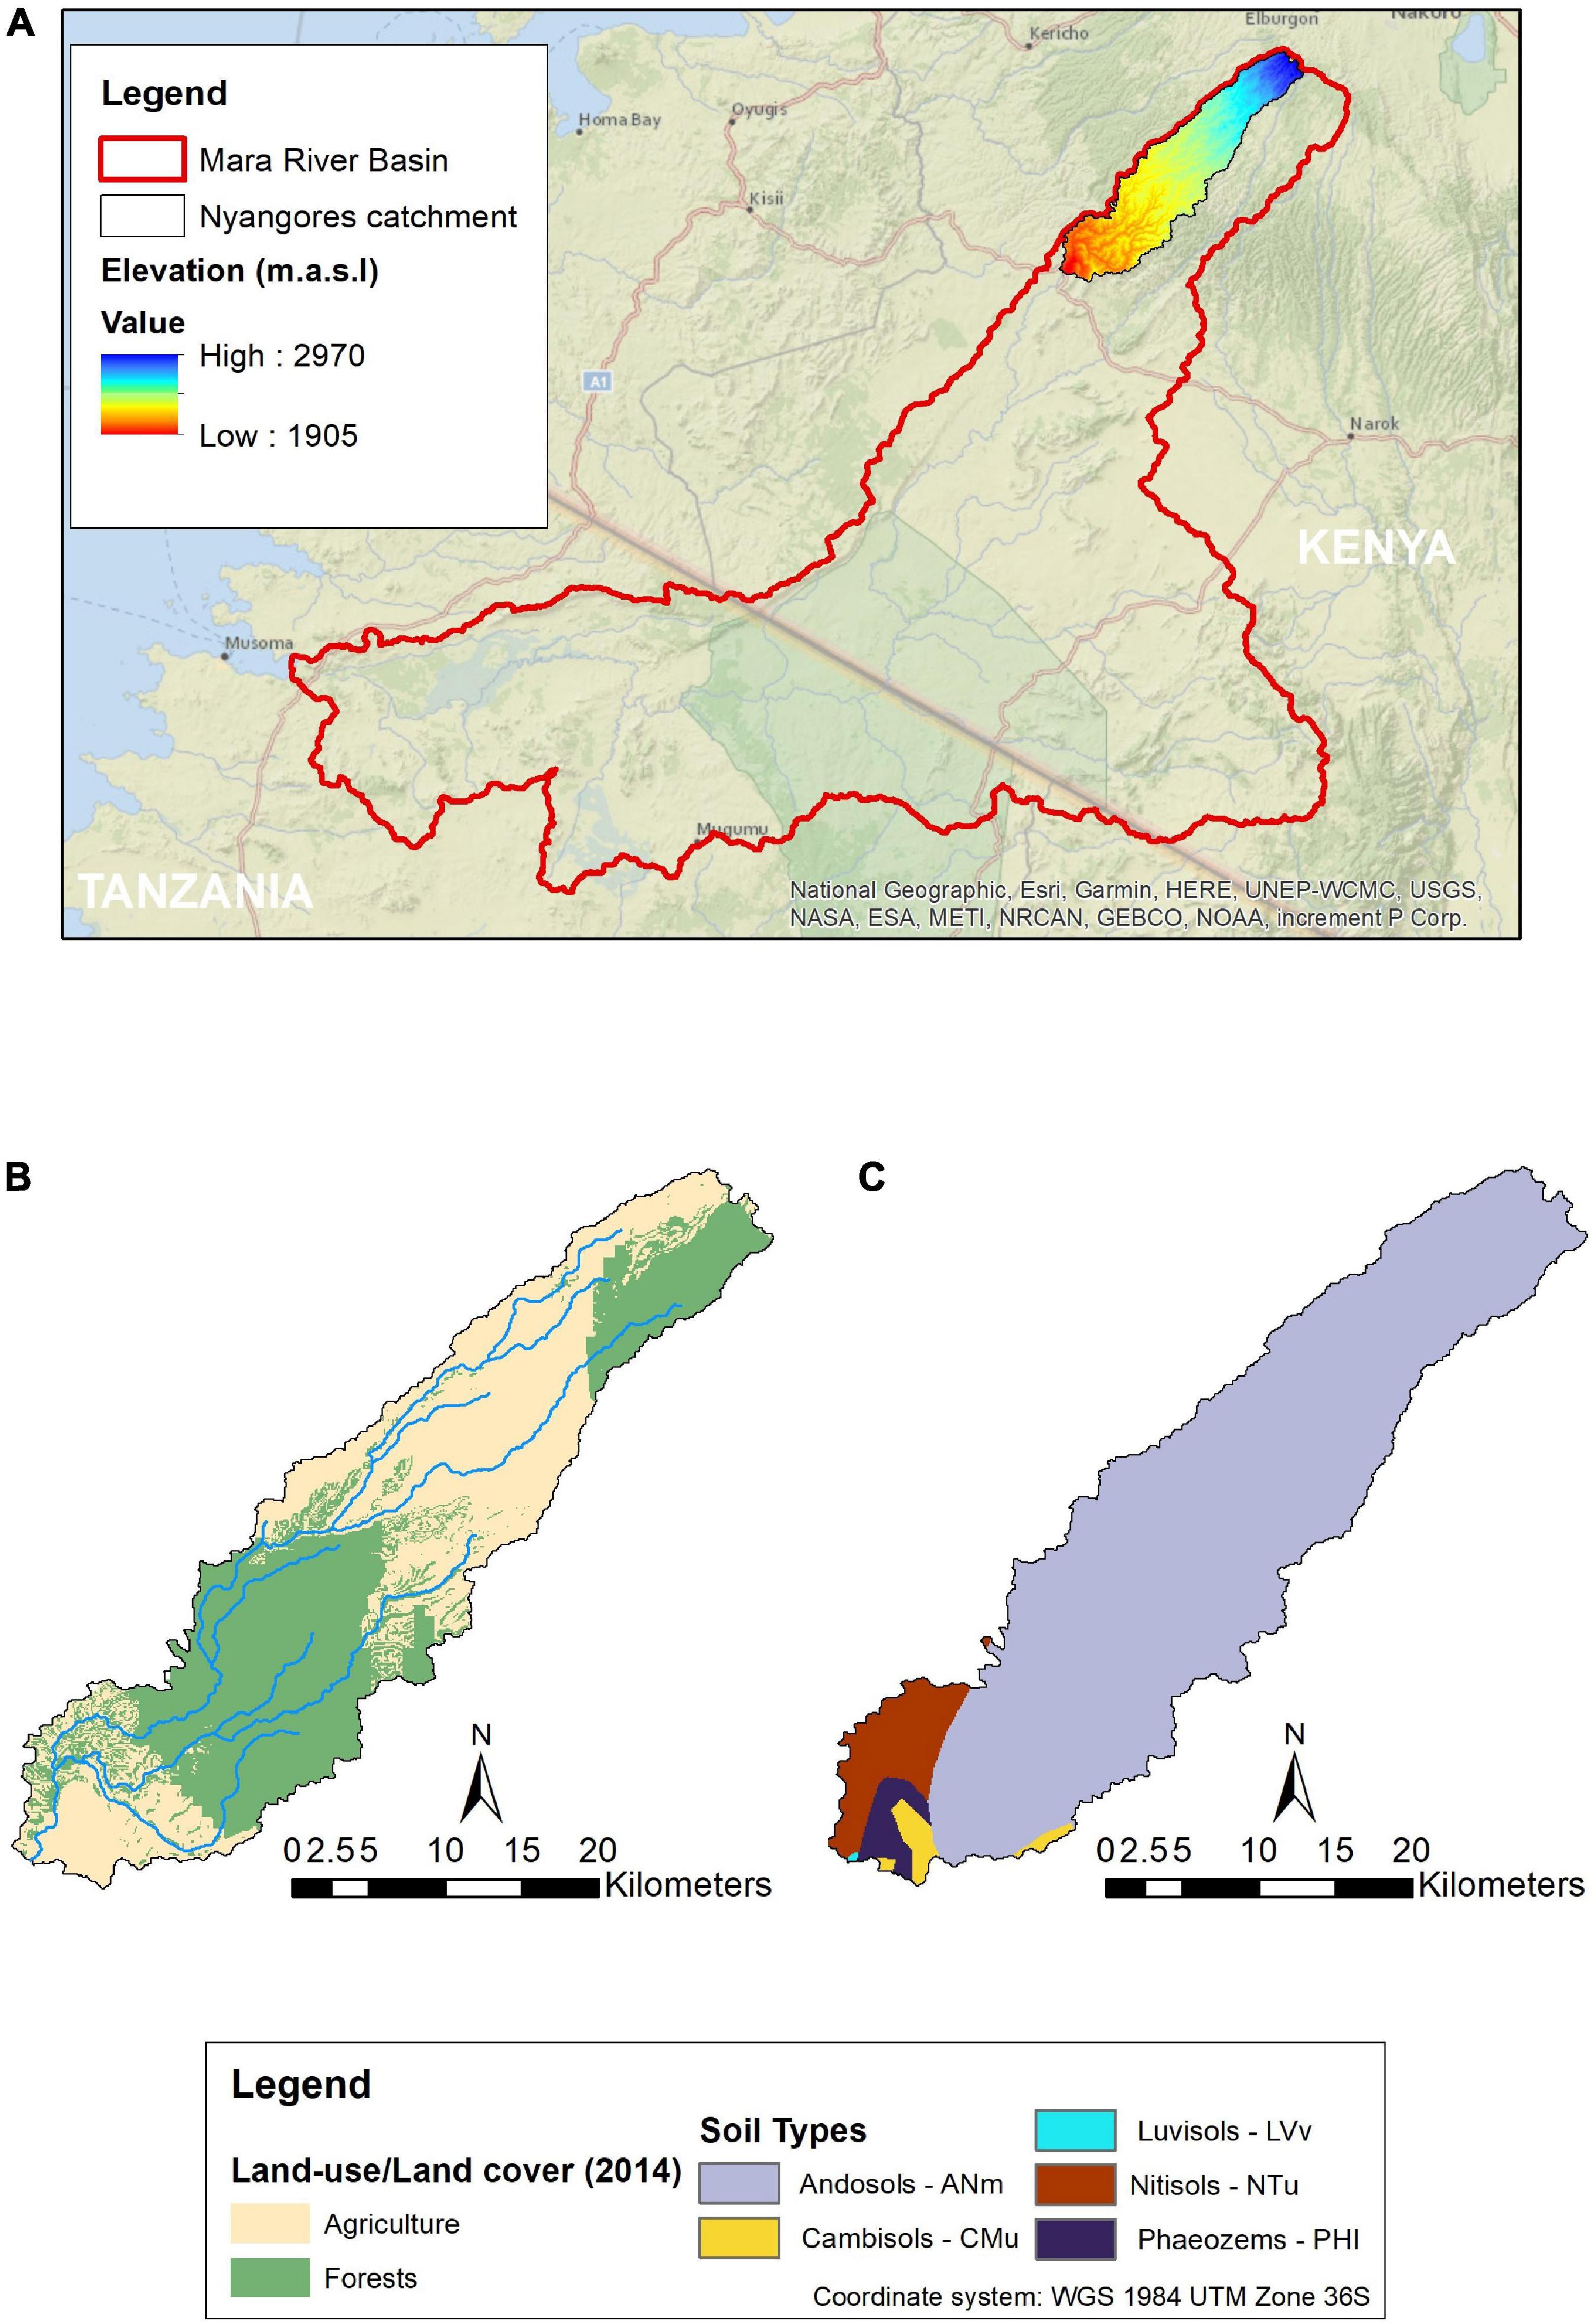
Figure 1. Nyangores catchment (A) location and elevation, (B) land-use/land cover, and (C) soil types.
Datasets
A 30-m digital elevation model (DEM) and Landsat-8 operational land imager (OLI) were downloaded from the Earth Explorer hosted by the United States Geological Survey (EarthExplorer-USGS, 2019). A soil map (scale 1: 250,000) and soil database were obtained from the Soil and Terrain (SOTER) database of the International Soil Reference and Information Centre (ISCRIC) (Batjes, 2008). A land-use map (1983) coinciding with the period selected for calibration and validation was sourced from the Survey of Kenya (SOK). Furthermore, daily rainfall data for 20 stations located in and within the vicinity of the Nyangores catchment, and climate data (relative humidity, wind speed, maximum and minimum temperature, and solar radiation) from Narok, Kericho, and Kisii weather stations were obtained from the Kenya Meteorological Department (KMD). Discharge data for the only existing stream gauging station-LA03-Bomet was obtained for calibration purposes. The presence of data gaps limited the calibration period to the 4 year period from 1975 to 1978.
Due to lack of observed sediment load data, a time series was determined by relating discharge at the catchment outlet and sediment concentration (SC) using Eq 1 (Kiragu, 2009), which was specifically developed for the study area, and Eq 2 (Bartram et al., 1996).
where:
SC is the sediment concentration .
Q is the discharge in m3/s. and
where SL is the suspended sediment load in tonnes/day.
Supplementary Appendix I provides a summary of the datasets used for the analysis.
Soil water assessment tool base scenario set-up
The SWAT model is a continuous time, semi-distributed process based river basin model (Arnold et al., 2012). Soil water assessment tool operates on a daily time step and was developed to determine the impact of land use and management on water, sediment, agricultural, and chemical yields. In SWAT, the catchments are divided into sub-catchments which are further divided into hydrologic response units (HRUs) which consist of homogeneous land use, management, soil, and slope. These units are represented as a percentage of the total catchment area. The main components include: weather, hydrology, soil properties, plant growth, nutrition, pesticides, bacteria, pathogens, and land management. A detailed description is provided by the theoretical documentation (Neitsch et al., 2011).
The model setup and calibration for discharge was done following Kamamia et al. (2019) using the ArcSWAT version 2012.10.2.18. The DEM-30 m was loaded into the ArcGIS environment (ArcMap version 10.2) and used as a base for watershed delineation. All other inputs (land use map, soil map) were prepared and entered into the model. The slope was divided into four classes: 0–10, 10–20, 20–30, and above 30%. Potential evaporation was calculated using the Priestly and Taylor method (1972) which is based on radiation. The following adjustments were made to adequately simulate growth of perennial vegetation dynamics in the tropics (c.f., Mwangi et al., 2016a; Kamamia et al., 2019). (i) Lowering the Potential Heat Units (PHU) from 0.15 to 0.001, (ii) Increasing the minimum leaf area index (LAI) from 0.75 to 3 to ensure continuous evapotranspiration of trees and perennials (iii) Using the “kill” operation to restart the growth cycle of trees and perennial crops. The curve number (CN2) parameter was also adjusted depending on plant evapotranspiration. Using the set of most sensitive parameters presented in Supplementary Appendix II, calibration for discharge and sediment were undertaken simultaneously. R2 and Nash-Sutcliffe efficiency (NSE) were used as statistical indices to assess the ability of the model to match the data observed. The R2 estimates how well the model variance prediction represents those of the observed values. These values range from 0 (no correlation) to 1 (perfect correlation) (Moriasi et al., 2007). The NSE measures how well the simulated output matches the observed along a 1:1 regression line. NSE values ≤0 indicate that the observed data mean is more accurate than the simulated output (Moriasi et al., 2007). For simulating sediment loads, performance values of 0.55 and 0.62 were achieved for NSE and R2, respectively.
Maize and soybean were selected for the modeling exercise to represent the crops to be grown during the long and short rains, respectively. Using a 2014 land-use map, the agricultural HRUs were adjusted to reflect the actual cropping seasons indicated in section “Nyangores catchment”. According to literature, annual maize yield in Nyangores catchment is between 2,500 and 4,000 kg/ha (Ngome et al., 2013) while that of soybean is averaged at 1,000–2,500 kg/ha (FAO, 2011). This is considerably lower than the potential of 6,000 kg/ha for maize and 30% higher for soybeans. During planting, inorganic fertilizer diammonium phosphate (18%N, 20%P) is applied at the average rate of 135 kg/ha which is also well below the recommended 250 kg/ha (Munialo et al., 2020). Despite a slight improvement in output over the last two decades, the low application of both organic and inorganic fertilizers, poor soil management and climate and pest related hazards have contributed to what would be still regarded as low yield output (Munialo et al., 2020). The hand-hoeing method was selected to represent tillage in the SWAT agricultural management files. Planting and harvesting dates for Maize and Soybean were set to 1st April and 31st August and 1st October and 15th February, respectively. The biomass outputs of both crops were checked against the values obtained in literature (see section “Nyangores catchment”) and the PHUs adjusted accordingly. Moreover, the management files were adjusted to represent the land use of 2014. Mwangi et al. (2016b) estimated that climate variability only contributed 2.5% to the changes in streamflow in the catchment between 1980 and 2014 while the rest was linked to land-use change. Thus, it was necessary to adjust this to capture the drastic land-use change. The already calibrated model was run one last time to reflect the aforementioned adjustments and obtain the final base scenario model.
Set-up of catchment management strategies scenarios and use of land-use optimization tool
The main CMSs can be classified as structural, agronomic, and vegetative measures (Liniger et al., 2002). Structural measures (such as terraces and contour banks) lead to a change in slope. They are mainly permanent and often require high inputs of labor and capital for installation (Liniger et al., 2002; Mwangi, 2011). Agronomic measures, usually associated with annual crops are applied regularly in each season and include contour cropping/mixed/cover cropping and mulching (Mati et al., 2008; Mwangi, 2011; Gathagu et al., 2018). Vegetative measures use perennial grasses and trees over a long time. For small-scale farming, vegetative and agronomic measures are prescribed as they are easier to adopt, cost less and still lead to an improvement of the catchment (Liniger et al., 2002; Mwangi, 2011). These CMSs can be used in isolation or combination with other measures. Mwangi et al. (2015) evaluated the impact of different conservation practices on water and sediment yield in the Sasumua catchment in Kenya. When implemented in isolation, a 10 m filter strip and contour farming reduced sediment inflow to the river by 35 and 24%, respectively. When combined, a 41% sediment reduction was recorded. Reforestation practices in which woody perennials are deliberately grown in deforested areas have been used to restore degraded areas (Mwangi, 2011; Mwangi et al., 2015). Trees within this system provide both productive and protective functions. Among the productive functions, the five “Fs” (fuel wood, food, fodder/feed, fiber, and fertilizer) (Atangana et al., 2014) are principal. The protective functions include shade, reduction in wind speed, erosion control, carbon sequestration, and climate change adaptation (Atangana et al., 2014; Nair et al., 2021).
Therefore, agroforestry and agronomic scenarios were implemented at the HRU level and slope-wise for the agricultural land use only. In ArcSWAT version 2012.10.2.18, agroforestry was simulated as woodlots. Contour farming and vegetative filter strips were selected to represent agronomic vegetative measures. Contour farming is a form of agriculture where farming activities are done across the slope rather than up and down the slope (Liniger et al., 2002). The rows of crops planted across the slope block water flow allowing it more time to infiltrate which reduces surface run-off and erosion. In order to represent contour farming, the CN2 value of all agricultural HRUs in the SWAT model were reduced by three units according to Mwangi et al. (2015). Furthermore, the Universal Soil Loss Equation (USLE_P) parameter was adjusted according to Neitsch et al. (2011) depending on the slope of the HRU. In order to represent the vegetative filter strips such as Napier grass, the width of edge-of-field filter strip parameter (FILTERW) was set at 5 m according to Mwangi (2011) who reported that the combined use of contour farming and a 5 m vegetative filter strip produced the largest reduction in sediment load (∼73%). Three different scenarios were represented by three different model setups. These were the adoption of: (i) agroforestry only – Scenario 1, (ii) agroforestry + contour farming + vegetative filter strips (CA) – Scenario 2, and (iii) CA only– Scenario 3.
Objective functions and constrained multi-objective optimization algorithm
In this study, four different objective functions were selected to be optimized with the genetic algorithm NSGA-II. The functions describe catchment-scale environmental and economic values that can be directly derived from SWAT model outputs:
i) Minimize average sediment load (Sed_ld) in tons/year at the gauging station (minimize-∫1).
ii) Maximize discharge under low flow conditions measured using the mean annual minimum (MAM) stream low-flow indicator in L/s (minimize-∫2).
iii) Maximize catchment-wide total harvested maize yield (Mai_yld) in kilotons/year (minimize-∫3).
iv) Maximize catchment-wide total harvested soybean yield (Soy_yld) in kilotons/year (minimize-∫4).
Soil water assessment tool was coupled with NSGA-II using CoMOLA, a generic Python environment for Constrained Multi-objective Optimization of Land use Allocation (Strauch et al., 2019). This software is available at: https://github.com/michstrauch/CoMOLA. The tool has been applied for a wide range of spatially explicit models in multiple case studies (Verhagen et al., 2018; Bartkowski et al., 2020; Kaim et al., 2020; Schwarz et al., 2020; Witing et al., 2022). CoMOLA supports user-defined models or objective functions and allows for basic land use constraints, such as (i) transition rules defining which type of land use can be converted into another and (ii) minimum and maximum area proportions of each land use type within the study area. In this study, land use was optimized for a set of 98 HRUs, which are currently used for conventional agriculture. The HRUs could either remain as conventional agriculture, change to forest (in scenario 1) or change to forest or CA (in scenario 2) or change to CA (in scenario 3). By optimizing agricultural HRUs only, all existing forests remained at the same location.
Figure 2 displays a schematic view of the CoMOLA workflow, which is inspired by biological evolution: The group of 98 HRUs with its base scenario setup (conventional agriculture) is defined as the starting individual. Based on the starting individual and the pre-defined transition rules, CoMOLA starts an evolutionary process by creating a set of different HRU configurations. Each HRU configuration is called an individual and is represented by a genome, i.e., a string of integers (n = 98) encoding the land cover and management of each HRU. All individuals of one generation form a population which changes over generations due to selection and variation (i.e., combination and mutation): Using the objective functions described above, each individual is assigned fitness values representing the achieved values for the four objectives, which are derived from running SWAT. Based on their fitness values, the algorithm applies a Pareto ranking for all individuals. Best performing individuals are archived and selected for mating to generate a new (offspring) population. In mating, each offspring individual is generated by a random combination (crossover) of two genomes. The likelihood of mating increases for individuals with a higher Pareto rank. Additional random mutations increase the diversity of genomes to consider a wide range of different HRU configurations. Mating and mutation can result in constraint-violating (so-called “infeasible”) offspring individuals. Genomes of infeasible individuals are modified using a repair operation described in Strauch et al. (2019). The entire procedure, from fitness value calculation to offspring generation and genome repairing, is repeated for a pre-defined number of generations.
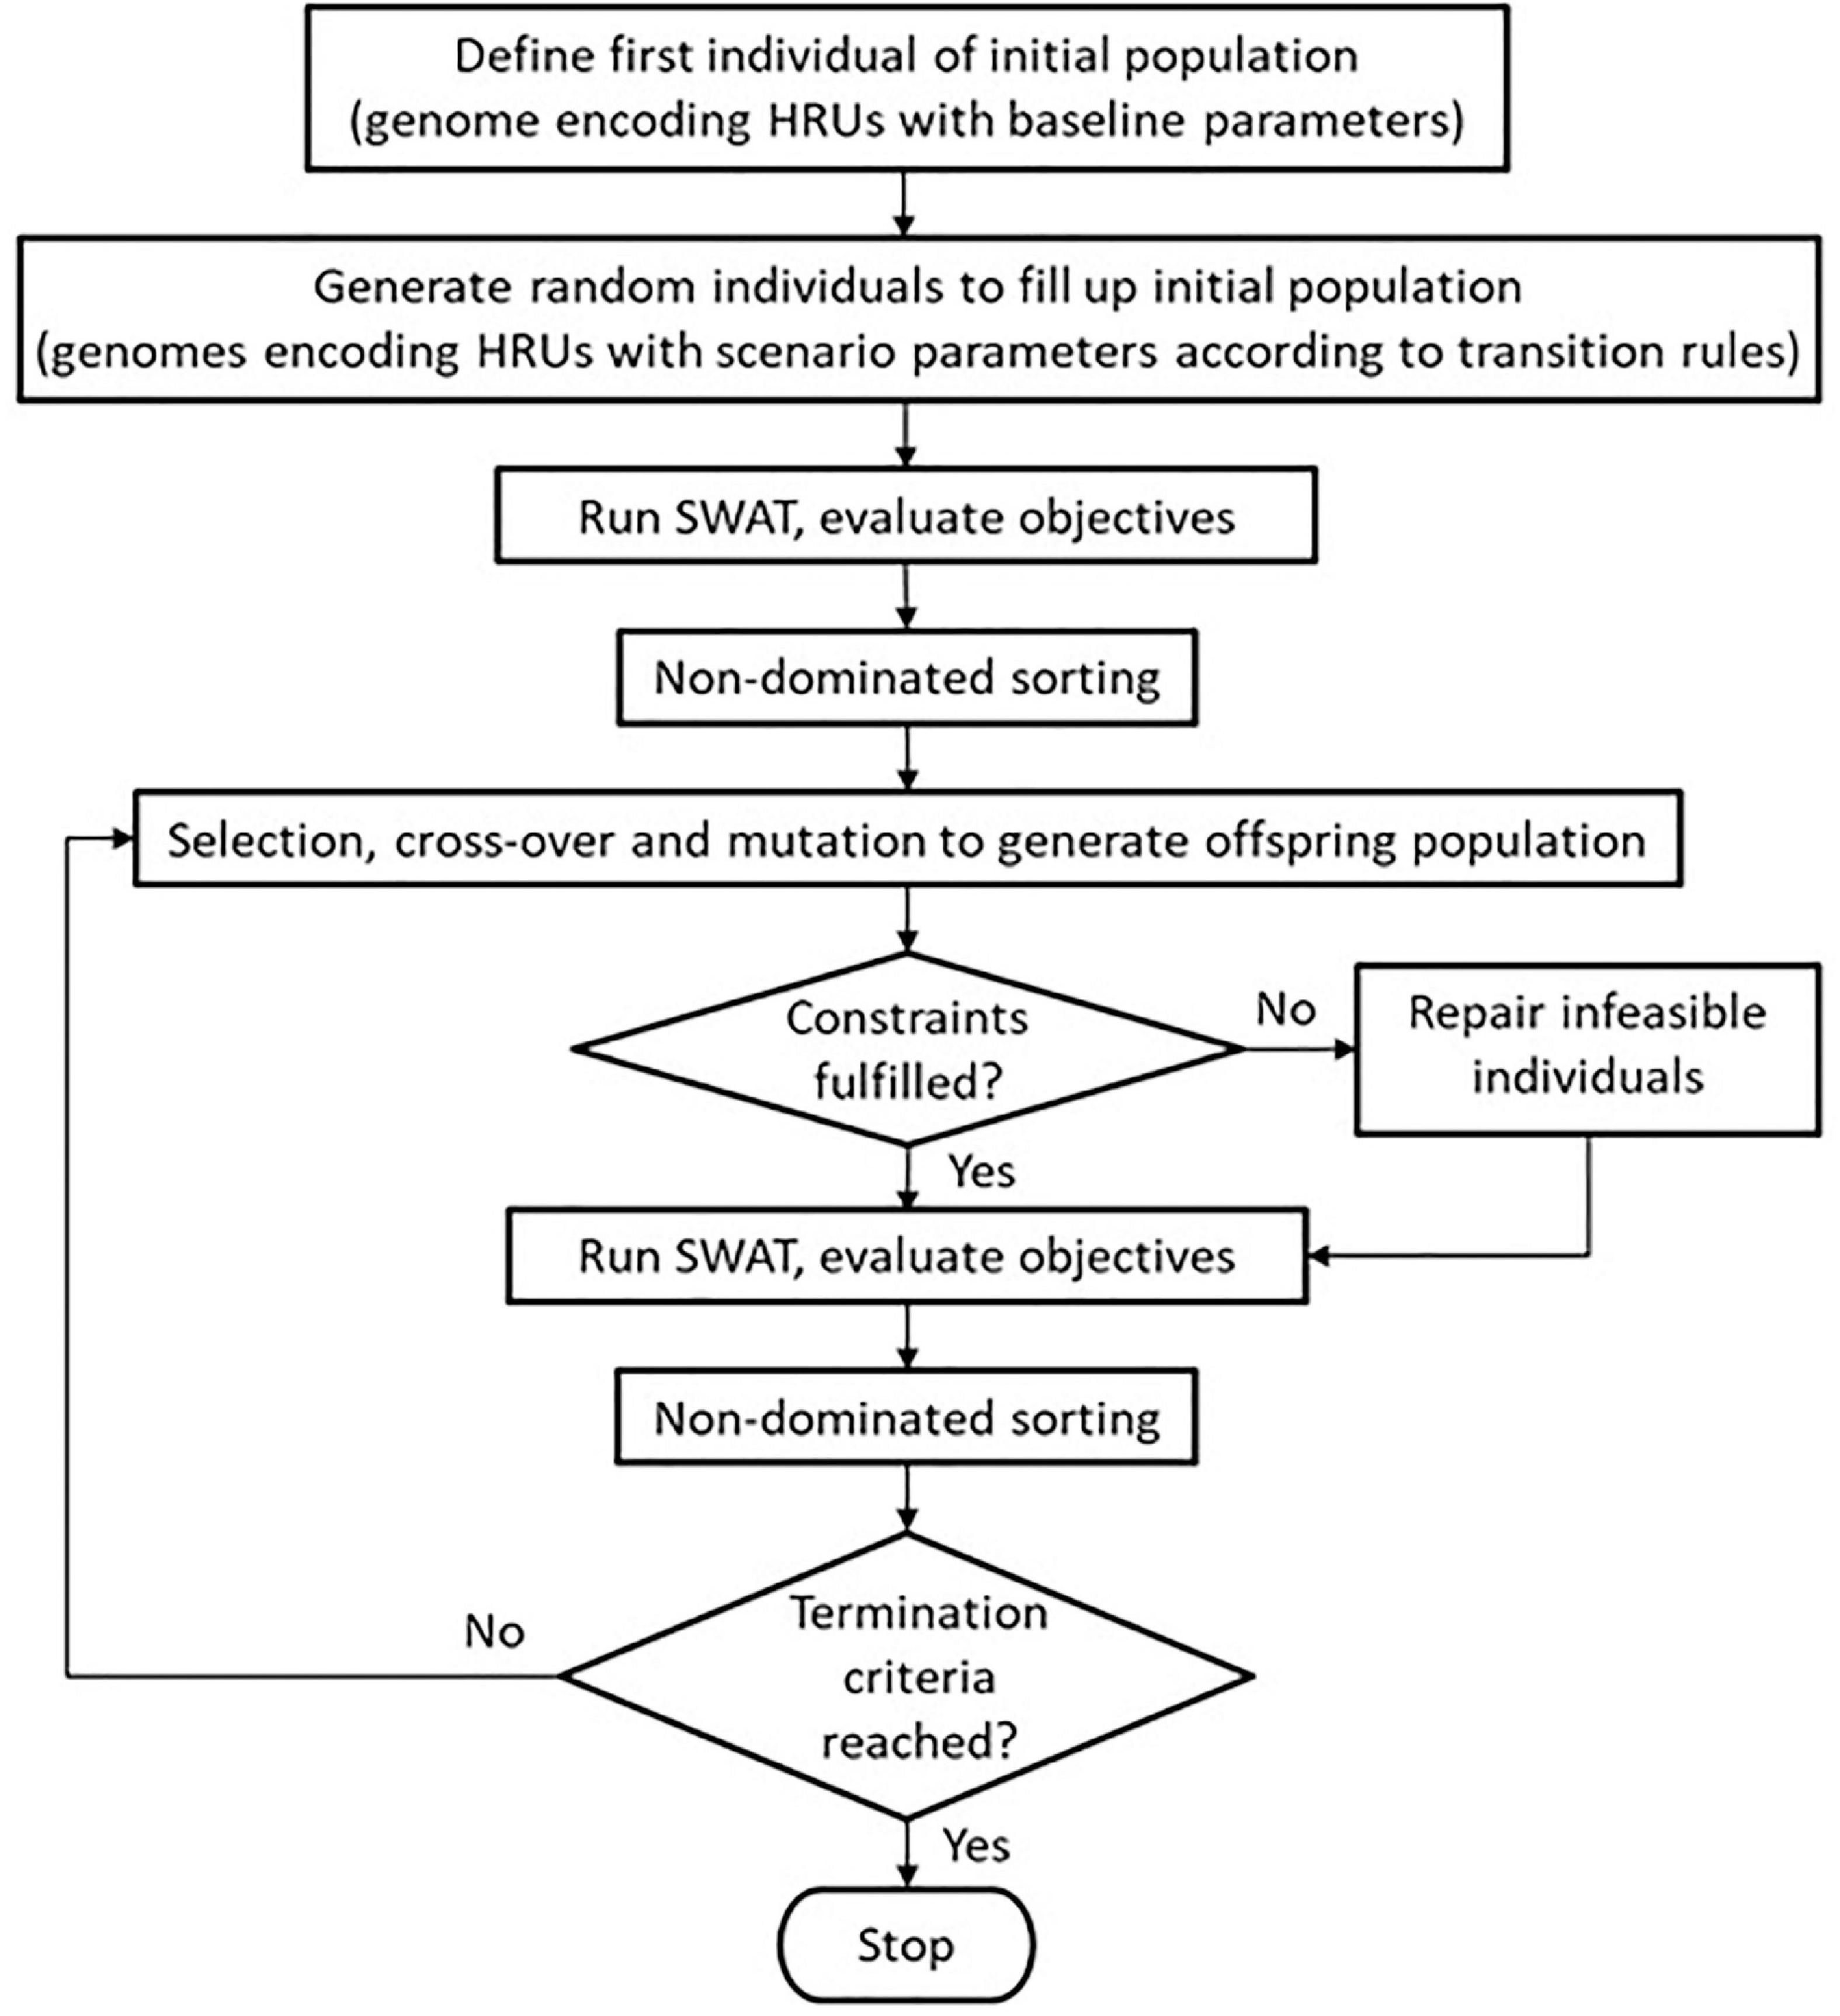
Figure 2. Flow chart of the CoMOLA optimization process for SWAT applications.
The genetic algorithm was run with a population size (PS) of 100 for a total 500 generations (M_Gen). We chose a crossover rate (CR) of 0.9 and a mutation rate (MR) of 0.01. The recommended ranges for PS and CR are (40–100) and (0.80–0.98), respectively. The MR should be set to 1/no. of genes (i.e., HRUs) within the genome of an individual (Strauch et al., 2019; Wang et al., 2019). PS defines the number of individuals (i.e., HRU configurations or SWAT model runs) per generation. M_Gen determines the number of generations over which the NSGA-II will evolve. A larger number M_Gen ensures a better convergence while a smaller number of PS may propagate premature convergence. CR drives the optimization search while the MR prevents the population from being confined in the local optima.
Lastly, in order to compare the different scenarios, the mid-range Pareto solution for each case was determined following Strauch et al. (2019). This is the numerically “best” compromise solution (i.e., the solution that is closest to the mean of each objective).
Results and discussion
Optimization within Scenario 1 considered a change from conventional agriculture to forest. The shape of the Pareto front (Figure 3) depicted a clear trade-off between the objectives crop yield and sediment load reduction. The higher the share of forests, the higher was the reduction in sediment load, but this came at the cost of less achievable crop yield. As it was only possible to change cropland to forest and not vice versa, all solutions had lower crop yields and a higher sediment load reduction compared to the status quo, which is represented by conventional agriculture in all cropland HRUs. With reference to the status quo, and at the mid-range position, Sed_ld decreased by 66%. This was accompanied by a decrease in the MAM of 5.2%. Furthermore, Mai_yld and Soy_yld production decreased by 12.8 and 11.4% respectively.
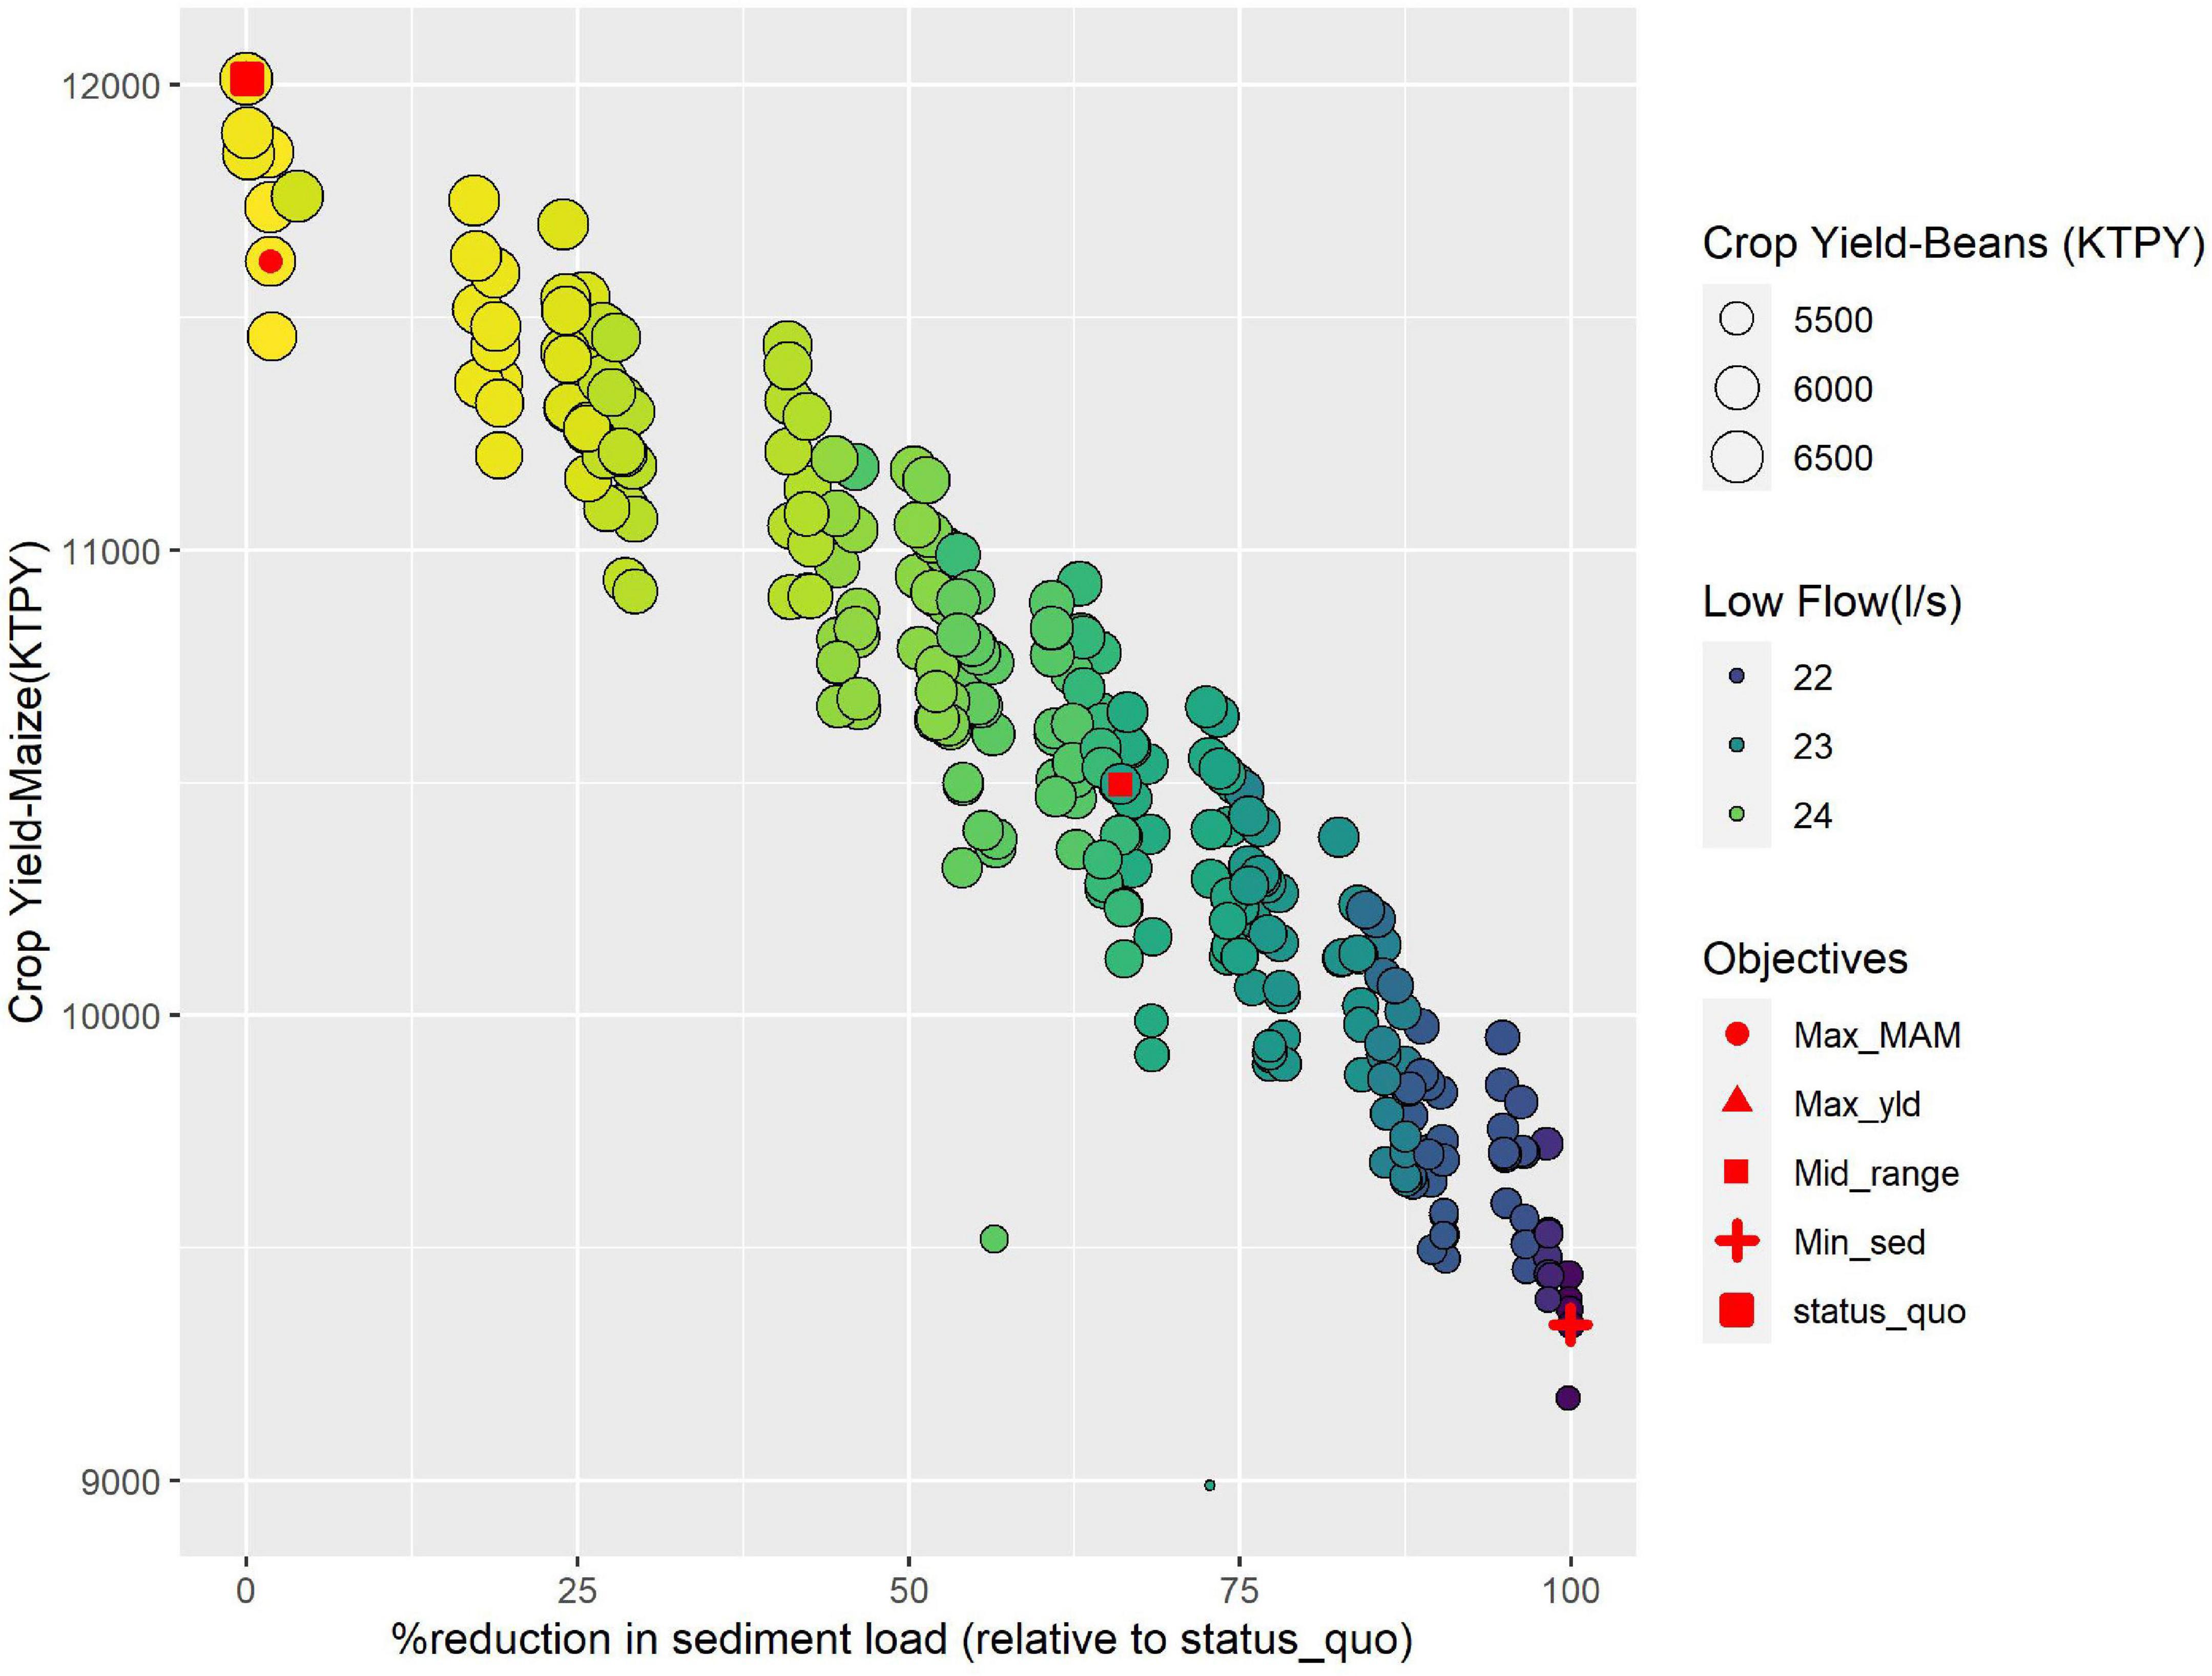
Figure 3. Performance of the pareto solutions of scenario 1 for MAM, sediment load and crop yield objective functions.
Likewise, Figure 4 illustrated a negative relationship between crop yield and Sed_ld for Scenario 2. At the mid-range position, Sed_ld decreased significantly by 78% while the MAM increased by 14%. Mai_yld and Soy_yld production decreased by 3.8 and 3.4%, respectively. Scenario 3 (Figure 5) showed a comparable loss in crop production. This also resulted in a significantly lower reduction in sediment yield reduction (−41%) and a smaller increase in the MAM (+5%). A similar trend was observed by Kennedy et al. (2016) for a catchment in Brazil. They reported a trade-off between agricultural productivity and both water quality and biodiversity using a greedy heuristic algorithm, which - unlike the genetic algorithm - progressively builds toward a global optimum solution by focusing on local optimum solutions at each stage. Similarly, Femeena et al. (2018) reported a trade-off between food and biofuel production and nutrient pollution (represented as Nitrate and Total Phosphorous). Lee and Lautenbach (2016) assessed the relationships existing among the different ecosystem services and concluded that the relationship between regulating (e.g., sediment load) and most provisioning ecosystem (maize and soybean yield) services is dominated by trade-offs, where the increase of one service happens at the expense of the other.
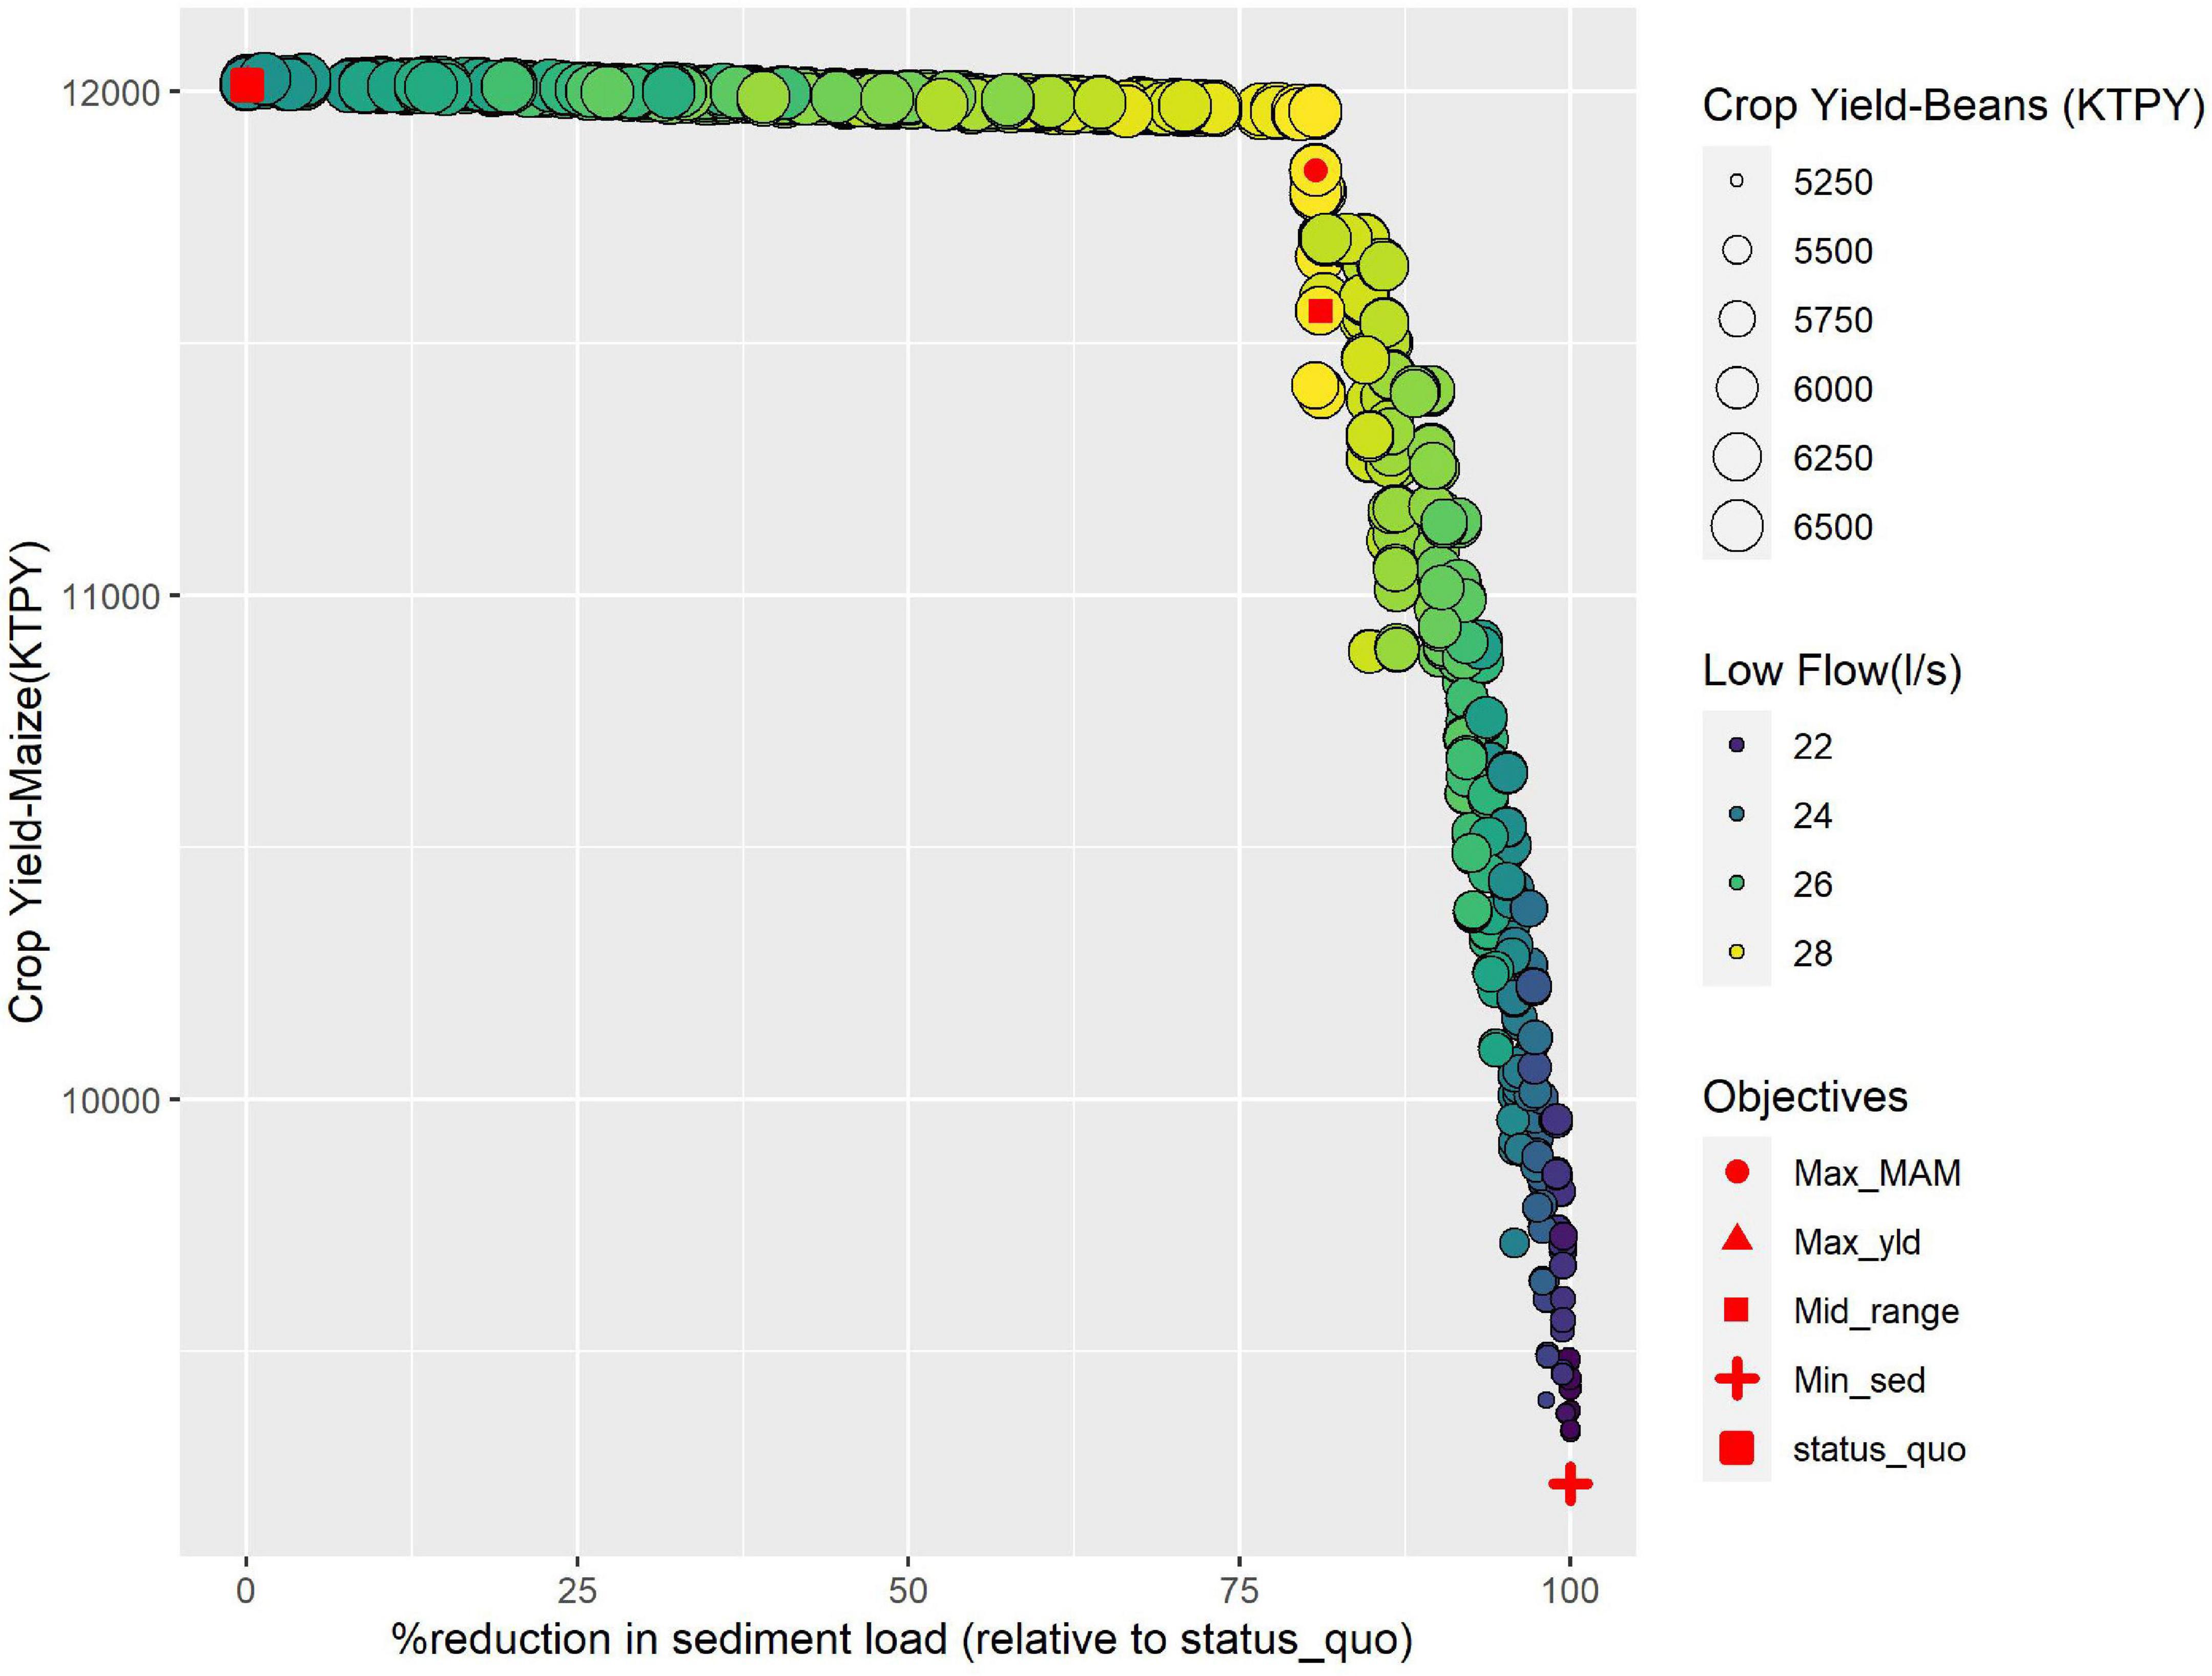
Figure 4. Performance of the pareto solutions of scenario 2 for MAM, sediment load and crop yield objective functions.
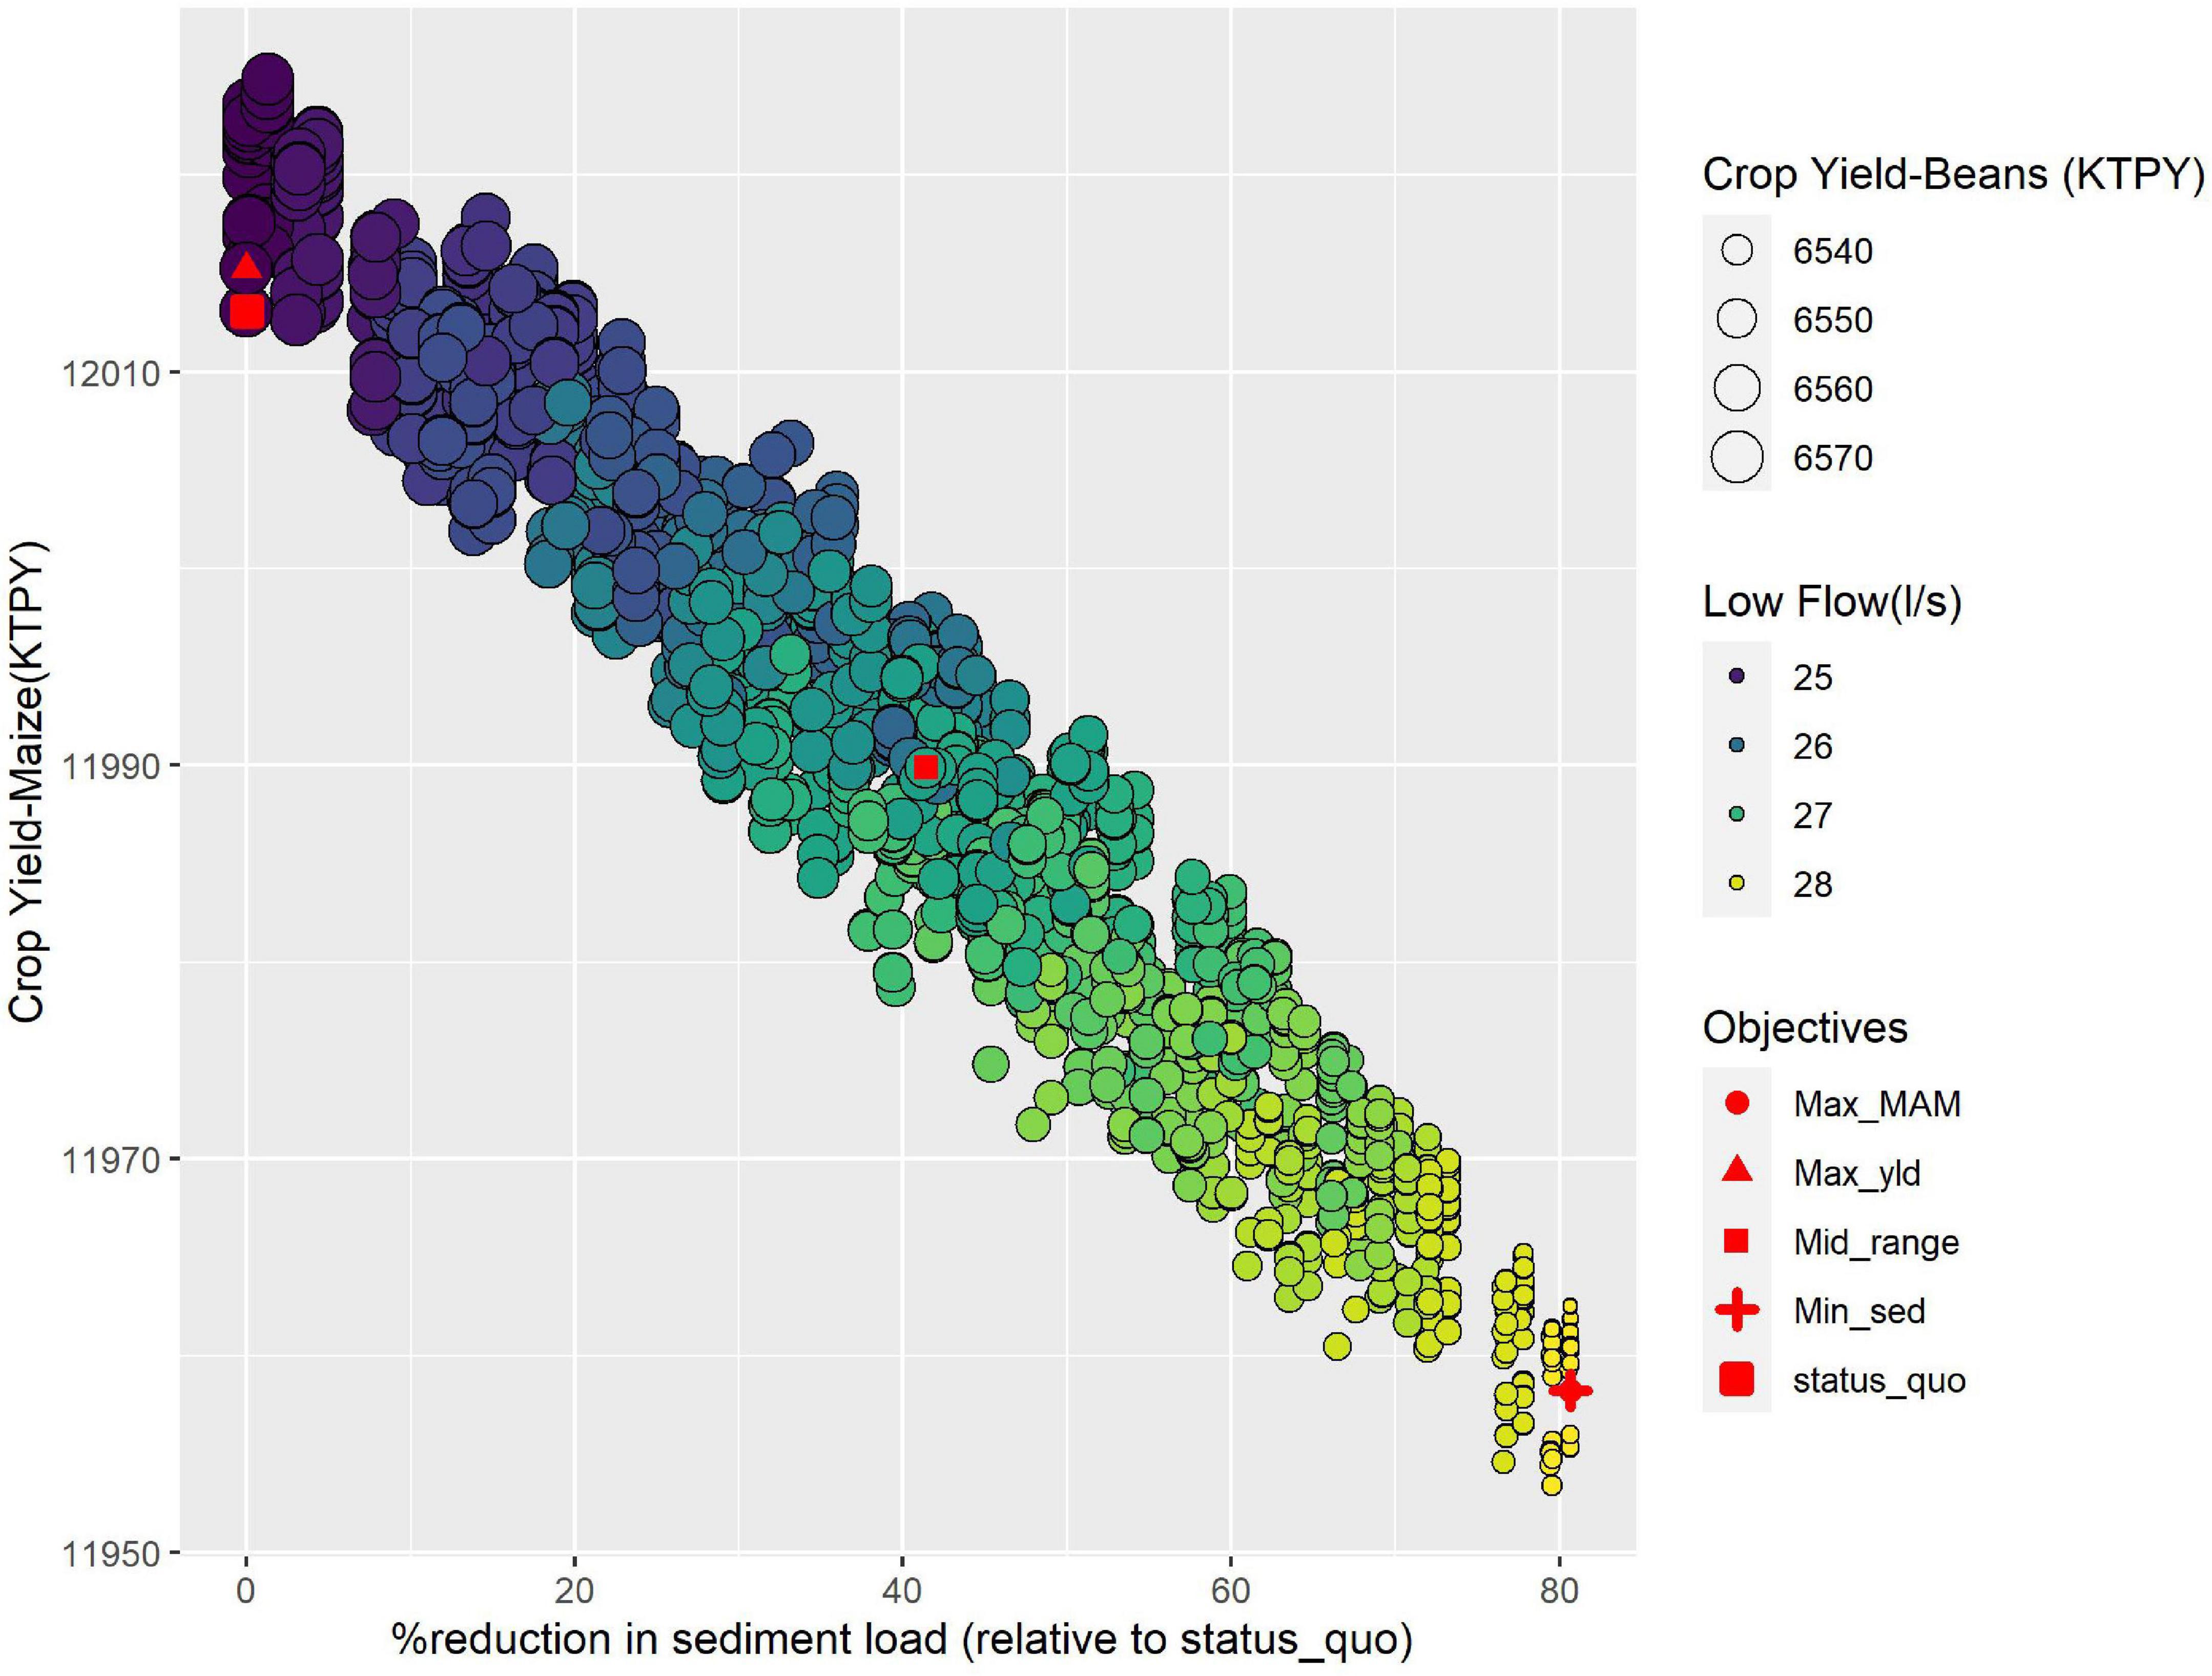
Figure 5. Performance of the pareto solutions of scenario 3 for MAM, sediment load and crop yield objective functions.
Forests (as in Scenario 1) had a high impact in reducing sediment loads but also resulted in decreased MAM, Mai_yld and Soy_yld (see Table 1). The combined use of trees and CA (Scenario 2), in contrast, not only reduced the sediment load, but also increased the MAM for a large number of solutions (all yellowish dots in Figure 4). Additionally, it led to a lower reduction in crop yield as compared to implementing each conservation measure individually, making it the most superior Scenario. In principle, forests are characterized by three primary elements that account for the distinctive movement and action of water. First, the foliage above ground forms a number of layers that compose the total thickness of the canopy. Second, the accumulation of dead and decaying plant remains on the ground surface constitute the forest floors (Reynolds et al., 1988). Both the canopy and litter intercept precipitation and modify the raindrop size and velocity. This reduces the impact of rain drop on soil surface resulting in reduced soil erosion. Last, the extensive and deeper root networks permeate the soil and are able to extract water from the soils and groundwater storages. During the dry season, the tree roots extend deeper than those of most vegetation and extract water from the groundwater storages, making it unavailable in the streams (Reynolds et al., 1988; Mwangi et al., 2016b). Nevertheless, the benefits of forests far outweigh the negative consequences. Mango et al. (2011) modeled the impact of a complete deforestation of the Nyangores catchment and conversion to agriculture. This resulted in a 31% increase in overland flow, 2% increase in evapotranspiration, >9% decrease in groundwater discharge and a 3% decrease in total water yield.
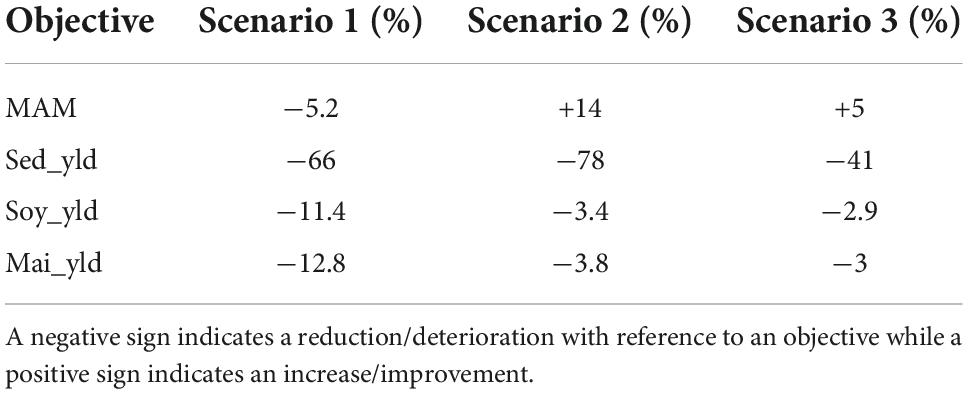
Table 1. Summary of performance of all the scenarios under the various objectives.
Contour farming (in Scenarios 2 and 3) halts surface runoff and in that increases water infiltration into the soil layers. The ridges and troughs created by contouring act as barriers to water flow, allowing it more time to infiltrate into the shallow aquifers. An increment of water in the shallow aquifer implies that this water can gradually be released during the dry season (Gathagu et al., 2018). Vegetative filter strips may allow some of the surface runoff with sediments to pass. The width of the filter strip determines the trapping efficiency. Generally, the wider the grass strip, the higher the trapping efficiency. Studies such as Gathagu et al. (2018) concluded that increasing the vegetative grass filter strip beyond 30 m increased the amount of sediment trapped by insignificant percentages while others such as Mwangi et al. (2015) recorded the highest sediment reduction within the first 3 m of filter strip width. Accordingly, the most optimum filter strip should be one that ensures the highest sediment reduction at the smallest width. The implementation of both contour farming and a 3-m filter strip had the highest impact on increasing the MAM stream low flow indicator. Unlike trees, these measures do not possess extensive roots systems which can tap into these aquifers during extended dry periods. This ensures that the water is released to the streams as base flow. In the Nyangores catchment, the small-scale farmers (who are the majority) practice hand-hoeing. Important parameters of soil loss such as the surface roughness obtained from the tillage depth are lower with hand-hoeing method as compared to mechanized tillage. Therefore, the actual soil loss in the catchment may be lower than that simulated in the study. Regardless, some studies have reported similar magnitudes using the SWAT model. For instance, Gathagu et al. (2018) concluded that the implementation of contour farming and filter strips reduced sediments by 63% in the Thika-Chania catchment in Kenya. Mwangi (2011) reported a 73% sediment load reduction for combining contour farming with a 5 m grass strip.
Most of the small-scale farming in Nyangores catchment is rain-fed and its potential remains extremely low as a result of the unsustainable farming practices and the effects of climate change (see section “Soil water assessment tool base scenario set-up”). The reduction in yield in all scenarios is a consequence of the reduction in cultivated land taken up by implementing the CMSs. But, it is expected that over time the positive effects of implementing the CMSs will result in increased crop yield. A review of the impacts of well-maintained soil and water conservation practices on crop yield by Adimassu et al. (2017) concluded that there exists a positive relationship between the age of CMSs and crop yield (although not linear). Meaning that under these conditions, the longer the time a CMS has been established, the higher the crop yield. Jat et al. (2014) reported a prominent improvement in yield after 2–3 years in a CA system when compared to a conventional tillage (CT) system of a 7 year rice-wheat system. Tanto and Laekemariam (2019) reported that adopting terracing and grass bunds CMS for 5 years increased wheat yield by 72.8% for a catchment in Southern Ethiopia. This is because, most of the CMS such as those implemented in the study are effective in: (i) reducing soil loss/increasing soil depth, (ii) reducing nutrient loss (iii), increasing moisture retention, and (iv) increasing baseflow. In view of this, the trade-off between sediment load, baseflow and crop yield need not be a major deterrent for the adoption of Scenario 2; which is the most feasible option for solving the major water quantity and quality problems while ensuring agricultural sustainability.
The mid-range output for Scenarios 1 and 2 clearly exhibits CoMOLAs tendency to allocate the different Land Use/Land Cover (LULC) in the headwater of the catchment. For Scenario 1 mid-range solution, all the HRUs that changed to forests (+8%) were located in the upper part of the catchment (see Figure 6). The upper part of the catchment has the highest elevation but not necessarily the highest slopes. Konrad (1996) reported a strong positive relationship between precipitation and elevation in mountainous regions. With orographic features enhancing precipitation, higher erosion rates are expected in the upper part of the catchment. Although Andosols (the dominant soils) are considered well aggregated, their resistance to water erosion decreases significantly when high rainfall intensities are exposed on bare/poorly maintained agricultural land. Khamsouk et al. (2002) concluded that Andosols have a high susceptibility to compaction which occurs when put under agriculture. High rainfall intensities are able to take off chunks of aggregated topsoil as a whole leading to high erosion rates. This can be confirmed by the map of sediment load (Supplementary Figure 1) which presented these areas as having the highest sediment load in the base Scenario.
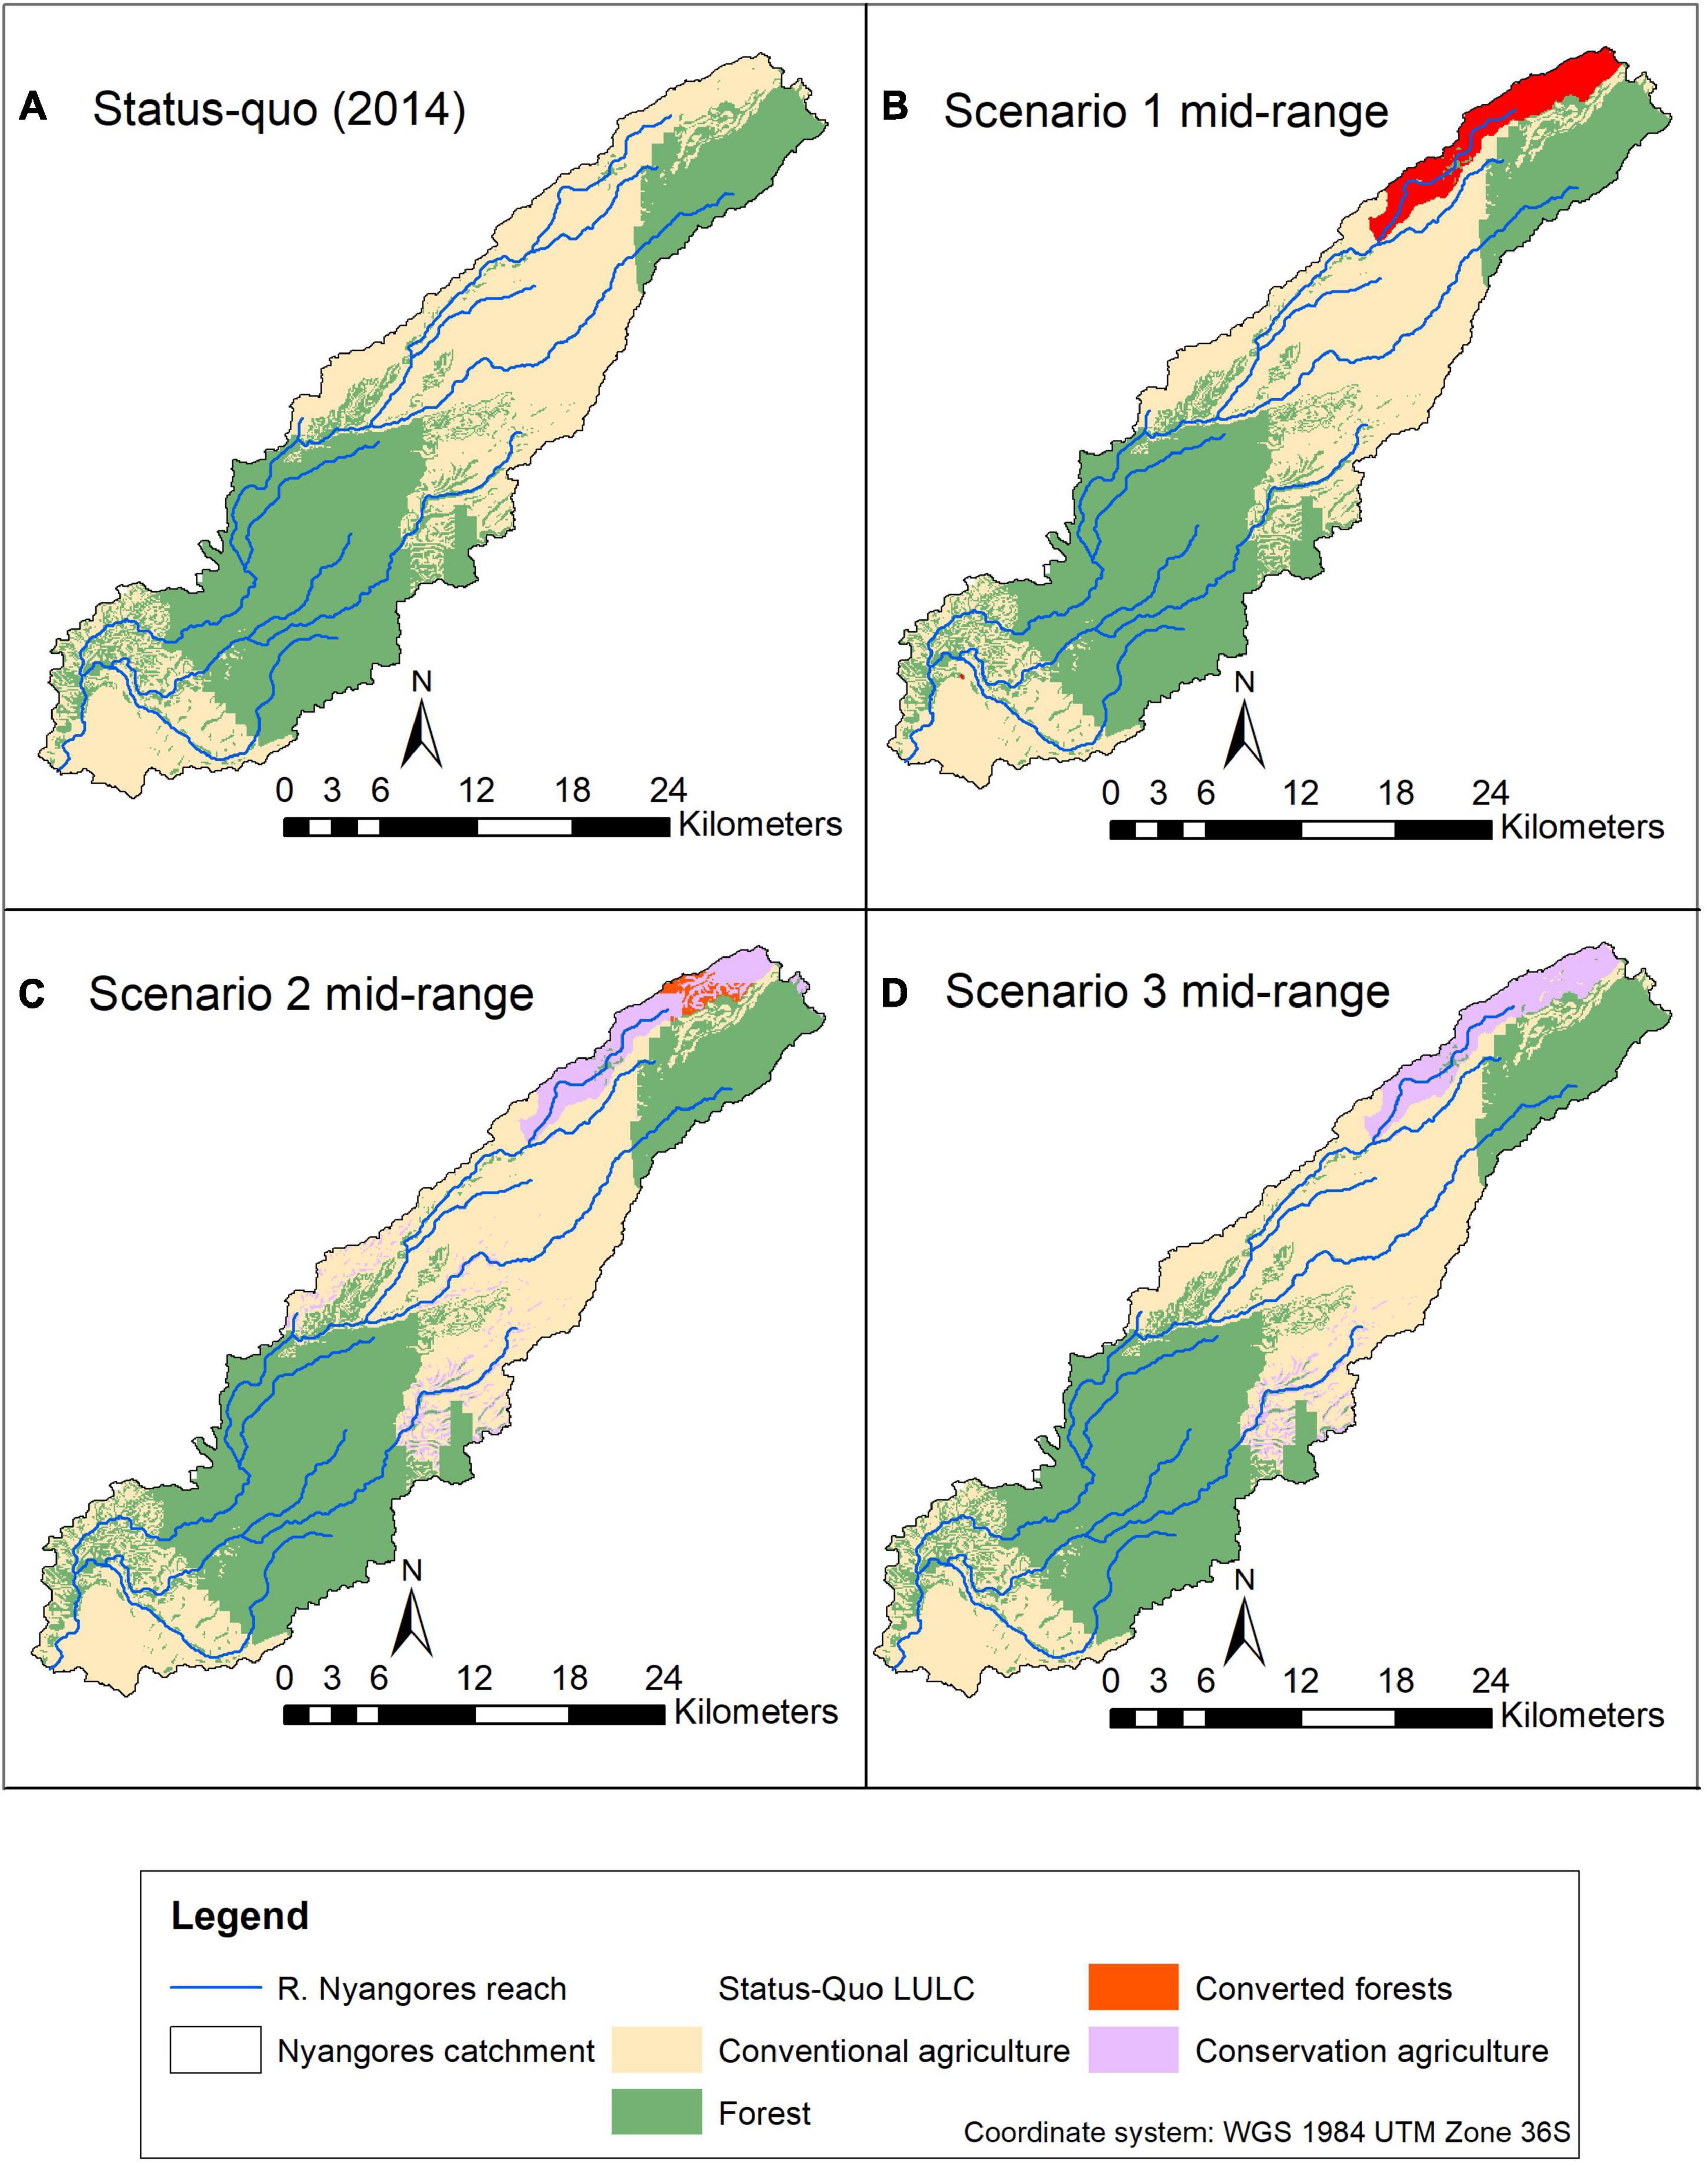
Figure 6. Spatial distribution of the different land-uses for the mid-range solution for Scenario 1 (B), Scenario 2 (C), and Scenario 3 (D), relative to the base Scenario (A).
Within Scenario 2, the change to CA (∼35%) dominated over that of forests (3.6%). This can be attributed to its effect on improving MAM while not greatly reducing the yields of maize and soybean, all of which carry equal weight in the optimization process due to Pareto ranking. With most of the upper part of the catchment already allocated to forests, the mid-range solution also displayed the tendency of CoMOLA to locate CA on the extreme ends of the mid-section of the catchment bordering the forests and in areas possessing high slopes. The latter trend was also observed within Scenario 3 where the change to CA was ∼42%. Most of the areas having high slopes in the mid-section are already under forests but there were a few still under conventional agriculture that were selected in this mid-range output. Most of the mid-section can be classified as having a slope range of between 10 and 20%, thus experiencing mostly sheet and rill erosion (Khamsouk et al., 2002). All cropland with slopes <10% (majorly the lower part) was not considered during the analysis.
It should be noted that the complete set of Pareto-optimal solutions yields a set of different land-use configurations and it is up to the stakeholders to assess and select the solution most preferred. The use of land-use optimization tools such as CoMOLA allows for easy incorporation of stakeholders. This can be done before or after the optimization process. When done before, they are imperative not only in identifying the main problems in the catchment (e.g., defining the multiple objectives) but also in designing solutions that the communities would be willing to adopt. However, including the stakeholders before the optimization process may constrain the search space for feasible solutions. This is solved by involving them in the selection of the preferred solution once the Pareto optimal solutions are reached (Lee and Lautenbach, 2016; Kaim et al., 2020). The results indicate that the Nyangores catchment represents an upstream-downstream kind of trade-off. Although incentive based measures such as payment for ecosystem services (PES) schemes remain administratively and logistically challenging (Kindu et al., 2022), they can offer a way to effect the desired changes. Since upstream changes such as forest establishment, management and adoption of CA are oriented toward positive changes in the whole catchment, the upstream land-owners can be paid by the downstream stakeholders for forgoing their normal production.
Well-designed agroforestry and CMSs should meet both ecosystems and livelihood needs (Muthee et al., 2022). For example, for agroforestry systems, potential ecosystem benefits such as; (i) water quality regulation, (ii) soil enrichment, (iii) biodiversity conservation, and (iv) carbon sequestration (Jose, 2009) must be simultaneously assessed against livelihood securities. The methodology adopted can be used to present the various ecosystem trade-offs and synergies in quantitative measures which stakeholders can use to identify solutions according to their preferences and needs. With this scientific foundation, different land-use policies can be developed and contextualized for the sustainability of any catchment.
Conclusion
In this study, the SWAT model was coupled with CoMOLA to select land-use combinations providing the smallest trade-off amongst sediment load, MAM stream low flow indicator, and the crop yield of maize and soybean. The SWAT model was run for different HRU management and land cover configurations and the outputs were assessed. The obtained results are influenced by the model parameterization which heavily depends on the quality and availability of the required data. This is often a major challenge in data-scarce areas, such as the Nyangores catchment, which are mostly in need of scientific backed research to inform decisions related to catchment management. The major limitations faced in this study were the lack of water quality data, more recent discharge data and crop yield records. This was overcome by using older data and values from literature as well as information derived from interviewing selected farmers. The calibration outputs obtained from the simulation were regarded as satisfactory. The introduced approach can be adopted for other catchments and different multi-objective problems.
The mid-range solutions of both Scenarios 1 and 2 exhibited land-use optimization preference for locating the trees in the upper part of the catchment. Scenario 2 was superior with regards to most of the ecosystem objectives as it resulted in the smallest trade-off. The Pareto-optimal solutions identified under this scenario provide different configuration options allowing for stakeholders to assess and select their most preferred solution which would achieve the highest sustainable output with the least degree of environmental degradation. Kaim et al. (2020) provided a promising example on how to involve stakeholders to select their preferred solutions from the full set of Pareto-optimal solutions. Although the reduction in crop yield could raise concerns for the communities, it must be viewed within the greater context of the nexus approach to water resource management. Water, soils and food production are interlinked and must be managed in an integrated manner. Also, in the long run, these conservation practices could elicit increased crop yield due to improved water and nutrient retention (Pooniya et al., 2021). With climate change inducing more frequent floods and droughts in the Nyangores catchment, protecting the remaining forests together with the adoption of agroforestry and other soil and conservation practices is critical not in just offsetting the excess water and sediments during floods but also ensuring water availability through groundwater recharge during the extended droughts.
Finally, this methodology can play an integral part in ensuring the sustainability of multifunctional landscapes. It provides a way to quantitatively assess multiple trade-offs of ecosystem services when adopting CMSs. It also promotes the inclusion of stakeholders which further increases the acceptance of these strategies.
Data availability statement
The original contributions presented in this study are included in the article/Supplementary material, further inquiries can be directed to the corresponding author.
Author contributions
AK, MS, HM, K-HF, JS, and SJ contributed to the conception, design, and analysis of the study. AK wrote the first draft of the manuscript. All authors contributed to manuscript revision, read, and approved the submitted version.
Funding
This work was funded by Graduate Academy, TU Dresden through the Travel Grants for Short-Term Research stays abroad and the Scholarship Program for the Promotion of Early-Career Female Scientists scholarship programs.
Conflict of interest
The authors declare that the research was conducted in the absence of any commercial or financial relationships that could be construed as a potential conflict of interest.
Publisher’s note
All claims expressed in this article are solely those of the authors and do not necessarily represent those of their affiliated organizations, or those of the publisher, the editors and the reviewers. Any product that may be evaluated in this article, or claim that may be made by its manufacturer, is not guaranteed or endorsed by the publisher.
Supplementary material
The Supplementary Material for this article can be found online at: https://www.frontiersin.org/articles/10.3389/ffgc.2022.1046371/full#supplementary-material
Supplementary Figure 1. Nyangores catchment sub-basin annual soil loss.
References
Adimassu, Z., Langan, S., Johnston, R., Mekuria, W., and Amede, T. (2017). Impacts of soil and water conservation practices on crop yield, run-off, soil loss and nutrient loss in ethiopia: review and synthesis. Environ. Manag. 59, 87–101. doi: 10.1007/s00267-016-0776-1
Arnold, J. G., Moriasi, D. N., Gassman, P. W., Abbaspour, K., White, M. J., Srinivasan, R., et al. (2012). SWAT: model use, calibration, and validation. Trans. ASABE 55, 1491–1508. doi: 10.13031/2013.42256
Asres, M. T., and Awulachew, S. B. (2010). SWAT based runoff and sediment yield modelling: a case study of the Gumera watershed in the Blue Nile basin. Ecohydrol. Hydrobiol. 10, 191–199. doi: 10.2478/v10104-011-0020-9
Atangana, A., Khasa, D., Chang, S., and Degrande, A. (2014). Tropical agroforestry. Agroforest Syst. 88, 385–385. doi: 10.1007/s10457-013-9668-z
Bajocco, S., De Angelis, A., Perini, L., Ferrara, A., and Salvati, L. (2012). The impact of land use/land cover changes on land degradation dynamics: a mediterranean case study. Environ. Manag. 49, 980–989. doi: 10.1007/s00267-012-9831-8
Bartkowski, B., Beckmann, M., Drechsler, M., Kaim, A., Liebelt, V., Müller, B., et al. (2020). Aligning Agent-Based Modeling With Multi-Objective Land-Use Allocation: Identification of Policy Gaps and Feasible Pathways to Biophysically Optimal Landscapes. Front. Environ. Sci. 8:13. doi: 10.3389/fenvs.2020.00103
Bartram, J., Ballance, R., Organization, W. H., and Programme, U. N. E. (1996). Water Quality Monitoring?: A Practical Guide to the Design and Implementation of Freshwater Quality Studies and Monitoring Programs. New York, NY: E & FN Spon. doi: 10.4324/9780203476796
Batjes, N. H. (2008). ISRIC-WISE Harmonized Global Soil Profile Dataset (Ver. 3.1). Available online at: doi: 10.13140/2.1.4306.7683 (accessed on August 21, 2020).
Boretti, A., and Rosa, L. (2019). Reassessing the projections of the World Water Development Report. npj Clean Water 2, 1–6. doi: 10.1038/s41545-019-0039-9
Borrelli, P., Robinson, D. A., Fleischer, L. R., Lugato, E., Ballabio, C., Alewell, C., et al. (2017). An assessment of the global impact of 21st century land use change on soil erosion. Nat. Commun. 8, 1–13. doi: 10.1038/s41467-017-02142-7
Cao, K., Batty, M., Huang, B., Liu, Y., Yu, L., and Chen, J. (2011). Spatial multi-objective land use optimization: extensions to the non-dominated sorting genetic algorithm-II. Int. J. Geograph. Inform. Sci. 25, 1949–1969. doi: 10.1080/13658816.2011.570269
Chapagain, A., Shimabuku, M., Morrison, J., Brill, G., Matthews, J. H., Davis, K., et al. (2021). Water Resilience Assessment Framework. Alliance for Global Water Adaptation, CEO Water Mandate, International Water Management Institute, Pacific Institute, and World Resources Institute. New York, NY: UN Global Compact.
Cohen, M. J., Brown, M. T., and Shepherd, K. D. (2006). Estimating the environmental costs of soil erosion at multiple scales in Kenya using emergy synthesis. Agricult. Ecosyst. Environ. 114, 249–269. doi: 10.1016/j.agee.2005.10.021
Deb, K., Pratap, A., Agarwal, S., and Meyarivan, T. (2002). A fast and elitist multiobjective genetic algorithm: NSGA-II. IEEE Trans. Evol. Comput. 6, 182–197. doi: 10.1109/4235.996017
EarthExplorer-USGS (2019). Available online at: https://earthexplorer.usgs.gov/ (accessed on March 10, 2020).
FAO (2011). Land & water — Food and agriculture organization of the United Nations. Available online at: https://www.fao.org/land-water/databases-and-software/crop-information/soybean/en/ (accessed November 21, 2022).
Femeena, P. V., Sudheer, K. P., Cibin, R., and Chaubey, I. (2018). Spatial optimization of cropping pattern for sustainable food and biofuel production with minimal downstream pollution. J. Environ. Manag. 212, 198–209. doi: 10.1016/j.jenvman.2018.01.060
Foley, J. A., Defries, R., Asner, G. P., Barford, C., Bonan, G., Carpenter, S. R., et al. (2005). Global consequences of land use. Science 309, 570–574. doi: 10.1126/science.1111772
Gathagu, J. N., Mourad, K. A., and Sang, J. (2018). Effectiveness of contour farming and filter strips on ecosystem services. Water 10:1312. doi: 10.3390/w10101312
Jat, R. K., Sapkota, T. B., Singh, R. G., Jat, M. L., Kumar, M., and Gupta, R. K. (2014). Seven years of conservation agriculture in a rice–wheat rotation of Eastern Gangetic Plains of South Asia: Yield trends and economic profitability. Field Crops Res. 164, 199–210. doi: 10.1016/j.fcr.2014.04.015
Jose, S. (2009). Agroforestry for ecosystem services and environmental benefits: an overview. Agroforest Syst. 76, 1–10. doi: 10.1007/s10457-009-9229-7
Kaim, A., Bartkowski, B., Lienhoop, N., Schröter-Schlaack, C., Volk, M., and Strauch, M. (2021). Combining biophysical optimization with economic preference analysis for agricultural land-use allocation. Ecol. Soc. 26:9. doi: 10.5751/ES-12116-260109
Kaim, A., Cord, A. F., and Volk, M. (2018). A review of multi-criteria optimization techniques for agricultural land use allocation. Environ. Model. Softw. 105, 79–93. doi: 10.1016/j.envsoft.2018.03.031
Kaim, A., Strauch, M., and Volk, M. (2020). Using stakeholder preferences to identify optimal land use configurations. Front. Water 2:579087. doi: 10.3389/frwa.2020.579087
Kamamia, A. W., Mwangi, H. M., Feger, K.-H., and Julich, S. (2019). Assessing the impact of a multimetric calibration procedure on modelling performance in a headwater catchment in Mau Forest, Kenya. J. Hydrol. Region. Stud. 21, 80–91. doi: 10.1016/j.ejrh.2018.12.005
Kamamia, A. W., Vogel, C., Mwangi, H. M., Feger, K. H., Sang, J., and Julich, S. (2021). Mapping soil aggregate stability using digital soil mapping: A case study of Ruiru reservoir catchment, Kenya. Geoderma Reg. 24:e00355. doi: 10.1016/j.geodrs.2020.e00355
Kamamia, A. W., Vogel, C., Mwangi, H. M., Feger, K., Sang, J., and Julich, S. (2022). Using soil erosion as an indicator for integrated water resources management: a case study of Ruiru drinking water reservoir, Kenya. Environ. Earth Sci. 81:502. doi: 10.1007/s12665-022-10617-0
Kennedy, C. M., Hawthorne, P. L., Miteva, D. A., Baumgarten, L., Sochi, K., Matsumoto, M., et al. (2016). Optimizing land use decision-making to sustain Brazilian agricultural profits, biodiversity and ecosystem services. Biol. Conserv. 204, 221–230. doi: 10.1016/j.biocon.2016.10.039
Khamsouk, B., De, G., and Benali, I. (2002). “New data concerning erosion processes and soil management on andosols from ecuador and martinique,” in Proceeding of the Sustainable Utilization of Global Soil and Water Resources: 2. Process of soil erosion and its environnment effect, International Soil Conservation Organisation Conference. Pékin: Tsinghua University.
Kindu, M., Mai, T. L. N., Bingham, L. R., Borges, J. G., Abildtrup, J., and Knoke, T. (2022). Auctioning approaches for ecosystem services – Evidence and applications. Sci. Total Environ. 853:158534. doi: 10.1016/j.scitotenv.2022.158534
Kiragu, G. M. (2009). Assessment of Suspended Sediment Loadings and Their Impact on the Environmental Flows of the Upper Transboundary Mara River, Kenya. Kenya: JKUAT.
Kirschke, S., Zhang, L., and Meyer, K. (2018). Decoding the wickedness of resource nexus problems—examples from water-soil nexus problems in China. Resources 7:67. doi: 10.3390/resources7040067
Kogo, B. K., Kumar, L., and Koech, R. (2020). Impact of land use/cover changes on soil erosion in western Kenya. Sustainability 12:9740. doi: 10.3390/su12229740
Konrad, C. E. II (1996). Relationships between precipitation event types and topography in the southern blue ridge mountains of the southeastern USA. Int. J. Climatol. 16, 49–62. doi: 10.1002/(SICI)1097-0088(199601)16:1<49::AID-JOC993>3.0.CO;2-D
Lautenbach, S., Volk, M., Strauch, M., Whittaker, G., and Seppelt, R. (2013). Optimization-based trade-off analysis of biodiesel crop production for managing an agricultural catchment. Environ. Model. Softw. 48, 98–112. doi: 10.1016/j.envsoft.2013.06.006
Lee, H., and Lautenbach, S. (2016). A quantitative review of relationships between ecosystem services. Ecol. Indic. 66, 340–351. doi: 10.1016/j.ecolind.2016.02.004
Legesse, D., Vallet-Coulomb, C., and Gasse, F. (2003). Hydrological response of a catchment to climate and land use changes in Tropical Africa: case study South Central Ethiopia. J. Hydrol. 275, 67–85. doi: 10.1016/S0022-1694(03)00019-2
Liniger, H. P., Cahill, D., Critchley, W., van Lynden, G. W. J., and Schwilch, G. (2002). Categorization of SWC Technologies and Approaches. Beijing: YUMPU.
Mango, L. M., Melesse, A. M., McClain, M. E., Gann, D., and Setegn, S. G. (2011). Land use and climate change impacts on the hydrology of the upper Mara River Basin, Kenya. Hydrol. Earth Syst. Sci. 15, 2245–2258. doi: 10.5194/hess-15-2245-2011
Mati, B. M., Mutie, S., Gadain, H., Home, P., and Mtalo, F. (2008). Impacts of land-use/cover changes on the hydrology of the transboundary Mara River, Kenya/Tanzania. Lakes Reserv. Sci. Policy Manag. Sustain. Use 13, 169–177. doi: 10.1111/j.1440-1770.2008.00367.x
Memarian, H., Balasundram, S. K., Abbaspour, K. C., Talib, J. B., Boon Sung, C. T., and Sood, A. M. (2014). SWAT-based hydrological modelling of tropical land-use scenarios. Hydrol. Sci. J. 59, 1808–1829. doi: 10.1080/02626667.2014.892598
Moriasi, D. N., Arnold, J. G., Van Liew, M. W., Bingner, R. L., Harmel, R. D., and Veith, T. L. (2007). Model evaluation guidelines for systematic quantification of accuracy in watershed simulations. Trans. ASABE 50, 885–900. doi: 10.13031/2013.23153
Mulinge, W., Gicheru, P., Murithi, F., Maingi, P., Kihiu, E., Kirui, O. K., et al. (2016). “Economics of land degradation and improvement in Kenya,” in Economics of Land Degradation and Improvement – A Global Assessment for Sustainable Development, eds E. Nkonya, A. Mirzabaev, and J. von Braun (Cham: Springer International Publishing), 471–498. doi: 10.1007/978-3-319-19168-3_16
Munialo, S., Dahlin, A. S., Maa, C. O., Oluoch-Kosura, W., Marstorp, H., and Öborn, I. (2020). Soil and management-related factors contributing to maize yield gaps in western Kenya. Food Energy Secur. 9:e189. doi: 10.1002/fes3.189
Muthee, K., Duguma, L., Majale, C., Mucheru-Muna, M., Wainaina, P., and Minang, P. (2022). A quantitative appraisal of selected agroforestry studies in the Sub-Saharan Africa. Heliyon 8, e10670. doi: 10.1016/j.heliyon.2022.e10670
Mwangi, H. M. (2011). Evaluation of the Impacts of Soil and Water Conservation Practices on Ecosystem Services in Sasumua Watershed, Kenya, using SWAT Model. JKUAT Abstracts of PostGraduate Thesis, Jomo Kenyatta University, Kenya.
Mwangi, H. M., Julich, S., Patil, S. D., McDonald, M. A., and Feger, K.-H. (2016a). Modelling the impact of agroforestry on hydrology of Mara River Basin in East Africa. Hydrol. Proces. 30, 3139–3155. doi: 10.1002/hyp.10852
Mwangi, H. M., Julich, S., Patil, S. D., McDonald, M. A., and Feger, K.-H. (2016b). Relative contribution of land use change and climate variability on discharge of upper Mara River, Kenya. J. Hydrol. Region. Stud. 5, 244–260. doi: 10.1016/j.ejrh.2015.12.059
Mwangi, J. K., Shisanya, C. A., Gathenya, J. M., Namirembe, S., and Moriasi, D. N. (2015). A modeling approach to evaluate the impact of conservation practices on water and sediment yield in Sasumua Watershed, Kenya. J. Soil Water Conserv. 70, 75–90. doi: 10.2489/jswc.70.2.75
Mwangi, K., Musili, A. M., Otieno, V. A., Endris, H. S., Sabiiti, G., Hassan, M. A., et al. (2020). Vulnerability of Kenya’s water towers to future climate change: an assessment to inform decision making in watershed management. Am. J. Clim. Change 9, 317–353. doi: 10.4236/ajcc.2020.93020
Nair, P. K. R., Kumar, B. M., and Nair, V. D. (2021). “Classification of agroforestry systems,” in An Introduction to Agroforestry: Four Decades of Scientific Developments, eds P. K. R. Nair, B. M. Kumar, and V. D. Nair (Cham: Springer International Publishing), 29–44. doi: 10.1007/978-3-030-75358-0_3
Neitsch, S. L., Arnold, J. G., Kiniry, J. R., and Williams, J. R. (2011). Soil and Water Assessment Tool Theoretical Documentation Version 2009. Texas: Texas Water Resources Institute.
Ngome, A., Becker, M., Mtei, K., and Mussgnug, F. (2013). Maize productivity and nutrient use efficiency in Western Kenya as affected by soil type and crop management. Int. J. Plant Product. 7, 517–536.
Omonge, P., Herrnegger, M., Gathuru, G., Fürst, J., and Olang, L. (2020). Impact of development and management options on water resources of the upper Mara River Basin of Kenya. Water Environ. J. 34, 644–655. doi: 10.1111/wej.12554
Panagopoulos, Y., Makropoulos, C., and Mimikou, M. (2012). Decision support for diffuse pollution management. Environ. Model. Softw. 30, 57–70. doi: 10.1016/j.envsoft.2011.11.006
Pooniya, V., Zhiipao, R. R., Biswakarma, N., Jat, S. L., Kumar, D., Parihar, C. M., et al. (2021). Long-term conservation agriculture and best nutrient management improves productivity and profitability coupled with soil properties of a maize–chickpea rotation. Sci. Rep. 11:10386. doi: 10.1038/s41598-021-89737-9
Reynolds, E. R. C., Thompson, F. B., and University, U. N. (1988). Forests, Climate, and Hydrology. Tokyo: United Nations University.
Rodriguez, H. G., Popp, J., Maringanti, C., and Chaubey, I. (2011). Selection and placement of best management practices used to reduce water quality degradation in Lincoln Lake watershed. Water Resour. Res. 47:141. doi: 10.1029/2009WR008549
Schmitz, T., and Kihara, F. (2021). “Investing in ecosystems for water security: the case of the Kenya water towers,” in The Palgrave Handbook of Climate Resilient Societies, ed. R. C. Brears (Cham: Springer International Publishing), 117–135. doi: 10.1007/978-3-030-42462-6_23
Schwarz, N., Hoffmann, F., Knapp, S., and Strauch, M. (2020). Synergies or Trade-Offs? optimizing a virtual urban region to foster plant species richness, climate regulation, and compactness under varying landscape composition. Front. Environ. Sci. 8:16. doi: 10.3389/fenvs.2020.00016
Seppelt, R., Lautenbach, S., and Volk, M. (2013). Identifying trade-offs between ecosystem services, land use, and biodiversity: a plea for combining scenario analysis and optimization on different spatial scales. Curr. Opin. Environ. Sustain. 5, 458–463. doi: 10.1016/j.cosust.2013.05.002
Speranza, C. I. (2010). Resilient Adaptation to Climate Change in African Agriculture. Bonn: Deutsches Institut für Entwicklungspolitik.
Strauch, M., Cord, A. F., Pätzold, C., Lautenbach, S., Kaim, A., Schweitzer, C., et al. (2019). Constraints in multi-objective optimization of land use allocation – Repair or penalize? Environ. Model. Softw. 118, 241–251. doi: 10.1016/j.envsoft.2019.05.003
Strauch, M., and Volk, M. (2013). SWAT plant growth modification for improved modeling of perennial vegetation in the tropics. Ecol. Model. 269, 98–112. doi: 10.1016/j.ecolmodel.2013.08.013
Tanto, T., and Laekemariam, F. (2019). Impacts of soil and water conservation practices on soil property and wheat productivity in Southern Ethiopia. Environ. Syst. Res. 8:13. doi: 10.1186/s40068-019-0142-4
Verhagen, W., van der Zanden, E. H., Strauch, M., van Teeffelen, A. J. A., and Verburg, P. H. (2018). Optimizing the allocation of agri-environment measures to navigate the trade-offs between ecosystem services, biodiversity and agricultural production. Environ. Sci. Policy 84, 186–196. doi: 10.1016/j.envsci.2018.03.013
Wang, Q., Wang, L., Huang, W., Wang, Z., Liu, S., and Savić, D. A. (2019). Parameterization of NSGA-II for the optimal design of water distribution systems. Water 11:971. doi: 10.3390/w11050971
Wicki, S., Schwaab, J., Perhac, J., and Grêt-Regamey, A. (2021). Participatory multi-objective optimization for planning dense and green cities. J. Environ. Plan. Manag. 64, 1–22. doi: 10.1080/09640568.2021.1875999
Witing, F., Forio, M. A. E., Burdon, F. J., Mckie, B., Goethals, P., Strauch, M., et al. (2022). Riparian reforestation on the landscape scale: Navigating trade-offs among agricultural production, ecosystem functioning and biodiversity. J. Appl. Ecol. 59, 1456–1471. doi: 10.1111/1365-2664.14176
WOCAT (2007). Where the Land is Greener: Case Studies and Analysis of Soil and Water Conservation Initiatives Worldwide (2007). Switzerland: WOCAT.
World Agroforestry (2021). What is Agroforestry? World Agroforestry | Transforming Lives and Landscapes with Trees. Available online at: https://www.worldagroforestry.org/about/agroforestry (accessed on September 22, 2021).
WRUA (2011). Nyangores River Sub-Catchment Management Plan. Available online at: http://dpanther.fiu.edu/sobek/FIMA000012/00001 (accessed on October 25, 2022).
Keywords: sustainability, multi-objectives, ecosystem services, agroforestry, sediment load, CoMOLA, Pareto optimization, land-use configurations
Citation: Kamamia AW, Strauch M, Mwangi HM, Feger K-H, Sang J and Julich S (2022) Modelling crop production, river low flow, and sediment load trade-offs under agroforestry land-use scenarios in Nyangores catchment, Kenya. Front. For. Glob. Change 5:1046371. doi: 10.3389/ffgc.2022.1046371
Received: 16 September 2022; Accepted: 15 November 2022;
Published: 05 December 2022.
Edited by:
Mehebub Sahana, Manchester University, United StatesReviewed by:
Mohamed Kefi, Centre de Recherches et des Technologies des Eaux, TunisiaMohammad Arif, Central University of Jharkhand, India
Anil Kumar Singh, Academy of Scientific and Innovative Research (AcSIR), India
Copyright © 2022 Kamamia, Strauch, Mwangi, Feger, Sang and Julich. This is an open-access article distributed under the terms of the Creative Commons Attribution License (CC BY). The use, distribution or reproduction in other forums is permitted, provided the original author(s) and the copyright owner(s) are credited and that the original publication in this journal is cited, in accordance with accepted academic practice. No use, distribution or reproduction is permitted which does not comply with these terms.
*Correspondence: Ann W. Kamamia, ann.kamamia@mailbox.tu-dresden.de