 Maximiliane Thron1*
 Alexander Woll1
 Leon Klos1Sascha Härtel2Ludwig Ruf3Christian Kloss2
 Stefan Altmann1,3
- 1Institute of Sports and Sports Science, Karlsruhe Institute of Technology, Karlsruhe, Germany
- 2TSG 1899 Hoffenheim, Zuzenhausen, Germany
- 3TSG ResearchLab GGmbH, Zuzenhausen, Germany
Introduction: Maximal aerobic speed (MAS), usually measured by cardiopulmonary exercise testing (CPET) on a treadmill, is gaining popularity in soccer to determine aerobic performance. Several field tests are used to estimate MAS, although, gold standard methods are still not clarified. Therefore, this work aims 1) to compare two different CPET based methods to assess MAS and 2) to investigate the convergent validity of two common field tests to estimate MAS in soccer.
Methods: Thirteen trained male soccer players completed an CPET on a treadmill to determine two VO2-kinetic based definitions of MAS (MASPlateau = speed at onset of VO2-plateau = gold standard; MAS30s = first speed of 30-s-interval of VO2max), the Université de Montreal Track Test (UMTT; VUMTT = speed of the last stage), and a 1500-m-time trial (1500-m-TT; V1500m = average speed). MASPlateau, MAS30s, VUMTT, and V1500m were compared using ANOVA. Additionally, limits of agreement analysis (LoA), Pearson’s r, and ICC were calculated between tests.
Results: MAS30s, VUMTT, and V1500m significantly overestimated MASPlateau by 0.99 km/h (ES = 1.61; p < 0.01), 1.61 km/h (ES = 2.03; p < 0.01) and 1.68 km/h (ES = 1.77; p < 0.01), respectively, with large LoA (-0.21 ≤ LoA≤3.55), however with large-to-very large correlations (0.65 ≤ r ≤ 0.87; p ≤ 0.02; 0.51 ≤ ICC≤ 0.85; p ≤ 0.03).
Discussion: The overestimation and large LoA of MASPlateau by all estimates indicate that 1) a uniform definition of MAS is needed and 2) the UMTT and a 1500-m-TT seem questionable for estimating MAS for trained soccer players on an individual basis, while regression equations might be suitable on a team level. The results of the present work contribute to the clarification of acquisition of MAS in soccer.
Introduction
Given the high cardiorespiratory demands during a soccer match, in which professional players cover a distance up to 13 km, assessment of endurance performance with subsequent individual training prescription seems indispensable (Tanner and Gore, 2012; Altmann et al., 2020). Aerobic performance is often assessed by measuring the maximum oxygen uptake (VO2max). In soccer, VO2max is significantly related to the distance covered during a match and reflects aerobic capacity (Bangsbo et al., 1991; Aquino et al., 2020). The VO2max is commonly assessed by cardiopulmonary exercise testing (CPET) on a treadmill with incremental protocols (Kuipers et al., 2003; Riboli et al., 2021). A criterion for obtaining the true VO2max in such tests is the occurrence of a VO2-plateau which is defined by a lower increase in VO2 than 150 ml/min in at least the last minute of an incremental exercise (Meyer and Kindermann, 1999). Then, VO2max is defined as the maximal 30-s-interval of VO2 during an incremental CPET usually occurring at the termination of the test due to exhaustion. However, while being mainly an aerobic marker, VO2max is reached with efforts above the onset of the plateau associated with a higher input of anaerobic resources (Billat and Koralsztein, 1996). Therefore, the way VO2max is commonly measured, it incorporates not only aerobic but to some extent also anaerobic resources. Importantly, the anaerobic contribution can largely differ between athletes. This leads to different lengths of the VO2-plateau until exhaustion is reached, thereby distinguishing between athletes depending on their utilization of anaerobic resources. More specifically, athletes mainly relying on aerobic resources show a short VO2-plateau, whereby athletes using a greater amount of anaerobic resources display a longer plateau (Petot et al., 2012). As the velocity associated with the 30-s-interval of VO2max is commonly used for prescribing training intensities, it might trigger the aerobic and anaerobic energy pathways to different extents depending on the physiological profile of the respective athlete possibly leading to a non-optimal training adaptation. A parameter that addresses the mentioned shortcomings of VO2max is the maximal aerobic speed (MAS) which has recently gained popularity in scientific literature and practice. The MAS was firstly described by Di Prampero et al. (1986) as the minimum speed at which VO2-consumption stops increasing despite a further increase in load, i.e., the onset of the VO2-plateau, in the current study referred to as MASPlateau. Based on MASPlateau, training intensities aiming to address mainly aerobic resources to the same extent for different athletes can be set. CPET on a treadmill is used as a gold standard method to assess MAS. Nevertheless, different treadmill protocols and definitions of MAS exist, which also provide different results (Berthoin et al., 1996; Billat et al., 1996; Riboli et al., 2021). Besides MASPlateau, the velocity of the 30-s-interval of VO2max (MAS30s) is often applied as an alternative method to assess MAS (Buchheit, 2008; Sandford et al., 2019). However, to date, no studies compared the currently most common definitions based on examination of VO2-kinetics, i.e., first velocity at onset of VO2-plateau (MASPlateau) and the first velocity of 30-s-interval of VO2max (MAS30s).
Despite ambiguities in the gold standard method, simplified methods in the field are used to estimate MAS, such as incremental continuous field tests like Université de Montréal Track Test (UMTT) or different set time and distance trials (TT) (Léger and Boucher, 1980; Léger et al., 1988; Bangsbo et al., 2008; Clarke et al., 2016; Sandford et al., 2019). In terms of the validity of the UMTT, Berthoin et al. (1996) and Souza et al. (2014) could not find any significant differences between MAS and VUMTT, whereas Lacour et al. (1991) revealed an overestimation of MAS by VUMTT. Regarding set distance time trials to assess MAS, the current literature also reveals conflicting results. Set distance TT yielded similar results (Souza et al., 2014; Bellenger et al., 2015; Lundquist et al., 2021) or overestimated MAS and VUMTT (Sandford et al., 2019; Darendeli et al., 2021). Due to contrary results in the current literature on field tests to estimate MAS, Buchheit (2010) proposed to distinguish the results obtained from CPET, from those obtained from field tests by designating the values obtained from CPET as MAS and the estimates from a field test as VTest. This reinforces the importance of reporting exact definitions and methods. Furthermore, most of the above-mentioned studies were conducted with runners and sports students, which does not allow for a clear conclusion about soccer.
To address these shortcomings, the aims of this study were 1) to compare two different VO2-kinetic based methods, i.e., first velocity at onset of VO2-plateau (MASPlateau) and first velocity of 30-s-interval of VO2max (MAS30s), using CPET on a treadmill, and 2) to investigate convergent validity of both the UMTT and a 1500-m-TT in relation to a VO2-kinetic based MAS, i.e. MASPlateau, in soccer. Thus, this work contributes to clarify the implementation of the gold standard method for assessing MAS in soccer and whether the assessment can be simplified by the UMTT or a 1500-m-TT.
Materials and methods
Study design
Thirteen trained male soccer players performed three tests at three different occasions, with a minimum of seven and a maximum of 21 days between the tests and a training rest of at least 24 h before each test. Tests were conducted in the same order for all participants: 1) UMTT on a 400-m-running track, 2) CPET on a treadmill, and 3) a 1500-m-TT on a 400-m-running track. During the incremental treadmill test, MASPlateau [km/h] and MAS30s [km/h] were determined by examining the VO2-kinetics. Moreover, the main parameters measured during field testing were: VUMTT [km/h], V1500m [km/h], and Vcalc [km/h]. MAS30s, VUMTT, V1500m, and Vcalc were compared to MASPlateau which is considered as the gold standard method in the current study.
Sample
The sample consisted of n = 13 trained male soccer players classified as tier two athletes (Mckay et al., 2022) (mean ± SD: age: 25.38 ± 2.75 years; height: 178.51 ± 7.82 cm; weight: 78.60 ± 8.85 kg; fat mass proportion: 16.86 ± 4.78%; VO2max: 49.92 ± 3.15 ml/kg/min; exercise frequency: 4.50 ± 0.50 times/week; soccer experience: 21.67 ± 3.40 years). Players’ health was checked and confirmed by the Physical Activity Readiness-Questionnaire (Tremblay et al., 2012). Each subject was informed about the study procedure and possible risks and agreed to participate by signing a consent form. As per the local legislation, this study was exempt from full ethics review by the institutional review board, due to this being an anonymous study containing anonymous data. To avoid bias, goal keepers were excluded from this study (Altmann et al., 2020).
Variables and procedures
Université de Montréal track test
The UMTT was conducted on a 400-m-tartan track. Large cones were placed at 50-m-intervals, small cones after the first 33.33 m and at 100-m-intervals. The speed was controlled by an acoustic signal at which the cones had to be reached. The initial speed was set at 10 km/h and every 2 min the speed was increased by 1 km/h (Berthoin et al., 1996; Billat and Koralsztein, 1996; Bellenger et al., 2015; Darendeli et al., 2021). Each subject was equipped with a previously validated chest strap (H7 or H10, Polar Electro, Kempele, Finland) for monitoring HR (Speer et al., 2020; Hernández-Vicente et al., 2021). The test was completed as soon as the subject was no longer able to reach the specified cone at the acoustic signal. VUMTT was determined as the speed of the last stage. If the last stage had not been finished, VUMTT was calculated using the following formula: VUMTT = speed of the last completed stage [km/h]+time in last stage [s]/120 s (Berthoin et al., 1996). In addition, the HRmaxUMTT and RPEUMTT were recorded after the end of the test to assess physical exhaustion.
Cardiopulmonary exercise testing
To assess MASPlateau and MAS30s, CPET on a treadmill with ±0.1 km/h speed accuracy was performed (Woodway PPSmed 55 and PPSmed L70; WOODWAY GmbH; Weil am Rhein; Germany). The test protocol started at 6 km/h and increased every 3 min by 2 km/h with a treadmill incline of 1% to reflect the energy expenditure of outdoor running (Jones and Doust, 1996). Between each stage, the subject rested for 0.5 min and the test got terminated by the subject due to voluntary exhaustion (Dickhuth and Badtke, 2007). Breath-by-breath ventilatory data were obtained using the Metalyzer 3B spirometer and the appropriate MetaSoft three software (Cortex Biophysik GmbH; Leipzig; Germany) with which the data was prepared as 15-s moving average values for further analysis. This technology enables accurate and precise determination of the individual VO2-kinetics (Vogler et al., 2010). Gas sensors were calibrated using gases of known concentrations (15% O2, 5% CO2), and the turbine volume transducer was calibrated using a 3-l syringe (Cortex Biophysik GmbH; Leipzig; Germany).
The VO2-data were first examined for a plateau which is defined as a lower increase in VO2 than 150 ml/min in at least the last minute of exercise (Meyer and Kindermann, 1999). The MASPlateau represents the first velocity when reaching this plateau (Billat and Koralsztein, 1996). Additionally, the velocity at the onset of the 30-s-interval of VO2max (MAS30s) was determined, as this is another common definition for the determination of MAS (Buchheit, 2008; Sandford et al., 2019). The VO2max was defined as the highest 30-s-interval of VO2. The RERend represented the highest value of the quotient VCO2/VO2 during the end of exercise. The HRmax was assessed using a chest strap (H7 or H10; Polar Electro; Kempele; Finland). In addition, RPE was queried after test termination. Immediately after the test, 20 μl of capillary blood was collected from the right earlobe and analyzed by the BIOSEN C-Line lactate analyzer (EKF Diagnostic; Barleben; Germany) to assess the maximal lactate value reached during the treadmill test (Laend). In order to achieve physical exhaustion and thus VO2max, the collected data were analyzed for the following exercise criteria, of which at least two had to be fulfilled (Neumann, 2013): RERend ≥ 1.0 (Dickhuth and Kindermann, 2002); RPE ≥17 (Sangan et al., 2021); HRmax ≥210-age, Laend ≥ 8 mmol/L, and reaching a VO2-plateau (Marées and Heck, 2003).
1500-m-time trial
To ensure reliability of the 1500-m-TT, subjects performed a habituation session 1 week in advance (Clarke et al., 2016). For HR measurement, each subject received a chest strap (H7 or H10; Polar Electro; Kempele; Finland). The subjects ran on a 400-m tartan track and performed a warm-up (at least 400 m jogging; 100 m easy acceleration runs; 3 min stretching) right before the start of the TT. During the TT, subjects were instructed to keep their speed as even as possible. The time to complete the 1,500 m was measured with a stopwatch, from which the average speed in km/h (V1500m) was determined (Darendeli et al., 2021). In addition, the regression equation of Bellenger et al. (2015) was used to calculate an approximation to the true MAS (Vcalc = V1500m*(0.766 + 0.117*1.5 km)). HRmax1500m and RPE1500m were recorded after test termination to ensure physical exhaustion.
Statistical analysis
Statistical analysis and creation of graphics were carried out with the statistical software IBM SPSS© Statistics (version 27). To detect possible differences between the parameters MASPlateau/VUMTT/V1500m/Vcalc, HRmax/HRmaxUMTT/HRmax1500m, and RPE/RPEUMTT/RPE1500m, ANOVA with repeated measures and Bonferroni post-hoc tests were calculated. In addition, t-tests for dependent samples were used for the comparison of MASPlateau vs. MAS30s, and MASPlateau vs. Vcalc. The effect sizes of the ANOVA results were estimated by partial eta2: 0.01≤ηp2<0.06 is considered a small, 0.06≤ηp2<0.14 as a medium, and 0.14≥ηp2 as a large effect (Cohen, 1988). The effect sizes (ES) of the t-tests and post-hoc tests were calculated using Cohen’s d: 0.2 ≤ ES < 0.5 represent small, 0.5 ≤ ES < 0.8 medium, and ES ≥ 0.8 represent large effects (Cohen, 1988). Absolute agreement between MASPlateau, VUMTT, and V1500m and between MASPlateau and MAS30s, and MASPlateau and Vcalc was determined with the limits-of-agreement analysis (LoA analysis) and Bland-Altman plots (Altman and Bland, 1983). In addition, Pearson’s correlation coefficient r and the intraclass correlation coefficient (ICC 3.1) were calculated. According to Hopkins (2004), the magnitude of the correlation was considered to be small (0.1 ≤ r/ICC<0.3), medium (0.3 ≤ r/ICC<0.5), large (0.5 ≤ r/ICC<0.7), very large (0.7 ≤ r/ICC<0.9), and almost perfect (r/ICC≥0.9) classifications. The significance level for all calculations was set at p < 0.05.
Results
Each subject met three or more of the specified criteria, so that physical exhaustion was ensured. The mean values and standard deviations of the recorded parameters for the incremental treadmill test, UMTT and the 1500-m-TT are shown in Table 1. Moreover, individual progressions of MASPlateau/MAS30s, MASPlateau/VUMTT/V1500m, and MASPlateau/Vcalc are visualized as spaghetti plots in Figure 1. These descriptive results already indicate an overestimation of MASPlateau by the estimations, i.e., MAS30s, VUMTT, V1500m, and Vcalc.
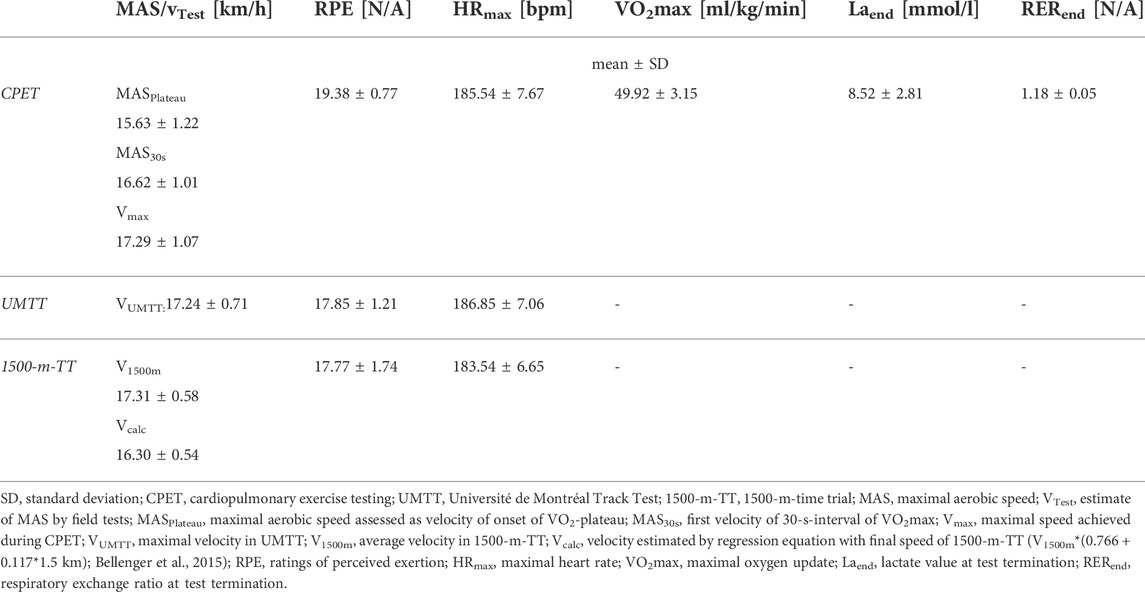
TABLE 1. Descriptive results for the CPET on the treadmill, UMTT, and 1500-m-TT. Results are presented as mean values ±SD.
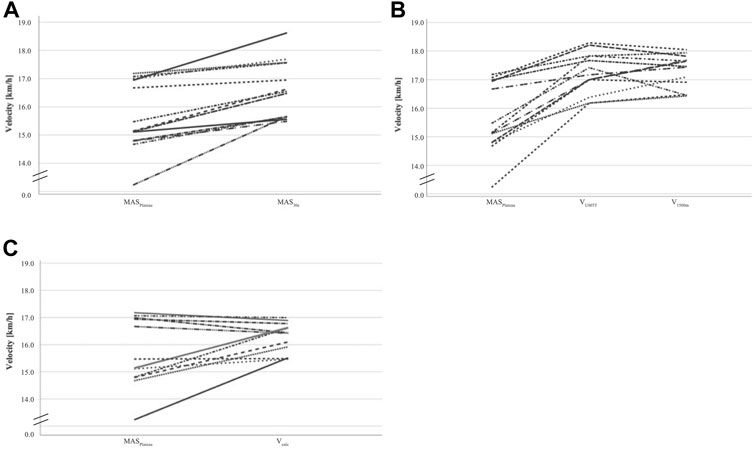
FIGURE 1. Spaghetti plots for intra- and interindividual comparison of (A) MASPlateau and MAS30s; (B) MASPlateau, VUMTT, and V1500m; and (C) MASPlateau and Vcalc.
The comparison of both VO2-kinetic based methods to assess MAS resulting in the parameters MASPlateau and MAS30s (see Table 2) shows a significant increase by 0.99 km/h (p < 0.01) with a large effect (ES = 1.61) and Limits of Agreement (LoA) ranging from -0.21–2.20 km/h (see Figure 2). Though, results of correlation analysis show very large correlations between MASPlateau and MAS30s (r = 0.87; ICC = 0.85; see Table 2).
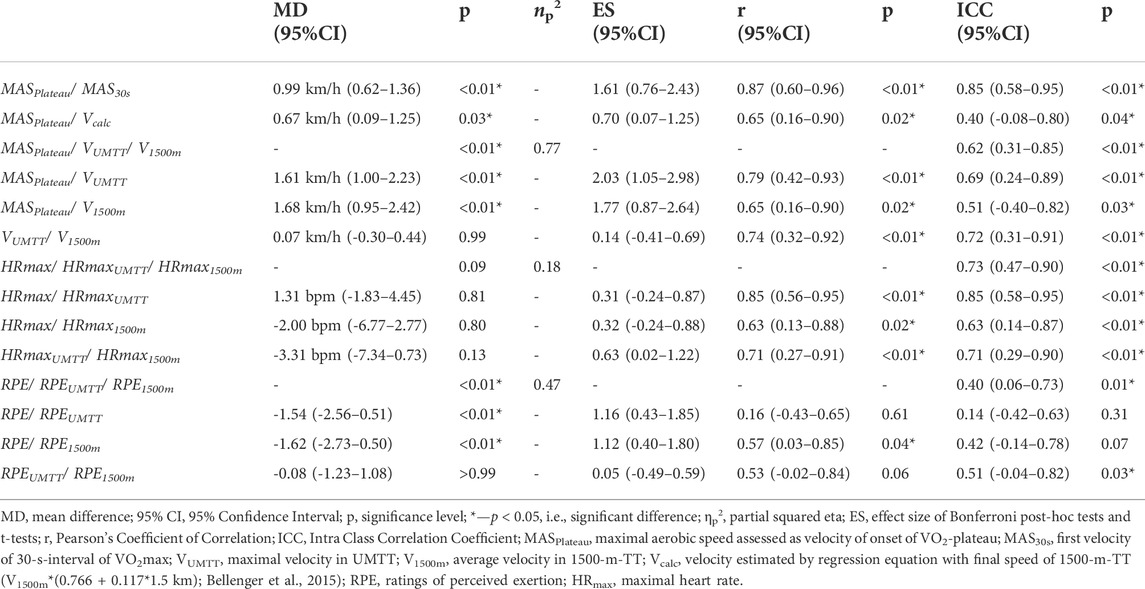
TABLE 2. Results of ANOVA, Bonferroni post-hoc tests, t-tests, and correlation analysis.
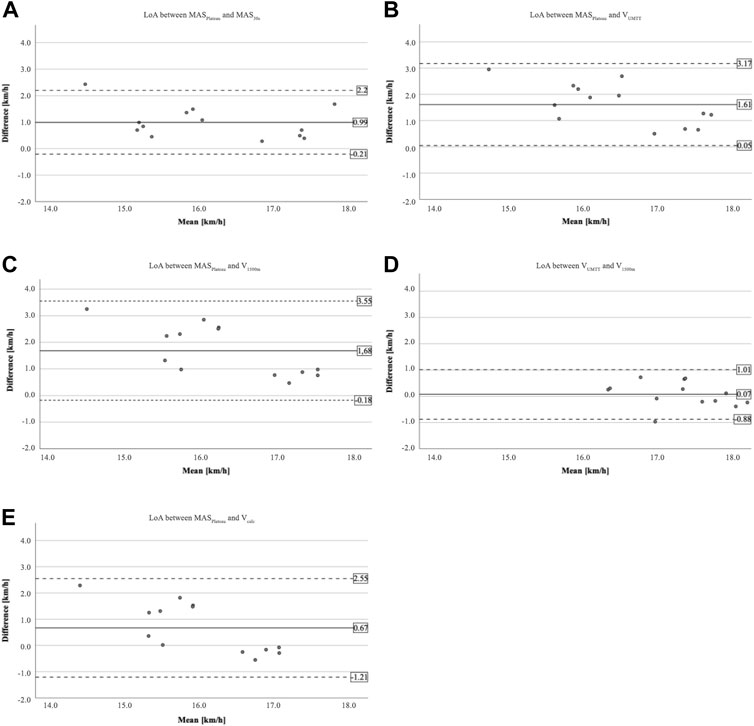
FIGURE 2. Bland-Altman plots for limits-of-agreement analysis (LoA analysis) between (A) MASPlateau and MAS30s; (B) MASPlateau and VUMTT; (C) MASPlateau andV1500m; (D) VUMTT and V1500m; and (E) MASPlateau and Vcalc. The solid lines represent the mean difference, the dashed lines represent the limits of agreement (±1.96 SD).
Moreover, VUMTT and V1500m overestimate MASPlateau by 1.61 km/h (p < 0.01; ES = 2.03) and 1.68 km/h (p < 0.01; ES = 1.77), respectively. Between VUMTT and V1500m, no significant difference (p = 0.99; ES = 0.14) was found. The LoA between VUMTT and V1500m range from -0.8–1.01 km/h, between MASPlateau and VUMTT from 0.05 to 3.17 km/h, and between MASPlateau and V1500m from -0.18–3.55 km/h. The correlations between the three velocities are large to very large (0.65 ≤ r ≤ 0.79; p ≤ 0.02; 0.51 ≤ ICC≤0.72; p ≤ 0.03). The comparison of MASPlateau and Vcalc shows a significant difference (MD = 0.67 km/h; p = 0.03; ES = 0.70). In addition, the LoA between MASPlateau and Vcalc range from -1.21–2.55 km/h. There is a medium to large correlation between MASPlateau and Vcalc (r = 0.65; p = 0.02; ICC = 0.40; p = 0.04).
Discussion
Main findings
The first aim of this study was to compare two different VO2-kinetic based methods to determine MAS in soccer players, i.e., MASPlateau and MAS30s, using CPET on a treadmill. MASPlateau was consistently overestimated by MAS30s, nevertheless, MASPlateau and MAS30s were highly correlated.
The second aim was to investigate the convergent validity of the UMTT and a 1500-m-TT to estimate MASPlateau. MASPlateau was overestimated by both VUMTT and V1500m, nonetheless, large to very large correlations with MASPlateau were found. Further, the calculated speed from the 1500-m-TT according to Bellenger et al. (2015), Vcalc, was significantly higher than MASPlateau.
Discussion of MAS assessment via CPET
The results of the CPET to determine MAS illustrate the difference between two of the common definitions of MAS. Since VO2max in healthy subjects almost always occurs before the end of an physical exhaustion exercise and a VO2-plateau by definition lasts at least 1 minute (Meyer and Kindermann, 1999), a significant difference between MASPlateau and MAS30s was expected. The mean difference of 0.99 km/h indicates that after reaching MASPlateau, subjects maintained their performance for an average of almost 1.5 min with a higher proportion of anaerobic resources until MAS30s was reached (Buchheit, 2010). Because MASPlateau represents the first velocity when reaching a VO2-plateau (Di Prampero et al., 1986) and therefore reflects the maximal speed with mainly aerobic resources, efforts above the onset of the plateau are associated with a higher input of anaerobic resources. Hence, velocities above the onset of a VO2-plateau should not be attributed as a MAS. The very large effect size illustrates the practical relevance of this difference and the very large correlation between the two velocities supports the consistent overestimation of MASPlateau. Therefore, MAS should be determined individually based on VO2-kinetics by investigating the plateau. In addition, these results suggest that studies that used Vmax (Berthoin et al., 1996) or MAS30s (Sandford et al., 2019) to validate field testing procedures, probably did not use the “true” MAS determined by CPET with examining the onset of the VO2-plateau as a gold standard, which may have biased the results.
Discussion of UMTT and 1500-m-TT
The LoA between MASPlateau and VUMTT indicate a wide dispersion of individual differences. Moreover, the significant overestimation found in this study is similar to the results of Lacour et al. (1991) who also reported a higher VUMTT than MAS (+0.25 ± 0.07 km/h, p = 0.03) and a nearly perfect correlation (r = 0.92; p < 0.01) in a group of runners despite using a different protocol and a different definition for MAS. In contrast, Berthoin et al. (1996) and Souza et al. (2014) did not find differences between MAS and VUMTT, but also used different protocols and definitions of MAS. Berthoin et al. (1996) determined the velocity of the last stage for both MAS (assessed by CPET on a treadmill) and VUMTT, which means that they did not distinguish between MAS and Vmax. On the contrary, in the present study, VUMTT was compared to MASPlateau, which represents the first velocity of the VO2-plateau. The UMTT represents an incremental test similar to CPET on a treadmill and because the final speed achieved during the UMTT is used as VUMTT the significant difference to MASPlateau assessed as the onset of a VO2-plateau can be explained.
Additionally, V1500m shows a systematic overestimation of MASPlateau. Nevertheless, both the relatively large LoA and the large 95% CI of the mean difference indicate interindividual discrepancies in the differences between MASPlateau and V1500m. Sandford et al. (2019) also detected an overestimation of MAS by V1500m. The overestimation could be explained by the assumption that the distance for the total sample may have been too short to include only aerobic resources, but additionally anaerobic resources to run the 1,500 m in the best possible time. The fact that for some players the V1500m was considerably closer to the MASPlateau than for others could indicate a heterogeneous character of the endurance performance of the sample. This may be due to the non-professional level of the sample on the one hand and on the other hand to position-specific differences. Different endurance profiles related to the player position could already be demonstrated in part (Altmann et al., 2020). Therefore, different distances should be used when implementing TT to estimate MASPlateau depending on the endurance performance level.
To address this issue, Bellenger et al. (2015) propose a regression equation (Vcalc) to estimate MAS by set distance TT with distances between 1,600 m and 2,200 m. The comparison of MASPlateau and Vcalc shows similar results as the comparison of MASPlateau and V1500m. In this sense, Vcalc also overestimates MASPlateau. If individual variations are considered, it is plausible that, as with V1500m, the dispersion around the mean difference is very large. This was to be expected, since Vcalc is calculated from V1500m. The individual differences were merely shifted downward, so that they scatter both to the positive and to the negative. However, it should be noted that the regression equation used to calculate Vcalc was set up by Bellenger et al. (2015) using VUMTT as reference. This could additionally explain the overestimation of the MASPlateau in this study.
Moreover, the comparison of the two velocities V1500m and VUMTT achieved during the field test have the lowest mean difference and narrowest range of variation, as well as a very large correlation. Both Bellenger et al. (2015) and Lundquist et al. (2021) found high to very high levels of agreement between V1400m–V2000m and VUMTT in male and female Australian Rules Football players. This also indicates a similar intensity of the two test procedures for team sports athletes.
Delimitations and limitations
The gold standard method to assess MAS has not yet been clarified, in particular it is unclear which treadmill protocol leads to the “true” MAS, especially in soccer. A major delimitation of our study is that we used a protocol with a 0.5 min break between the stages, which commonly serves to measure lactate via capillary blood between the stages of an incremental treadmill test. When analysing the individual VO2-kinetics, we determined that the break between the stages is a major limitation. This pause probably allowed a short recovery, so that VO2 progression delayed, especially at higher speeds at the beginning of a stage. This influences individual determination of MAS based on the VO2-kinetics and possibly postpones physical exhaustion and thus reaching VO2max (Metaxas et al., 2005). As a further delimitation, different environmental conditions may have influenced performance during the different test procedures. For example, some players completed the incremental treadmill test in the morning or at noon, with the UMTT and 1500-m-TT occurring in the evening for all subjects. Changes in performance at different times of the day have already been confirmed (Chtourou and Souissi, 2012). A limitation of our study is that the field tests were performed in different groups while the treadmill test was performed individually. This might have induced different levels of motivation in the subjects at the test time points. A last point to consider is the relatively heterogeneous aerobic endurance performance of the subjects. The MASPlateau of the sample shows a range of 13.23–17.18 km/h. Due to heterogeneous performance, the use of a TT with the same distance for all subjects is questionable. However, a habituation session was performed for improvement of independent speed control during the 1500-m-TT.
Future research
In order to interpret and compare different study results, it is important to use a consistent gold standard method for the assessment of MAS. Since different definitions are used to determine MAS, future research is necessary to clearly delineate MASPlateau, MAS30s and Vmax. Because previous studies on the validity of field test procedures have not been conducted with a uniform gold standard method and because MAS determination via an incremental treadmill test claims many resources, further investigation of the validity of existing field test procedures or the development of new test procedures is essential. Especially in team sports and its divergent endurance performance levels, there is a great potential for research in this regard. Regarding a TT, e.g., a classification of players into different endurance profiles based on norm values of MAS or by different expressions of anaerobic speed reserve (Sandford et al., 2021) and the assignment of these levels to appropriate distances to estimate MAS should be investigated in the future. Thus, a more accurate estimate of MAS using a TT would be possible. Though, the sample consisted of trained soccer players, the results can not directly be transferred to professional soccer. Therefore, more research regarding the assessment of MAS is required with professional soccer players.
In addition, technological evolutions may simplify MAS estimation in the future. On the one hand, global positioning systems could make it easier and presumably more accurate to record velocities in field tests, and on the other hand, algorithms could be developed and validated that estimate the current MAS based on certain physiological parameters - at best during training - and indicate any acute adjustments (Leser et al., 2011). Given the tight schedules of soccer players and coaches, integrating physiological diagnostics into the usual training could lead to a more efficient time schedules of players and coaches.
Practical applications
The UMTT and 1500-m-TT do not appear to be valid and thus less appropriate methods for estimating MAS for male soccer players. The LoA for both, UMTT and 1500-m-TT, indicate the deviations from MAS are higher than typical improvements of MAS achieved through specific training programs (Denadai et al., 2006; González-Mohíno et al., 2016). Therefore, training based on MAS estimations via UMTT or a TT might lead to much higher intensities than expected when using the true MAS, probably resulting in less improvements in performance, overload, or even a higher risk of injuries. For this purpose, it is recommended to either set up regression equations using a consistent gold standard method for estimating MAS using the VUMTT or V1500m or to choose individual distances for TT adjusted to the endurance performance level. Moreover, adapted training programs are possible, when the individual intensity of VUMTT or V1500m in deviation to MAS is known.
Conclusion
To conclude, our results indicate that different definitions of MAS lead to different results and that estimates by field tests are non-appropriate methods to determine MAS in trained soccer players. Conversely, using such methods may result in researchers and practitioners using too high intensities. This indicates the necessity of MAS-assessment by investigating VO2-kinetics and examining the onset of the VO2-plateau or the use of adjusted or new field tests to estimate MAS. This work provides the first evidence on the validity of MAS estimation of different field tests in soccer players. To improve MAS estimation in field tests, further valid and time saving methods as well as practical instructions for coaches should be developed in soccer in the future.
Data availability statement
The raw data supporting the conclusions of this article will be made available by the authors, without undue reservation.
Author contributions
All authors contributed to the conception of the study. MT and CK assessed the data. MT performed the statistical analysis and wrote the first draft of the manuscript. SH, SA, LR, CK, LK, and AW revised the original manuscript. All authors read and approved the final manuscript.
Acknowledgments
We acknowledge support by the KIT-Publication Fund of the Karlsruhe Institute of Technology.
Conflict of interest
The authors declare that the research was conducted in the absence of any commercial or financial relationships that could be construed as a potential conflict of interest.
Publisher’s note
All claims expressed in this article are solely those of the authors and do not necessarily represent those of their affiliated organizations, or those of the publisher, the editors and the reviewers. Any product that may be evaluated in this article, or claim that may be made by its manufacturer, is not guaranteed or endorsed by the publisher.
References
Altman D. G., Bland J. M. (1983). Measurement in medicine: The analysis of method comparison studies. Statistician 32, 307–317. doi:10.2307/2987937
Altmann S., Neumann R., Woll A., Härtel S. (2020). Endurance capacities in professional soccer players: Are performance profiles position specific? Front. Sports Act. Living 2, 549897. doi:10.3389/fspor.2020.549897
Aquino R., Carling C., Maia J., Vieira L. H. P., Wilson R. S., Smith N., et al. (2020). Relationships between running demands in soccer match-play, anthropometric, and physical fitness characteristics: A systematic review. Int. J. Of Perform. Analysis Sport 20, 534–555. doi:10.1080/24748668.2020.1746555
Bangsbo J., Iaia F. M., Krustrup P. (2008). The yo-yo intermittent recovery test : A useful tool for evaluation of physical performance in intermittent sports. Sports Med. 38, 37–51. doi:10.2165/00007256-200838010-00004
Bangsbo J., Nørregaard L., Thorsoe F. (1991). Activity profile of competition soccer. Can. J. Of Sport Sci. 16, 110–116.
Bellenger C. R., Fuller J. T., Nelson M. J., Hartland M., Buckley J. D., Debenedictis T. A. (2015). Predicting maximal aerobic speed through set distance time-trials. Eur. J. Appl. Physiol. 115, 2593–2598. doi:10.1007/s00421-015-3233-6
Berthoin S., Pelayo P., Lensel-Corbei G., Robin H., Gerbeaux M. (1996). Comparison of maximal aerobic speed as assessed with laboratory and field measurements in moderately trained subjects. Int. J. Sports Med. 17, 525–529. doi:10.1055/s-2007-972889
Billat L. V., Hill D. W., Pinoteau J., Petit B., Koralsztein J. P. (1996). Effect of protocol on determination of velocity at Vo2 max and on its time to exhaustion. Arch. Physiol. Biochem. 104, 313–321. doi:10.1076/apab.104.3.313.12908
Billat L. V., Koralsztein J. P. (1996). Significance of the velocity at vo 2max and time to exhaustion at this velocity. Sports Med. 22, 90–108. doi:10.2165/00007256-199622020-00004
Buchheit M. (2008). The 30-15 intermittent fitness test: Accuracy for individualizing interval training of young intermittent sport players. J. Strength Cond. Res. 22, 365–374. doi:10.1519/JSC.0b013e3181635b2e
Chtourou H., Souissi N. (2012). The effect of training at A specific time of day: A review. J. Strength Cond. Res. 26, 1984–2005. doi:10.1519/JSC.0b013e31825770a7
Clarke R., Dobson A., Hughes J. (2016). Metabolic conditioning: Field tests to determine A training velocity. Strength & Cond. J. 38, 38–47. doi:10.1519/ssc.0000000000000188
Darendeli A., Vitiello D., Billat V., Diker G., Cuğ M. (2021). Comparison of different exercise testing modalities to determine maximal aerobic speed in amateur soccer players. Sci. Sports 36, 105–111. doi:10.1016/j.scispo.2020.09.006
Denadai B. S., Ortiz M. J., Greco C. C., De Mello M. T. (2006). Interval training at 95% and 100% of the velocity at V O2 max: Effects on aerobic physiological indexes and running performance. Appl. Physiology, Nutr. And Metabolism 31, 737–743. doi:10.1139/h06-080
Di Prampero P., Atchou G., Brückner J.-C., Moia C. (1986). The energetics of endurance running. Eur. J. Appl. Physiol. Occup. Physiol. 55, 259–266. doi:10.1007/BF02343797
Dickhuth H.-H., Kindermann W. (2002). Einführung in die sport-und leistungsmedizin. Sportwiss. 32, 110–112. doi:10.1007/bf03176718
Dickhuth H., Badtke G. (2007). Sportmedizin für ärzte: Lehrbuch auf der grundlage des weiterbildungssystems der deutschen gesellschaft für sportmedizin und prävention (dgsp). Deutscher Ärzteverlag: Mit 109 Tabellen.
González-Mohíno F., González-Ravé J. M., Juárez D., Fernández F. A., Castellanos R. B., Newton R. U. (2016). Effects of continuous and interval training on running economy, maximal aerobic speed and gait kinematics in recreational runners. J. Strength Cond. Res. 30, 1059–1066. doi:10.1519/JSC.0000000000001174
Hernández-Vicente A., Hernando D., Marín-Puyalto J., Vicente-Rodríguez G., Garatachea N., Pueyo E., et al. (2021). Validity of the polar H7 heart rate sensor for heart rate variability analysis during exercise in different age, body composition and fitness level groups. Sensors 21, 902. doi:10.3390/s21030902
Hopkins W. G. (2004). How to interpret changes in an athletic performance test. Sportscience 8, 1–7.
Jones A. M., Doust J. H. (1996). A 1% treadmill grade most accurately reflects the energetic cost of outdoor running. J. Sports Sci. 14, 321–327. doi:10.1080/02640419608727717
Kuipers H., Rietjens G., Verstappen F., Schoenmakers H., Hofman G. (2003). Effects of stage duration in incremental running tests on physiological variables. Int. J. Sports Med. 24, 486–491. doi:10.1055/s-2003-42020
Lacour J., Padilla-Magunacelaya S., Chatard J., Arsac L., Barthelemy J. (1991). Assessment of running velocity at maximal oxygen uptake. Eur. J. Appl. Physiol. Occup. Physiol. 62, 77–82. doi:10.1007/BF00626760
Léger L., Boucher R. (1980). An indirect continuous running multistage field test: The Université de montréal track test. Can. J. Appl. Sport Sci. 5, 77–84.
Léger L., Mercier D., Gadoury C., Lambert J. (1988). The multistage 20 metre shuttle run test for aerobic fitness. J. Sports Sci. 6, 93–101. doi:10.1080/02640418808729800
Leser R., Baca A., Ogris G. (2011). Local positioning systems in (game) sports. Sensors 11, 9778–9797. doi:10.3390/s111009778
Lundquist M., Nelson M. J., Debenedictis T., Gollan S., Fuller J. T., Larwood T., et al. (2021). Set distance time trials for predicting maximal aerobic speed in female Australian Rules footballers. J. Sci. Med. Sport 24, 391–396. doi:10.1016/j.jsams.2020.10.002
Mckay A. K., Stellingwerff T., Smith E. S., Martin D. T., Mujika I., Goosey-Tolfrey V. L., et al. (2022). Defining training and performance caliber: A participant classification framework. Int. J. Sports Physiol. Perform. 17, 317–331. doi:10.1123/ijspp.2021-0451
Metaxas T. I., Koutlianos N. A., Kouidi E. J., Deligiannis A. P. (2005). Comparative study of field and laboratory tests for the evaluation of aerobic capacity in soccer players. J. Strength Cond. Res. 19, 79–84. doi:10.1519/14713.1
Meyer T., Kindermann W. (1999). Die maximale sauerstoffaufnahme (Vo2max). Dtsch. Z. Für Sportmed. 50, 285–286.
Neumann R. (2013). Analyse physiologischer Gesetzmäßigkeiten zu den Themenbereichen “Ausbelastungskriterien” und “Nachbelastungsverhalten” anhand der Ergebnisse ausdauerleistungsdiagnostischer Untersuchungen am Institut für Sport und Sportwissenschaft des Karlsruher Instituts für Technologie (KIT) im Zeitraum 2007–2010 Doctoral dissertation. Karlsruhe: Karlsruher Institut für Technologie (KIT), Diss.
Petot H., Meilland R., Le Moyec L., Mille-Hamard L., Billat V. L. (2012). A new incremental test for VO₂max accurate measurement by increasing VO₂max plateau duration, allowing the investigation of its limiting factors. Eur. J. Appl. Physiol. 112, 2267–2276. doi:10.1007/s00421-011-2196-5
Riboli A., Coratella G., Rampichini S., Limonta E., Esposito F. (2021). Testing protocol affects the velocity at Vo2max in semi-professional soccer players. Res. Sports Med. 30, 182–192. doi:10.1080/15438627.2021.1878460
Sandford G. N., Laursen P. B., Buchheit M. (2021). Anaerobic speed/power reserve and sport performance: Scientific basis, current applications and future directions. Sports Med. 51, 2017–2028. doi:10.1007/s40279-021-01523-9
Sandford G., Rogers S., Sharma A., Kilding A., Ross A., Laursen P. (2019). Implementing anaerobic speed reserve testing in the field: Validation of Vvo2max prediction from 1500-M race performance in elite middle-distance runners. Int. J. Sports Physiol. Perform. 14, 1147–1150. doi:10.1123/ijspp.2018-0553
Sangan H. F., Hopker J. G., Davison G., Mclaren S. J. (2021). The self-paced submaximal run test: Associations with the graded exercise test and reliability. Int. J. Sports Physiol. Perform. 1, 1865–1873. doi:10.1123/ijspp.2020-0904
Souza K. M. D., Lucas R. D. D., Grossl T., Costa V. P., Guglielmo L. G. A., Denadai B. S. (2014). Performance prediction of endurance runners through laboratory and track tests. Revista Brasileira De Cineantropometria Desempenho Humano 16, 466–474. doi:10.5007/1980-0037.2014v16n4p465
Speer K. E., Semple S., Naumovski N., Mckune A. J. (2020). Measuring heart rate variability using commercially available devices in healthy children: A validity and reliability study. Eur. J. Investig. Health Psychol. Educ. 10, 390–404. doi:10.3390/ejihpe10010029
Tremblay M. S., Leblanc A. G., Carson V., Choquette L., Connor Gorber S., Dillman C., et al. (2012). Canadian sedentary behaviour guidelines for the early years (aged 0–4 Years). Appl. Physiology, Nutr. And Metabolism 37, 370–391. doi:10.1139/h2012-019
Keywords: football, fitness, endurance, field test, MAS, performance testing
Citation: Thron M, Woll A, Klos L, Härtel S, Ruf L, Kloss C and Altmann S (2022) Overestimation of maximal aerobic speed by the Université de Montréal track test and a 1500-m-time trial in soccer. Front. Physiol. 13:1023257. doi: 10.3389/fphys.2022.1023257
Received: 19 August 2022; Accepted: 30 September 2022;
Published: 11 October 2022.
Edited by:
Hassane Zouhal, University of Rennes 2—Upper Brittany, FranceReviewed by:
Clayton L. Camic, Northern Illinois University, United StatesMarcos Michaelides, University of Central Lancashire, Cyprus
Copyright © 2022 Thron, Woll, Klos, Härtel, Ruf, Kloss and Altmann. This is an open-access article distributed under the terms of the Creative Commons Attribution License (CC BY). The use, distribution or reproduction in other forums is permitted, provided the original author(s) and the copyright owner(s) are credited and that the original publication in this journal is cited, in accordance with accepted academic practice. No use, distribution or reproduction is permitted which does not comply with these terms.
*Correspondence: Maximiliane Thron, maximiliane.thron@kit.edu