
Preheating of Lithium-Ion Battery Electrodes as Basis for Heated Calendering—A Numerical Approach


Institute for Particle Technology, Volkmaroder Straße 5, 38104 Braunschweig, Germany
*
Author to whom correspondence should be addressed.
Processes 2022, 10(8), 1667; https://doi.org/10.3390/pr10081667
Submission received: 18 July 2022
/
Revised: 19 August 2022
/
Accepted: 19 August 2022
/
Published: 22 August 2022
(This article belongs to the Section Particle Processes)
Abstract
:Lithium-ion batteries are state of the art and, still, their performance is constantly improving. To increase the energy density and electric conductivity, electrodes are usually calendered. Hereby, a higher degree of compaction, while reducing structural damage, can be reached by heating the calendering rolls. For industrially relevant line speeds, it is however questionable whether the contact time between electrode and roll is sufficient to reach the full positive effect of the increased temperature. This study shows a numerical approach based on the discrete element method to simulate the heating behavior of electrodes before and during calendering using a typical NMC-622-cathode as a model structure. To improve the results of existing, more simplified discrete element method simulations, which neglect the heat transfer through the carbon black–binder matrix, an extension with heat transfer through the carbon black–binder matrix has been implemented. Considering process parameters, such as calender roll temperature and line speed, as well as electrode parameters, such as thickness and porosity, this model can provide an individual calculation of the heating behavior to evaluate the need for a preheating device. Specifically, this study provides an in depth analysis of the influence of the mass loading on the heating time. It becomes clear that preheating can be of great relevance especially for high mass loadings, as well as high line speeds, as the required heating time increases by 116% when the basis weight is increased by 50%.

1. Introduction
Lithium-ion batteries play a central role in the transformation of the energy supply. The ever-increasing demands on the performance of these batteries can be achieved by optimizing the process parameters in the individual processes in the complex process chain, in addition to improvements in cell design and the materials used [1].
At a cell level, a significant influence of process parameters on the electrode structure and thus on the cell performance has been demonstrated in various studies for the process steps of mixing and dispersion, drying, and calendering.
Bockholt et al. have studied the influence of the dry and wet mixing process on the slurry properties and the electrode structure, as well as the electrochemical performance [2]. The influence of different binder mixing sequences was shown by Kitamura et al. They observed differences in adsorption of the binder to the particles, which had an influence on the rheology of the slurry and the electrode structure [3].
Using fluorescent additives, Jaiser et al. have identified an intermediate period during electrode drying that is very sensitive to high drying rates, resulting in binder segregation [4]. Based on this, they have developed a three-stage drying profile that ensures high electrode quality in combination with a fast drying process [5]. As drying thick electrodes is particularly challenging due to binder segregation and crack formation, Kumberg et al. have investigated this issue and recommend using high drying temperatures with low heat transfer coefficients to increase diffusive binder mobility [6].
Regarding the calendering process, Schreiner et al. identified various machine/material–process–structure correlations that can be considered for optimal process design [7]. Lu et al. [8] used X-ray nano-computed tomography to study the structure evolution during calendering and correlated it with electrode performance. Based on these results, critical densification levels were identified beyond which the electrode performance drops significantly.
Meyer et al. [9] have shown that higher degrees of compaction are possible by using heated calender rolls, or that lower line loads are required for the same degree of compaction due to the increase of the binder’s elastic deformability at higher temperatures [10].
Numerical approaches represent a promising approach to increase the process understanding for various unit operations. For the calendering of battery electrodes, different discrete element method approaches exist, which can be distinguished by the method in which the inactive material is displayed. Ngandjong et al. replace the additives with a surrogate material of corresponding aggregates [11], while Sangros et al. add inactive material in the form of cylindrical solid bridges (bonds) [12,13,14]. In addition, hybrid approaches that combine both model conceptions also exist. All approaches are able to yield experimental results with sufficient accuracy [15].
With the help of the discrete element method (DEM), Sangros et al. investigated the influence of the electrode porosity and the active material distribution on the thermal conductivity. However, this approach neglects the influence of the inactive material and therefore shows optimization potential, especially with respect to the thermal isolation of various particles. In this study, we extend the bond model used by Sangros et al. in the context of calendering by thermal conduction through the inactive carbon black–binder matrix and improve the formation of particle contacts as well as conductive pathways. Based on these findings, a methodology to evaluate the heating behavior in relation to the process time is established.
2. Materials and Methods
2.1. Simulation Set Up
In order to create a model cathode, the DEM procedure (Figure 1) from Sangros [12] was used. Here, the active material was modeled according to a discretized particle size distribution determined via laser diffraction. The particle size distribution was divided into five representative intervals which included the same particle volume. The middle of each interval was used as its respective particle diameter. The exact number of particles for each size fraction is listed in Appendix A (Table A1). The particles were randomly generated in a representative volume element (RVE), considering the initial layer thickness, porosity, electrode formulation, and particle size distribution. Periodic boundary conditions were used in the X and Y directions.
Binder and carbon black (CB) are assumed to form a homogeneous matrix, forming idealized cylindrical bonds between the particles as shown in Sangros et al. [12]. Here, the radius of the cylindrical base of the bonds is proportional to the radius of the smaller bond partner with a proportionality factor c. A bond is formed between two particles with the radii and with the center distance if the following criterion is fulfilled:
The calibration factor c determines the maximum bond length as a function of the radii of the potential bond partners. Since this approach favors the formation of bonds by coarser particles, smaller particles partially do not form any bonds, while coarse particles form significantly too many bonds. This problem was resolved by defining an overall maximum bond length as an additional criterion, so that c can be increased without coarse particles forming too many bonds. The parameters c and the overall maximum bond length were systematically varied within meaningful values in order to represent the real binder and carbon black contents within the experimentally produced electrodes. For this, the overall maximum bond length and c were increased until every particle was connected to the bond network.
The radius of each bond equals the product of the minimum radius of the two bonded partners multiplied with the scaling factor α. The parameter α was adjusted so that the total volume of the bonds reaches the target volume. The target volume for the inactive material was calculated using the densities of each material, the electrode formulation, and the overall electrode porosity.
The volume of each bond can be calculated as the volume of a cylinder considering the bond length and bond diameter. The sum of the individual bond volumes can be related to the overall volume of the simulation box to calculate the inactive material volume fraction used in the simulation. Thus, by adjusting the parameters c, α, and the overall maximum bond length, different binder and CB fractions can be set.
2.2. Heat Conduction Model
In the simulations presented, it was assumed that there were no temperature gradients within the particles and that heat flux via the gas phase in the pores was negligible. Furthermore, the mechanical and thermal properties of the particles were kept constant during temperature changes [13]. The simulations were carried out using the open source DEM code LIGGGHTS [16].
The original LIGGGHTS code [16] features a thermal conductivity model that is capable of transferring heat upon direct particle contact [17].
The transferred heat between two particles i and j with temperatures and is described as follows:
According to Chaudhuri [17], the heat transfer coefficient between the particles i and j in contact is defined as
The contact area of both particles equals . In the case of identical thermal conductivities and of both particles, the heat transfer coefficient can be estimated considering the contact force in the normal direction between the particles i and j, the effective Young’s modulus E*, and the effective radius r* [17]:
However, since the electrode model developed by Sangros et al. [12] uses bonds to represent binder and CB, the heat conduction model was extended to include heat transfer through these bonds. For this purpose, the following simplifying assumptions were made:
- Each individual bond has its own temperature, which is uniform over the entire bond.
- The bond consists of a homogeneous material that has a specific heat capacity and thermal conductivity.
- The influence of the temperature on the heat conductivity is neglected.
Since the use of the bond model is already subject to various simplifying assumptions, the same physical laws are used for the heat transfer from particles to bonds. The thermal conductivity of the bonds is used as a calibration parameter. This calibration parameter takes various uncertainties into account such as the bond shape, and the homogeneous distribution of CB and binder within the bond. Advantageously, the simulation time can be kept low compared to better resolved methods [18], while being able to simulate significantly larger structures.
The heat flow between bond b and particle i with the temperatures and is given by
where corresponds to the heat transfer coefficient between the bond and the particle. The cross-sectional area of the bond is used as the cross-sectional area analogous to Equation (3):
If two particles are directly in contact, the contact area used for heat conduction across the bond is reduced by the projected cross-sectional area of the particle–particle contact .
2.3. Bond-Model Parameter Estimation
To calibrate the model, thermal conductivities of cathodes were taken from the literature. Since this study evaluates a worst case scenario for the thermal conductivity of electrodes, the lowest thermal conductivities for cathodes reported from the literature were used, leaving the thermal conductivity of bonds as a parameter for calibration. The worst case scenario was evaluated due to the fact that a lot of uncertainties such as the change in structure during calendering cannot be described exactly. Thus, the study describes the worst possible thermal conductivity behavior of the electrode. Consequently, the method presented here can provide an estimation of the highest possible heating time, as for example, for process design. For this purpose, a virtual cathode structure with a weight per unit area of 20.1 mg cm−2 was generated (see Section 3). The bond generation (c, overall maximum bond length, and α) was adjusted so that the correct inactive material volume according to the electrode’s formulation was achieved (see Section 2.1).
The thermal conductivity of the bonds was determined in a steady state (Figure 2), generating two plates: one below and one above with constant temperature. The current collector is depicted by the lower plate, and so it has the same temperature as the particles and was assigned as aluminum. The upper plate has a higher temperature, as it represents the heated calendering roll, and was assumed to be made of steel.
In order to establish contact between the plates and the layer, both plates were placed so that they overlap the top and bottom of the electrode by 0.5 µm (Figure 1). To correctly set the position of the plates, the upper and lower edges of the electrode were assumed to be equal to the highest and lowest edge of all particles in the simulation domains, respectively. This does not change the electrode structure, since the particle’s positions were fixed during the heat conduction simulation. Preliminary studies showed no influence of the overlap width on the thermal conductivity.
The material parameters used can be found in Table 1. Hong Sun et al. [19] investigated the heat conductivity of different NMC chemistries. For this study, a heat capacity of 700 J kg−1 K−1 was assumed.
For the carbon black–binder matrix, averages of both materials were taken from commercially available materials with respect to density and heat capacity. The thermal conductivity of steel greatly varies depending on its composition (~10–80 W m−1 K−1 [20]). The value of 20 W m−1 K−1 was selected from the lower end of the value range in order to remain close to the worst case scenario. The heat capacities of the roll and the current collector were negligible, since their temperatures were kept constant in the simulation.
Using known boundary temperatures and , area of the representative volume element A, and layer thickness , the total thermal conductivity λ of the electrode can be determined using the simulated amount of heat transferred from the heat source to the layer (Sangrós et al. 2016):
The total thermal conductivity can be calculated using heat flux at the heat sink or heat source. These calculations were carried out using a python script. Approaching the steady state, the difference between both heat fluxes strives towards zero, which results in a common .
In order to track the temperature profile of the particles, the electrode was divided along the layer thickness into 10 segments of equal thickness. Within these segments, the average temperature of the particles was determined and weighted by the volume that the particles contribute to each segment. Once a steady state was reached, Equation (7) was used to determine the total thermal conductivity. A steady state was assumed when the thermal conductivity achieved by the heat fluxes at the lower and upper plates deviates by less than 1 × 10⁻⁴ W m−1 K−1.
3. Results and Discussion
In the following, three NCM-based cathodes will be investigated with respect to their thermal conductivity properties. The assumed electrodes consist of 94 wt % NCM 622, 3 wt % carbon black, and 3 wt % PVDF, but have different areal loadings (see Table 2). Further information on the cathodes used can be taken from [21]. The reference electrodes were coated using a pilot scale coater with a comma bar reverse roll application system. The mass loading was continuously measured by traversing sensor (USM200, MESYS AG). However, to demonstrate the numerical method, they were assumed to be coated on both sides. The electrode thickness was measured using a tactile digital gauge (ID-C, Mitutoyo). The densities and porosities were calculated using the mass loading and the measured thickness.
To achieve the active material structures, the particles were first generated at 80% of their size and then gradually enlarged until they reached their final size. During this, particle contacts were created, which resulted in motion of particles. In this process, a counterforce proportional to the speed of movement was applied to the particles against their direction of movement in order to relax the system.
The passive material is considered collectively as bonds, as described previously. To calibrate the thermal conductivity of the bonds, the cathode with an areal loading of 20.1 mg cm−2 with an assumed thermal conductivity of 0.2 W m−1 K−1 (taken from [18]) was used. This results in a thermal conductivity of bonds of 0.12 W m−1 K−1. To validate the result, the thermal conductivity of the electrodes with higher areal loadings was calculated with a bond thermal conductivity of 0.12 W m−1 K−1. It was expected that with the calibrated thermal bond conductivity, the same overall thermal conductivity of the electrode would be achieved for other areal loadings. The results show an almost constant thermal conductivity of the electrodes of 0.201 W m−1 K−1 in the mean with a deviation of 1.1%.
Oehler [18], referring to the work of Hamilton and Crosser [22], states the thermal conductivity of the carbon black–binder domain as 0.66 W m−1 K−1 (weight ratio CB to PVDF 1:1), which is about 5 times higher than in this study. This can be attributed to various causes. First, it must be noted that the thermal conductivity determined in this work was the result of a calibration process. This means that the thermal conductivity of the electrode has been defined a priori according to the literature data, and the thermal conductivity of the carbon black–binder domain must accordingly not be interpreted exclusively as a material parameter, since it is also subject to influences such as the model assumption of cylindrical carbon black–binder bridges and possible inhomogeneities in the local distribution of the inactive materials. In addition, it must be emphasized that Hamilton and Crosser’s approach assumes a homogeneous inactive material phase [18,22]. Based on different works that have investigated the influence of the dispersion process on the carbon black structure, it can be assumed that this assumption is at most only partially fulfilled [2,23,24].
Furthermore, an influence of the stochastically generated active material structure can be expected, since it can be assumed that a non-uniform distribution of the active material framework or a distribution with more or less active material overlaps would lead to changes in the calibrated conductivity of the carbon black–binder domain. In future studies, structures generated by physically based drying simulations or µCT images could be used as a basis for the thermal conduction simulation to increase the quality of the results.
Furthermore, a comparison is to be made with the previous model approach of Sangros [13] (Figure 3). For the same initial structure, the presented model with thermally conductive bonds (called new) was applied and compared to the model using non-thermally conductive bonds (called old). It is noticeable that in the old model, only particles in direct contact to the heated plate heat up. This is due to the fact that these particles do not have direct overlaps with other particles below, which is predefined by the generated structure. Since this work is not concerned with the influence of different electrode structures, but rather with evaluating the model extensions, the previously used initial structure was compacted to produce more direct particle–particle contacts to allow for a more illustrative comparison between the models.
In order to compact the structure, the upper plate was lowered 2.5 µm in analogy to Sangros’ calendering model [14]. This compaction assures that the old model is now able to form continuous heat conduction paths. However, thermally isolated particles and groups thereof are still clearly visible. This phenomenon of thermally isolated particles is also described by Sangros. To show its advantages, the new heat conduction model was applied to the compacted structure (Figure 3). Here, all particles are thermally connected to the system by enabling the thermal conduction via particle contacts as well as the carbon black–binder bonds. When comparing the thermal conductivities, the additional thermal paths due to the bonds greatly increase the thermal conductivity of the electrode from 0.181 W m−1 K−1 to 0.532 W m−1 K−1 (Figure 4). The uncompacted structure with bonds, which has few particle–particle contacts, has a thermal conductivity of only 0.202 W m−1 K−1, which clearly shows that the interaction of carbon black–binder and direct particle–particle contacts is decisive for the thermal conductivity of the model electrode. The thermal conductivity of the particles is approximately 35 times higher compared to the bonds, clearly indicating that conductive paths via direct particle–particle contacts are significantly more thermally conductive. However, even a single small defect is enough to completely disrupt the conduction path.
By including bonds in the thermal conductivity, a large number of new conductive paths were created, which make the thermal conductivity much more pronounced than would be expected based on the thermal conductivities of the uncompacted electrode with heat conducting bonds and the compacted electrode without heat conducting bonds. The heat conductivity of the uncompacted electrode using heat conducting bonds is mainly based on the bonds, while the heat conductivity of the compacted electrode without conducting bonds is exclusively based on particle–particle contacts. However, the compacted electrodes with the conducting bonds show better conductivity than would be expected based on the other two cases combined.
Again, in order to be sufficient for worst case estimation, a contact between the particles and the plates was only generated analogous to the steady-state calibration measurement. The simultaneous compression of the electrode during the calendering process would strongly accelerate the heating of the layer due to a better contacting within the electrode coating.
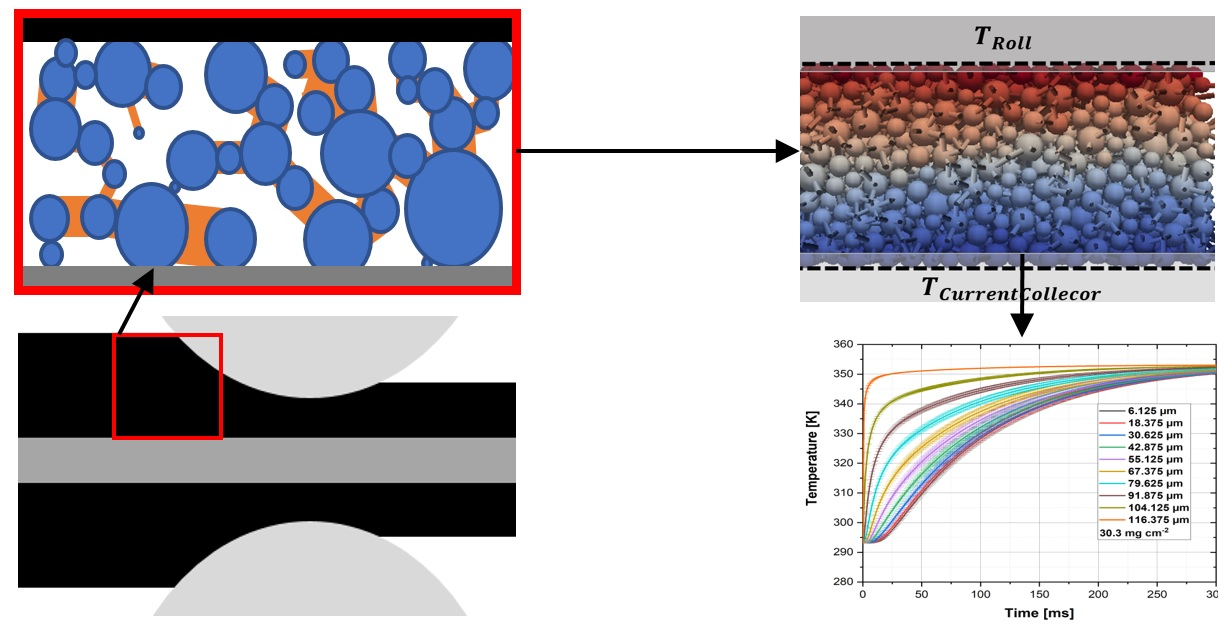
The heating behavior of electrodes with different weights per unit area is shown in Figure 5. The curves follow the same trend, with higher loaded electrodes showing slower heating behavior. The closer the layer is to the heat source, the larger the temperature gradient becomes. In the following, an electrode is assumed to be fully heated if the temperature difference to the temperature of the heat source is less than 10 K in all layers.
The heating time required for a complete heating should now be related to the complete contact time of an electrode in order to evaluate the possible advantage of preheating systems under the aspect of coating through heating. Aspects such as changes in web tension cannot be taken into account by this method but should be considered separately and included in the evaluation.
Following Meyer [25], the contact length of a surface element of a double-sided coated electrode with the calender roll till the point of maximum compression, at which the binder should be fully heated up, can estimated as
The radius of the calendering role is named , while and correspond to half the electrode thickness before calendering, in the calender gap, and after calendering.
Taking into account the line speed , the contact time can be estimated as
Table 3 shows the calculated contact times for the investigated electrodes (Table 2) for a compaction to approximately 3 g cm−3 using a calender with a roll diameter of 465 mm in relation to the respective heating times for different line speeds. An electrode is assumed to be fully heated as soon as the lowest particle segment temperature deviates less than 10 K from the heat source. It turns out that by increasing areal loading, the required heating time increases faster than the contact time with the calender roll. For a low line speed of 2 m min−1 at an areal loading of 20.1 mg cm−2, the heating time is 97.3% of the contact time, while at an areal loading of 30.3 mg cm−2 it is already 178.7%. For a line speed of 50 m min−1, the contact time between the calendering roll and electrode is less than 5% of the required heating time.
Against this background, preheating of the electrodes appears to be advantageous for ultra-thick cathodes or for very high line speeds.
However, considering all the worst case assumptions have been made, the real heating times should be significantly lower. In the long run, therefore, the simulation should be coupled with a calendering simulation. However, correctly calibrating the dependence of the mechanical behavior of the carbon black–binder matrix on the temperature is a major challenge. As it is normally calibrated iteratively by the overall mechanical behavior, an expected change in the stiffness and damping behavior of the electrode cannot be calibrated correctly with this method due to temperature gradients during the heated calendering process, so that in this work compaction during heating through has been omitted and the results therefore represent the worst possible thermal conductivity behavior of the electrode.
For the consideration of heated calender rolls on the calendering process, a uniform electrode temperature and thus uniform mechanical carbon black–binder matrix should be assumed first. For several temperatures in the range of the intermediate of the ambient and roll temperature, the mechanical parameters of the solid bridges should be calibrated separately. The calibration experiments should be carried out with the lowest possible line speeds so that the assumption of homogeneous temperature is as valid as possible. Subsequently, interpolation equations for the bridge stiffness and the damping behavior of the solid bridges as a function of temperature should be developed. These equations could be used to adjust the mechanical properties of the bonds dynamically during the calendering simulation with heated rolls. The implementation of such a strategy is the subject of ongoing work.
4. Conclusions
The model presented by Sangros et al. [13] for investigating the thermal conductivity of electrodes was not able to depict the influence of the carbon black–binder matrix on the heat conduction though a battery electrode. In this work, a modification to this electrode model was implemented that enables heat conduction though the carbon black–binder matrix, thus refraining from ignoring the inactive material volume. This removes the phenomena of thermally isolated particles, as observed in the initial model, resulting in a more realistic representation of the heat conduction through the electrode coatings.
Furthermore, a methodology was presented to obtain the unknown thermal conductivity of the carbon black–binder matrix, treating it as a calibration factor by adjusting the overall heat conduction coefficient of a model electrode using a steady state case. The extended model was used to evaluate the heating process of various electrodes. The results indicate that the interplay of particle–particle contacts and the carbon black–binder matrix dominates the heat conduction through electrodes rather than a single mechanism being dominant. This observation underlines the importance of the consideration of heat conduction through the carbon black–binder matrix.
The model represents a computationally fast and usable approach for larger structures to simulate the thermal conductivity of electrodes. It operates at a faster, larger but also less accurate scale compared to the finite element method simulation used by Oehler [18]. A later coupling with the Sangros [14] calendering model is possible. This could be a further step towards the goal of a simulation tool for the complete battery electrode production chain.
The developed model was used as a possible tool to evaluate heating behavior by using heated calendering rolls and can be adapted to the respective process (line speed) and the respective electrode. The influence of variations in areal loadings have been demonstrated in this study, but by adjusting the bond parameters (thermal conductivity, heat capacity, and bond volume) the model may be adopted to other electrode formulations too. The knowledge gained in this way can be used to estimate the need for preheating systems for different process speeds and electrode formulations and structures. Furthermore, the influence of the mass loading on the heating-through behavior has been investigated. Generally, it was observed that preheating might be more beneficial for thick electrodes and for very high line speeds.
Author Contributions
Conceptualization, M.L. and J.M.; methodology, M.L. and J.M.; software, J.M.; validation, J.M.; formal analysis, M.L. and J.M.; investigation, M.L. and J.M.; writing—original draft preparation, M.L.; writing—review and editing, M.L. and J.M.; visualization, M.L. and J.M.; supervision, A.K. and C.S.; funding acquisition, A.K. and C.S. All authors have read and agreed to the published version of the manuscript.
Funding
This research was funded by Federal Ministry for Education and Research (BMBF) grant number 03XP0242A (Sim4Pro) and the European Commission grant agreement Nº875247 (DeFacto).
Institutional Review Board Statement
Not applicable.
Informed Consent Statement
Not applicable.
Data Availability Statement
The data presented in this study are available on request from the corresponding author.
Acknowledgments
We acknowledge support by the Open Access Publication Funds of Technische Universität Braunschweig. Furthermore, we would like to thank Alexander Diener for providing electrode data and Christine Burmeister for her valuable assistance.
Conflicts of Interest
The authors declare no conflict of interest.
Appendix A

Table A1.
Number of particles of each size fraction used for each areal loading.
| Particle Diameter [µm] | 20.1 mg cm−2 | 25.2 mg cm−2 | 30.3 mg cm−2 |
|---|---|---|---|
| 6.5 | 293 | 367 | 441 |
| 7.58 | 452 | 567 | 682 |
| 8.6 | 539 | 675 | 812 |
| 9.82 | 787 | 986 | 1186 |
| 11.35 | 624 | 782 | 940 |
References
- Kwade, A.; Haselrieder, W.; Leithoff, R.; Modlinger, A.; Dietrich, F.; Droeder, K. Current status and challenges for automotive battery production technologies. Nat. Energy 2018, 3, 290–300. [Google Scholar] [CrossRef]
- Bockholt, H.; Haselrieder, W.; Kwade, A. Intensive Dry and Wet Mixing Influencing the Structural and Electrochemical Properties of Secondary Lithium-Ion Battery Cathodes. ECS Trans. 2013, 50, 25–35. [Google Scholar] [CrossRef]
- Kitamura, K.; Tanaka, M.; Mori, T. Effects of the mixing sequence on the graphite dispersion and resistance of lithium-ion battery anodes. J. Colloid Interface Sci. 2022, 625, 136–144. [Google Scholar] [CrossRef] [PubMed]
- Jaiser, S.; Funk, L.; Baunach, M.; Scharfer, P.; Schabel, W. Experimental investigation into battery electrode surfaces: The distribution of liquid at the surface and the emptying of pores during drying. J. Colloid Interface Sci. 2017, 494, 22–31. [Google Scholar] [CrossRef]
- Jaiser, S.; Friske, A.; Baunach, M.; Scharfer, P.; Schabel, W. Development of a three-stage drying profile based on characteristic drying stages for lithium-ion battery anodes. Dry. Technol. 2016, 35, 1266–1275. [Google Scholar] [CrossRef]
- Kumberg, J.; Müller, M.; Diehm, R.; Spiegel, S.; Wachsmann, C.; Bauer, W.; Scharfer, P.; Schabel, W. Drying of Lithium-Ion Battery Anodes for Use in High-Energy Cells: Influence of Electrode Thickness on Drying Time, Adhesion, and Crack Formation. Energy Technol. 2019, 7, 1900722. [Google Scholar] [CrossRef]
- Schreiner, D.; Oguntke, M.; Günther, T.; Reinhart, G. Modelling of the Calendering Process of NMC-622 Cathodes in Battery Production Analyzing Machine/Material–Process–Structure Correlations. Energy Technol. 2019, 7, 1900840. [Google Scholar] [CrossRef]
- Lu, X.; Daemi, S.R.; Bertei, A.; Kok, M.D.; O’Regan, K.B.; Rasha, L.; Park, J.; Hinds, G.; Kendrick, E.; Brett, D.J.; et al. Microstructural Evolution of Battery Electrodes During Calendering. Joule 2020, 4, 2746–2768. [Google Scholar] [CrossRef]
- Meyer, C.; Weyhe, M.; Haselrieder, W.; Kwade, A. Heated Calendering of Cathodes for Lithium-Ion Batteries with Varied Carbon Black and Binder Contents. Energy Technol. 2019, 11, 1900175. [Google Scholar] [CrossRef]
- Castagnet, S.; Gacougnolle, J.-L.; Dang, P. Correlation between macroscopical viscoelastic behaviour and micromechanisms in strained α polyvinylidene fluoride (PVDF). Mater. Sci. Eng. 2000, 276, 152–159. [Google Scholar] [CrossRef]
- Ngandjong, A.C.; Lombardo, T.; Primo, E.N.; Chouchane, M.; Shodiev, A.; Arcelus, O.; Franco, A.A. Investigating electrode calendering and its impact on electrochemical performance by means of a new discrete element method model: Towards a digital twin of Li-Ion battery manufacturing. J. Power Sources 2021, 485, 229320. [Google Scholar] [CrossRef]
- Sangrós Giménez, C.; Finke, B.; Nowak, C.; Schilde, C.; Kwade, A. Structural and mechanical characterization of lithium-ion battery electrodes via DEM simulations. Adv. Powder Technol. 2018, 29, 2312–2321. [Google Scholar] [CrossRef]
- Sangrós, C.; Schilde, C.; Kwade, A. Effect of Microstructure on Thermal Conduction within Lithium-Ion Battery Electrodes using Discrete Element Method Simulations. Energy Technol. 2016, 4, 1611–1619. [Google Scholar] [CrossRef]
- Sangrós Giménez, C.; Finke, B.; Schilde, C.; Froböse, L.; Kwade, A. Numerical simulation of the behavior of lithium-ion battery electrodes during the calendaring process via the discrete element method. Powder Technol. 2019, 349, 1–11. [Google Scholar] [CrossRef]
- Schreiner, D.; Klinger, A.; Reinhart, G. Modeling of the Calendering Process for Lithium-Ion Batteries with DEM Simulation. Procedia CIRP 2020, 93, 149–155. [Google Scholar] [CrossRef]
- Kloss, C.; Goniva, C.; Hager, A.; Amberger, S.; Pirker, S. Models, algorithms and validation for opensource DEM and CFD-DEM. Prog. Comput. Fluid Dyn. Int. J. 2012, 12, 140. [Google Scholar] [CrossRef]
- Chaudhuri, B.; Muzzio, F.J.; Tomassone, M.S. Modeling of heat transfer in granular flow in rotating vessels. Chem. Eng. Sci. 2006, 61, 6348–6360. [Google Scholar] [CrossRef]
- Oehler, D.; Seegert, P.; Wetzel, T. Modeling the Thermal Conductivity of Porous Electrodes of Li-Ion Batteries as a Function of Microstructure Parameters. Energy Technol. 2020, 9, 2000574. [Google Scholar] [CrossRef]
- Sun, H.; Zhao, K. Electronic Structure and Comparative Properties of LiNixMnyCozO2 Cathode Materials. J. Phys. Chem. 2017, 121, 6002–6010. [Google Scholar] [CrossRef]
- Peet, M.J.; Hasan, H.S.; Bhadeshia, H.K.D.H. Prediction of thermal conductivity of steel. Int. J. Heat Mass Transf. 2011, 54, 2602–2608. [Google Scholar] [CrossRef] [Green Version]
- Diener, A.; Ivanov, S.; Haselrieder, W.; Kwade, A. Evaluation of Deformation Behavior and Fast Elastic Recovery of Lithium-Ion Battery Cathodes via Direct Roll-Gap Detection During Calendering. Energy Technol. 2022, 10, 2101033. [Google Scholar] [CrossRef]
- Hamilton, R.L.; Crosser, O.K. Thermal Conductivity of Heterogeneous Two-Component Systems. Ind. Eng. Chem. Fund. 1962, 1, 187–191. [Google Scholar] [CrossRef]
- Mayer, J.; Bockholt, H.; Kwade, A. Inner Carbon Black Porosity as Characteristic Parameter for the Microstructure of Lithium-Ion Electrodes and its Effect on Physical and Electrochemical Properties. J. Power Sources 2022, 529, 231259. [Google Scholar] [CrossRef]
- Wenzel, V.; Nirschl, H.; Nötzel, D. Challenges in Lithium-Ion-Battery Slurry Preparation and Potential of Modifying Electrode Structures by Different Mixing Processes. Energy Technol. 2015, 3, 692–698. [Google Scholar] [CrossRef]
- Meyer, C. Prozessmodellierung der Kalandrierung von Lithium-Ionen-Batterie-Elektroden. Ph.D. Thesis, Technische Universität Braunschweig, Braunschweig, Germany, 2019. [Google Scholar]
Figure 1.
Example for a simulated model electrode. Bonds are displayed as cylinders between the spherical particles. Temperature of the respective particle or bond is represented by color. The position of the plates representing the roll (top) and the current collector (bottom) relative to the electrode is depicted in grey. The dashed lines represent the upper and lower surface of the electrode.

Figure 2.
Method to determine the thermal conductivity of the model electrode. Particles shown in blue, carbon black–binder matrix (CBM) in orange, and the heat source and sink in black and grey, respectively.
Figure 2.
Method to determine the thermal conductivity of the model electrode. Particles shown in blue, carbon black–binder matrix (CBM) in orange, and the heat source and sink in black and grey, respectively.

Figure 3.
Temperature distribution at a steady state for uncompressed electrodes (top); compressed electrodes (bottom); using the alter approach (left) [13] and using the new approach (right).
Figure 3.
Temperature distribution at a steady state for uncompressed electrodes (top); compressed electrodes (bottom); using the alter approach (left) [13] and using the new approach (right).

Figure 4.
Comparison of the heating behavior of compressed electrodes using the old (without bonds) and the new (with bonds) approach.
Figure 4.
Comparison of the heating behavior of compressed electrodes using the old (without bonds) and the new (with bonds) approach.

Figure 5.
Temperature at different positions (see legend) along the electrode height for different areal loadings.
Figure 5.
Temperature at different positions (see legend) along the electrode height for different areal loadings.

Table 1.
Structural parameters of the model cathodes.
| NMC | Carbon Black–Binder Domain | Aluminum | Steel | |
|---|---|---|---|---|
| Heat conductivity [W m−1 K−1] | 4.3 | Subject of calibration process | 235 | 20 |
| Heat capacity [J kg−1 K−1] | 700 | 954 | 896 | 473 |
| Density [g cm−3] | 4.74 | 1.75 | 2.7 | 7.8 |
Table 2.
Structural parameters of the model cathodes.
| Mass loading [mg cm−2] | 20.1 | 25.2 | 30.3 |
| Porosity [-] | 42.9 | 42.6 | 41.5 |
| Density [g cm−3] | 2.44 | 2.45 | 2.46 |
| Coating thickness [µm] | 82.0 | 102.4 | 123.0 |
Table 3.
Contact times between roll and electrode and the respective heating up times for different areal loadings assuming a line speed of 2 m min−1 and 50 m min−1 neglecting the looping of the electrode and the roller.
Table 3.
Contact times between roll and electrode and the respective heating up times for different areal loadings assuming a line speed of 2 m min−1 and 50 m min−1 neglecting the looping of the electrode and the roller.
| Areal Loading [mg cm−2] | Contact Time with Roll at 2 m min−1 till Maximum Compression [ms] | Contact Time with Roll at 50 m min−1 till Maximum Compression [ms] | Heating Up Time [ms] |
|---|---|---|---|
| 20.1 | 86.37 | 3.45 | ~84 |
| 25.2 | 93.21 | 3.73 | ~114 |
| 30.3 | 101.83 | 4.07 | ~182 |
Publisher’s Note: MDPI stays neutral with regard to jurisdictional claims in published maps and institutional affiliations. |
© 2022 by the authors. Licensee MDPI, Basel, Switzerland. This article is an open access article distributed under the terms and conditions of the Creative Commons Attribution (CC BY) license (https://creativecommons.org/licenses/by/4.0/).
Share and Cite
MDPI and ACS Style
Lippke, M.; Meister, J.; Schilde, C.; Kwade, A. Preheating of Lithium-Ion Battery Electrodes as Basis for Heated Calendering—A Numerical Approach. Processes 2022, 10, 1667. https://doi.org/10.3390/pr10081667
AMA Style
Lippke M, Meister J, Schilde C, Kwade A. Preheating of Lithium-Ion Battery Electrodes as Basis for Heated Calendering—A Numerical Approach. Processes. 2022; 10(8):1667. https://doi.org/10.3390/pr10081667
Chicago/Turabian StyleLippke, Mark, Jakob Meister, Carsten Schilde, and Arno Kwade. 2022. "Preheating of Lithium-Ion Battery Electrodes as Basis for Heated Calendering—A Numerical Approach" Processes 10, no. 8: 1667. https://doi.org/10.3390/pr10081667
Note that from the first issue of 2016, this journal uses article numbers instead of page numbers. See further details here.