
Mitochondrial genomes of twelve species of hyperdiverse Trigonopterus weevils
- Published
- Accepted
- Received
- Academic Editor
- Joseph Gillespie
- Subject Areas
- Entomology, Genomics, Zoology
- Keywords
- Cryptorhynchinae, Curculionidae, Mitochondrial genomes, Next generation sequencing, Phylogenetic analysis
- Copyright
- © 2020 Narakusumo et al.
- Licence
- This is an open access article distributed under the terms of the Creative Commons Attribution License, which permits using, remixing, and building upon the work non-commercially, as long as it is properly attributed. For attribution, the original author(s), title, publication source (PeerJ) and either DOI or URL of the article must be cited.
- Cite this article
- 2020. Mitochondrial genomes of twelve species of hyperdiverse Trigonopterus weevils. PeerJ 8:e10017 https://doi.org/10.7717/peerj.10017
Abstract
Mitochondrial genomes of twelve species of Trigonopterus weevils are presented, ten of them complete. We describe their gene order and molecular features and test their potential for reconstructing the phylogeny of this hyperdiverse genus comprising > 1,000 species. The complete mitochondrial genomes examined herein ranged from 16,501 bp to 21,007 bp in length, with an average AT content of 64.2% to 69.7%. Composition frequencies and skews were generally lower across species for atp6, cox1-3, and cob genes, while atp8 and genes coded on the minus strand showed much higher divergence at both nucleotide and amino acid levels. Most variation within genes was found at the codon level with high variation at third codon sites across species, and with lesser degree at the coding strand level. Two large non-coding regions were found, CR1 (between rrnS and trnI genes) and CR2 (between trnI and trnQ), but both with large variability in length; this peculiar structure of the non-coding region may be a derived character of Curculionoidea. The nad1 and cob genes exhibited an unusually high interspecific length variation of up to 24 bp near the 3′ end. This pattern was probably caused by a single evolutionary event since both genes are only separated by trnS2 and length variation is extremely rare in mitochondrial protein coding genes. We inferred phylogenetic trees using protein coding gene sequences implementing both maximum likelihood and Bayesian approaches, each for both nucleotide and amino acid sequences. While some clades could be retrieved from all reconstructions with high confidence, there were also a number of differences and relatively low support for some basal nodes. The best partition scheme of the 13 protein coding sequences obtained by IQTREE suggested that phylogenetic signal is more accurate by splitting sequence variation at the codon site level as well as coding strand, rather than at the gene level. This result corroborated the different patterns found in Trigonopterus regarding to A+T frequencies and AT and GC skews that also greatly diverge at the codon site and coding strand levels.
Introduction
The hyperdiverse weevil genus Trigonopterus Fauvel has been the focus of a research project covering its taxonomy (Riedel, 2010; Riedel, 2011), ecology (Riedel, Daawia & Balke, 2010; Tänzler et al., 2012; Letsch et al., 2020a), biogeography (Tänzler et al., 2014; Tänzler et al., 2016), and functional morphology (Van de Kamp et al., 2011; Van de Kamp et al., 2014; Van de Kamp et al., 2015). To date, there exist 451 described species, but more species are undergoing formal taxonomic description, suggesting that the number of existing species may exceed by far the known number. Since additional fieldwork shows no sign of saturation of species discovery (A Riedel, pers. comm., 1990–2019) the number of existing species may exceed 2,000 or even 3,000 species. An integrative approach has been applied to make species descriptions and diagnoses more efficient (Riedel et al., 2013a), largely relaying on cox1 sequences for sorting and identifying specimens, also known as “DNA barcoding” (Hebert et al., 2003). Combining this technique with traditional morphological taxonomy, the number of described species could be increased significantly (Riedel et al., 2013b; Riedel et al., 2014; Riedel & Tänzler, 2016; Riedel & Narakusumo, 2019; Van Dam, Laufa & Riedel, 2016).
All Trigonopterus species are apterous (Van de Kamp et al., 2015) and of limited dispersal ability. Their cumulative distribution roughly encompasses the area between Sumatra, Samoa, the Philippines, and New Caledonia, presumably with the center of species diversity in New Guinea. Distribution patterns are of great value to historical biogeography of the Indo-Australian Archipelago: studies on the colonization of Sundaland (Tänzler et al., 2016; Letsch et al., 2020a; Letsch et al., 2020b) and New Caledonia (Toussaint et al., 2017) have relied on multi-marker datasets generated by PCR and Sanger sequencing, e.g., the mitochondrial genes cox1 and rrnL (16S), and the nuclear genes arginine kinase (AK), carbamoyl synthase (CAD), Enolase (EN), and histone 4 (H4). With the advent and increasing use of next generation sequencing (NGS) techniques (Voelkerding, Dames & Durtschi, 2009), our earlier approach of PCR and Sanger sequencing of short DNA fragments appeared no longer efficient, respectively cost-effective and we looked for alternative ways generating datasets on the Illumina platform. A genome-skimming approach (Straub et al., 2012) targeting mitochondrial genomes appeared promising for three reasons: first, the costs were reasonable. Second, a mitogenome dataset would provide a reasonable overlap with our previous sequencing data including short mitochondrial sequences (cox1 and rrnL). Third, mitogenomes had been used successfully to resolve phylogenies of weevils (Haran, Timmermans & Vogler, 2013; Gillett et al., 2014), so datasets should contain sufficient signal to resolve relationships within a single genus.
Mitochondrial genomes (mitogenomes) in beetles, and most metazoans, usually contain 13 protein coding genes (PCGs), 22 transfer RNA (tRNA), two subunits of ribosomal RNA (rRNA) and a control region, which gene order is similar to the ancestral insect mitogenome (Cameron, 2014a; Cameron, 2014b). This composition of 37 genes and a control region is well-conserved in the bilaterian animals (Bernt et al., 2012), though there are rare deviations from this general pattern. In beetles, they involve gene order reversal and presumably deletion of tRNA genes (Timmermans & Vogler, 2012; Liu et al., 2019) and in rare cases rearrangements of PCGs genes, e.g., in Iberobaenia sp. (Iberobaemidae) (Andujar et al., 2016) and Omus cazieri (Carabidae) (López-López & Vogler, 2017). Insect mitogenomes are generally AT-rich including a large non-coding region with even higher AT content, which contains the origins of replication and transcription (Cameron, 2014b; Bernt et al., 2012). Mitochondrial genomes were used to produce phylogenies of many arthropod groups, e.g., beetles (Linard et al., 2018; Timmermans et al., 2016; Yuan et al., 2016), crustaceans (Stokkan et al., 2018), hymenopterans (Tang et al., 2019), and stone flies (Ding et al., 2019) just to name a few. The main advantages of mitogenomes over nuclear genes in molecular systematics stems from (1) the technical ease of sequencing, even of old museum specimens (Gilbert et al., 2007) and subfossil remnants (Brown et al., 2016) due to a much higher number of copies compared to nuclear genes; (2) a fairly conserved structure and genes missing introns (Cameron, 2014a; Cameron, 2014b); this makes annotation and alignment of genes straightforward and easier compared to nuclear genes (3) an increased evolutionary rate useful in diagnosis and phylogenetic reconstruction of closely related species (DeSalle, Schierwater & Hadrys, 2017). Unfortunately, there are also some drawbacks summarized by Rubinoff, Cameron & Will (2006). Most seriously, gene trees may differ from species trees due to hybridization and incomplete lineage sorting (Edwards, 2009; Maddison, 1997). Since mitochondrial genes are linked and behave as a single marker, a multispecies coalescent approach (Liu et al., 2016) potentially solving these issues cannot be taken. However, facing millions of species (most of them arthropods) that need an improved phylogenetic placement, mitogenomes are our first choice. Approaches using nuclear genes requiring more resources can always follow as a second step for taxa of special interest.
Trigonopterus belongs to the hidden snout weevils, Cryptorhynchinae (Riedel et al., 2016; Letsch et al., 2020a; Letsch et al., 2020b). To date, there exist only two published mitochondrial genomes of this subfamily, i.e., two species of the genus Eucryptorrhynchus (Liu et al., 2016). Herein, we describe the complete mitogenomes of twelve Trigonopterus species from Sulawesi and the Tanimbar Archipelago and test their potential for reconstructing the phylogeny of this hyperdiverse genus.
Materials & Methods
Selection of specimens and DNA extraction
Twelve Indonesian Trigonopterus species were selected from the fauna of Sulawesi (Riedel & Narakusumo, 2019) and the Tanimbar Archipelago (Narakusumo, Balke & Riedel, 2019): T. carinirostris Riedel (ARC3221), T. jasminae Riedel (ARC2804), T. kotamobagensis Riedel (ARC2888), T. porg Narakusumo & Riedel (MZB0043-m), T. selaruensis Narakusumo & Riedel (MZB0023-m), T. singkawangensis Riedel (ARC2547), T. tanimbarensis Narakusumo & Riedel (MZB0028-m), T. triradiatus Narakusumo & Riedel (MZB0029-m), T. sp. 1113 (MZB0052-m), Trigonopterus sp. 1114 (MZB0053-m), Trigonopterus sp. 1115 (MZB0110-m), and Trigonopterus sp. 1116 (MZB0099-m). Vouchers starting with accession numbers “ARC” are deposited at the State Museum of Natural History Karlsruhe (SMNK), vouchers starting with “MZB” are deposited at Museum Zoologicum Bogoriense (MZB). Trigonopterus is not regulated or protected species in Indonesia. We obtained a permission letter to enter conservation areas issued by Center for National Resources (BKSDA, Ministry of Forestry and Environment No.: S.359/IV-K.30/PKA.1.0/2018), and a permission letter to collect and transport wildlife for research purposes (BKSDA, Ministry of Forestry and Environment: No.: B.1550/IPH.1/AP.01/III/2018). A shipping invoice for loan specimens was issued by the Museum Zoologicum Bogoriense (Research Center for Biology, Indonesia Institute of Sciences: Register file no. 13/SI/MZB/2018).
Species were selected to represent different clades and maximize phylogenetic diversity based on a preliminary phylogeny of cox1 sequences comprising a larger species number. For earlier extractions (ARC2547, ARC2804, ARC2888, ARC3221) whole genome DNA was extracted non-destructively from entire specimens using Qiagen DNeasy DNA extraction kits (Qiagen, Hilden, Germany) as described by Riedel, Daawia & Balke (2010). For later extractions (MZB), we used head and prothorax only, excluding the proventriculus and other parts of the digestive track, thus reducing the amount of bacterial DNA contained in these organs.
Sample preparation and sequencing
Sequencing libraries were prepared with the Nextera DNA Flex® Library Prep kit (Illumina, San Diego, CA, USA). Procedures were followed the manufacturer’s protocol except that only half of the recommended volumes were used, i.e., starting with 15 µl of genomic DNA template containing 1.5–5.0 ng DNA. Resulting libraries were quantified using a Qubit® 3.0 Fluorometer with the dsDNA HS assay kit (Thermo Fisher Scientific, Waltham, MA, USA). Fragment distribution of libraries was examined using a Fragment Analyzer® dsDNA 910 kit (Agilent Technologies, Santa Clara, CA, USA) for a range of 35 to 1,500 bp. Based on the concentration and the average size distribution, the molar concentration was calculated for each sample. The twelve samples of this project were pooled in equimolar amounts together with other 84 samples and submitted to Macrogen Inc. (Seoul, South Korea) for sequencing on one lane of an Illumina Hiseq Xten for 2 x 150 bp.
Mitogenome assembly and annotation
Adapters and poor quality ends of Illumina reads were trimmed using the BBDuk (Bushnell, 2016) implemented as plugin for Geneious Prime® 2019.1.3 (Biomatters Ltd, Auckland, New Zealand). Quality of trimmed reads was checked in FastQC (Andrews, 2010). Reads for each species-specific library have been deposited in the BioProject PRJNA642015. The paired ends reads were de novo assembled using Novoplasty 3.7 (Dierckxsens, Mardulyn & Smits, 2017). The sequence of the mitochondrial cox1 gene of each Trigonopterus species was used as seed, and the Trigonopterus trigonopterus mitochondrial genome (AP Vogler, pers. comm., 2015) as reference sequence. We implemented default settings in Novoplasty except for a kmer value of 29. The integrity and circularity of each mitogenome was then assessed by interactively mapping only those paired-reads with a minimum length of 240 bp to the consensus sequence of each mito-contig in Geneious Prime with custom sensitivity, a minimum overlap of 60 bp, and a minimum overlap identity of 98%. If necessary, the resulting consensus sequence was trimmed and the process repeated until overlap was established by ends showing an identical sequence of at least 100 bp. Mitogenome contigs obtained in Geneious Prime were exported in bam format and parsed to pileup format using samtools v1.8 (Li et al., 2009) to finally estimate coverage with the Perl script calculate-coverage+GC.pl (http://www.popoolation.at/mauritiana_genome/scripts/) using a window size of 100 bp and a step size of 50 bp. The MITOS2 server (Bernt et al., 2013; Donath et al., 2019) was used for preliminary annotations. Furthermore, the precise boundaries of protein coding genes (PCGs), tRNA, and rRNA were determined by aligning the individual genes with MUSCLE v3.8.1551 (Edgar, 2004) as implemented in Seaview v4.7 (Gouy, Guindon & Gascuel, 2010). We used the annotated gene sequences of other beetle mitogenomes available in Genbank as references to assess the 5′ and 3′ ends of PCGs and rRNAs: Tribolium castaneum, NC_003081 (Friedrich & Muqim, 2003), Eucryptorhynchus brandti, NC_025945 (Nan, Wei & He, 2016), Eucryptorrhynchus chinensis NC_026719 (Liu et al., 2016), Anoplophora glabripennis, DQ768215 (unpublished), Sphenophorus sp., GU176342 (Song et al., 2010), Naupactus xanthographus GU176345 (Song et al., 2010), Rhynchophorus ferrugineus, KT428893 (Zhang et al., 2017), Sitophilus oryzae, KX373615 (Ojo et al., 2016). The annotation of each tRNA gene was validated as accurate if its secondary structure matched the canonical cloverleaf structure of tRNAs in metazoans. Nucleotide and amino acid frequencies and skews were calculated using an in-house developed python2 script (mitocomposition.py v. beta1, Data S1) including biopython modules (Cock et al., 2009). Intra-strand composition skews were calculated based on formulas proposed by Perna & Kocher (1995); AT-skew = (A − T) / (A + T) and GC-skew = (G − C) / (G + C). Box plots and heat maps were obtained using python libraries matlibplot, numpy and seaborn. We used the programs einverted, equicktandem, etandem, and palindrome included in the EMBOSS suite v6.6.0.0 using default parameters (Rice, Longden & Bleasby, 2000) to find repetitive sequences on non-coding regions. Control regions were highly divergent and thus aligned with BlastAlign (https://bioconda.github.io/recipes/blastalign/README.html), which can detect conserved regions using local alignments. Effective Number of Codons (ENC), GC frequencies at 3rd codon positions, and Measure Independent of Length and Composition (MILC) were calculated in INCA v2.1 (Supek & Vlahoviček, 2004). ENC values can vary from 62, since stop codons TAA and TAG are excluded, when all possible codons are used (i.e., no codon usage bias) to as low as 20 when one single codon is used per amino acid. Some studies demonstrated that length and nucleotide composition of sequences were factors introducing noise to the ENC estimates (Supek & Vlahoviček, 2004). Thus, they suggested MILC formula to calculate codon usage bias since is not affected by length and nucleotide composition. MILC values close to 0.5 indicate that all codons are used (ENC 62), and values higher than 1.9 indicate that few codons are used (ENC 26), i.e., there is strong codon bias (Supek & Vlahoviček, 2004).
Phylogenetic analyses and estimation of divergence times
Best partition schemes and substitution models (-TESTMERGE), tree topology reconstruction, and node supports (1,000 fast bootstrap replicates, alrt 0, and abayes), were performed under Maximum Likelihood (ML) in IQTREE v1.6.10 (Nguyen et al., 2015). Best partition schemes and substitution models were selected based on the lowest Bayesian Information Criterion (BIC) values as implemented in IQTREE. Tree topology and branch lengths were also built in MrBayes v3.2.6 (Ronquist et al., 2012) with 30 million generations, sampling every 5,000th ensuring ESS values were above 200 after 25% of burnin. The consensus tree in MrBayes was obtained with the command “Allcompat” that adds all compatible groups to such a tree, and its branch lengths were averaged over those sampled trees in which that branch was present. The mitochondrial sequences of two species of the genus Eucryptorhynchus, a member of Cryptorhynchinae (Letsch et al., 2020a) like Trigonopterus, were included as outgroup representatives: E. brandti (NC_025945), and E. chinensis (NC_026719). The topological tree symmetry was calculated using the total cophenetic index (Mir, Rosselló & Rotger, 2013) and nucleotide substitution saturation implementing Xia’s test (Xia et al., 2003).
Divergence times were estimated in BEAST v1.10.4 (Suchard et al., 2018) by running two independent analyses of 100 million generations, sampling every 5,000th. After discarding 10% of the samples as burnin, convergence of the runs was assessed in Tracer v1.7 (Rambaut et al., 2018) ensuring parameter values reached effective sample size (ESS) above 200 after convergence. Independent runs were combined in a single file using LogCombiner. Besides, mean values and 95% confidence intervals of parameters and ages of combined runs were estimated using the “maximum clade credibility” tree in TreeAnnotator. Different clock relaxations were statistically compared based on Bayes Factors (BFs) estimated from marginal likelihoods under the path-sampling scheme as implemented in BEAST. We performed 40 steps of one million generations each using a path scheme with a betaQuantile 0.33 (Baele et al., 2012), discarding 25% of each step as burn-in. The tree was calibrated based on the age of the most recent common ancestor (mrca) of Trigonopterus excluding the T. squamosus-, the T. scissops- and the T. bisinuatus-group as estimated by Letsch et al. (2020a) and Letsch et al. (2020b): mean 45.88 (42.31–48.10) Ma. We implemented this event as a log-normal distribution prior in real space with a mean of 45.88 Ma and standard deviation of 1.5.
Results
The mitochondrial genomes of ten Trigonopterus species studied here were complete and circular DNA molecules which ranged from 16,501 bp in Trigonopterus sp. 1115 to 21,007 bp in T. carinirostris (Table 1). Accession numbers and nucleotide compositions for each mitogenome are detailed in Table 1. The mitochondrial sequences of the other two species, T. selaruensis and T. porg, were partial because their control region could not be completed. The mean coverage of mitogenome contigs was >800x in Trigonopterus sp. 1114, and >400x in Trigonopterus sp. 1116; in most species, it ranged between 100x and 200x, while it was <50x in T. carinirostris (Table 1). The plot of coverage across mitogenome contigs (Fig. S1) and their standard deviations (Table 1) showed that coverage values may differ greatly in adjacent regions. Sliding windows of 100 bp indicated the following minimum coverages: e.g., T. jasminae 15x, T. tanimbarensis 13x, T. carinirostris 13x, and T. sp. 1113 12x (Table 1). The mitogenomes harbored the typical metazoan gene set consisting of 37 genes: thirteen protein-coding genes (PCGs), 22 tRNAs and two ribosomal genes, with 23 genes coded on the plus strand and 14 on the minus strand (Fig. 1). The gene order was identical to that described in most beetles and considered the ancestral pattern in pancrustaceans (Boore, 1999; Boore, Lavrov & Brown, 1998). As previously described in beetles and other arthropods, Trigonopterus mitogenomes were also A+T rich with percentages ranging from 64.2% to 71.2% (Table 1). At the gene level, atp8, nad1-6, and all RNA coding genes showed higher A+T values than atp6, cox1-3, and cob genes (Fig. 2A, Table S1). PCGs also differed in AT richness among codon positions. A+T values increased from 1st to 3rd codon sites of genes coded on the plus strand (Fig. 2B). On the other hand, codon sites of genes on the minus strand had high values similar to those found in 3rd codon sites of genes on the plus strand. Interspecific variation in A+T contents was higher in PCGs and lower in RNA coding genes; at the codon level it was low in the 1st and 2nd codon sites but very high in the 3rd codon sites (Figs. 2A–2B, Table S1).
| coverage | ||||||||||||
|---|---|---|---|---|---|---|---|---|---|---|---|---|
| Species | Acronym | GenBank | SRA | Biosample | Length | Average | Stdev | Min | Max | A+T | AT skew | GC skew |
| T. carinirostris | ARC3221 | MT653608 | SRR12124845 | SAMN15395793 | 21,007 | 39 | 13 | 13 | 83 | 0.683 | 0.157 | −0.176 |
| Trigonopterus sp. 1116 | MZB0099 | MT653610 | SRR12124852 | SAMN15376232 | 18,825 | 446 | 123 | 46 | 912 | 0.669 | 0.110 | −0.356 |
| Trigonopterus sp. 1113 | MZB0052 | MT653604 | SRR12124843 | SAMN15395797 | 18,442 | 202 | 115 | 12 | 547 | 0.667 | 0.077 | −0.276 |
| T. kotamobagensis | ARC2888 | MT653609 | SRR12124846 | SAMN15395792 | 18,038 | 281 | 85 | 50 | 545 | 0.693 | 0.047 | −0.373 |
| T. jasminae | ARC2804 | MT653603 | SRR12124849 | SAMN15395791 | 17,417 | 156 | 52 | 15 | 304 | 0.642 | 0.071 | −0.288 |
| T. tanimbarensis | MZB0028 | MT653601 | SRR12124847 | SAMN15395794 | 16,993 | 98 | 42 | 13 | 282 | 0.697 | 0.107 | −0.290 |
| Trigonopterus sp. 1114 | MZB0053 | MT653606 | SRR12124851 | SAMN15376233 | 16,893 | 819 | 261 | 119 | 1,676 | 0.696 | 0.114 | −0.343 |
| T. triradiatus | MZB0029 | MT653605 | SRR12124844 | SAMN15395795 | 16,795 | 338 | 72 | 46 | 476 | 0.667 | 0.073 | −0.361 |
| T. singkawangensis | ARC2547 | MT653607 | SRR12124850 | SAMN15395790 | 16,742 | 186 | 42 | 24 | 297 | 0.689 | 0.127 | −0.362 |
| Trigonopterus sp. 1115 | MZB0110 | MT653602 | SRR12124842 | SAMN15375528 | 16,501 | 114 | 26 | 29 | 182 | 0.675 | 0.075 | −0.317 |
| T. selaruensis | MZB0023 | MT653600 | SRR12124853 | SAMN15376231 | >15,529 | 252 | 99 | 20 | 617 | 0.691 | 0.090 | −0.298 |
| T. porg | MZB0043 | MT653611 | SRR12124848 | SAMN15395796 | >15,346 | 207 | 55 | 26 | 396 | 0.712 | 0.031 | −0.299 |
Complete mitochondrial genomes possess slightly positive AT skews (Fig. 2C), i.e., an intra-strand surplus of As over Ts ranging from 0.031 to 0.157. On the other hand, GC skews showed the opposite trend with negative values from −0.373 to −0.176, i.e., an intra-strand lack of Gs over Cs. A closer look at the gene level revealed slightly positive AT skew values for PCGs genes coded at the plus strand and RNA coding genes, and high negative values for those genes coded on the minus strand (Fig. 2C, Table S1). The same pattern was observed at the codon level except that the 2nd codon sites of genes at the plus strand showed higher negative AT skew values compared to codon sites of genes of the minus strand (Fig. 2D). The GC skew showed the opposite trend to AT skew at both gene and codon levels with negative values for PCGs coded at the plus strand and RNA coding genes, whereas those coded on the opposite strand had positive values (Fig. 2E). Across species, AT and GC skews revealed lower divergences at the 1st and 2nd codon sites, but higher for the 3rd codon sites on genes coded on the minus strand (Figs. 2D, 2F).
The most frequent amino acids were Leu, Ser, Ile, and Phe, which accounted for about 50% of the set of 20 amino acids while others such as Cys, Asp, Glu, and Arg were extremely rare (Fig. 3, Table S2). Variation across genes was quite low for atp6, cox1-3, and cob genes, and a bit higher for some nad genes such as nad3, nad4L and nad6 (Fig. 3, Table S2). The gene atp8 showed extremely high divergence at the amino acid frequencies across species maybe because it is very short (159 bp) and most of its sequence is located outside of the mitochondrial membrane (see http://www.ianlogan.co.uk/TMRjpgs/tmrpage.htm). Most PCGs (56.41%) started with the canonical codon ATA (37) and ATG (51) whereas the large remaining fraction (68) begun with non-canonical start codons such as ATT, ATC, TTG, CTG, GTG, and GTA. The latter differ by one nucleotide relative to the canonical ones, and were already described elsewhere as putative non-canonical start codon (Pons et al., 2014). In very few genes, the starting codon were GTC, ACT, and ACG, the latter being rare but known in few other species. The stop codons were the canonical TAA (98) and TAG (36) for most genes (85.89%) while the remaining ones had truncated stop codons (22). The Effective Number of Codons (ENC) ranged from 53.473 to 43.525 indicating that codon bias usage is not extremely high. The analysis of the codon frequencies showed that codons with 3rd sites including A or T were more used than those including G or C. In fact, there is a positive correlation between ENC values and GC frequencies at 3rd codon positions, i.e., higher GC content is correlated with higher numbers of codons used (ENC values, Fig. 4). The MILC values ranged from 0.499 to 0.538, which corroborated the presence of a low bias in codon usage in Trigonopterus. The combined analysis of genes coded on the minus strand had lower GC content at third codon sites and ENC values than the combined analysis of those coded on the plus strand (Fig. 4) though such pattern can be driven by the shorter overall length of genes coded on the minus strand.
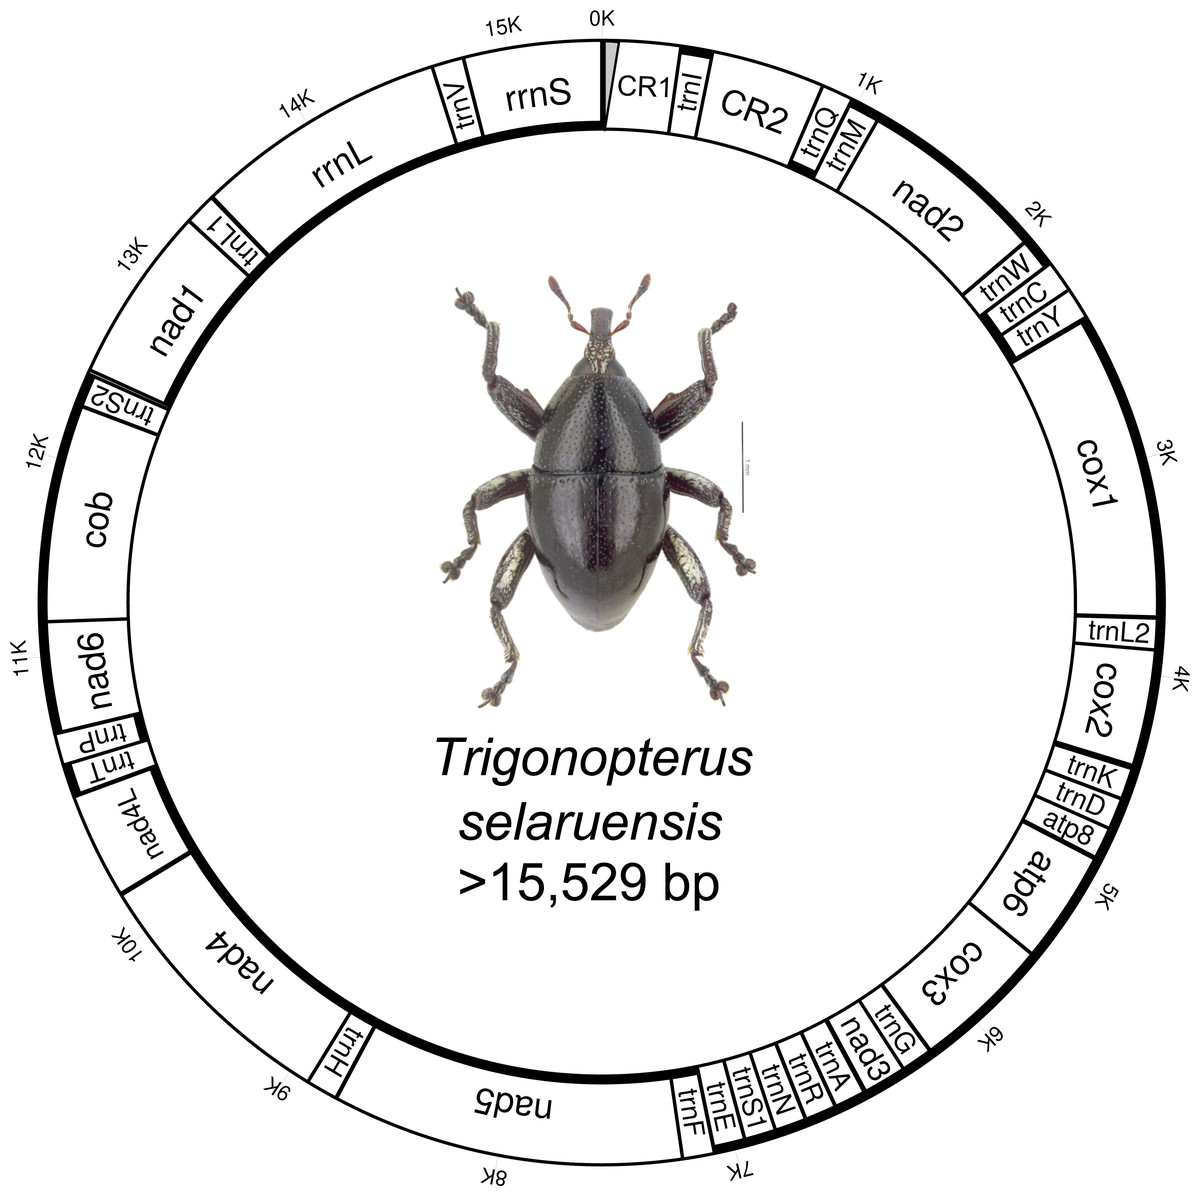
Figure 1: Circular mitochondrial genome of Trigonopterus selaruensis.
Thicker lines of inner and outer circles indicate presence on minus and plus strand, respectively. Control region 1 (CR1) could not be sequenced at 5’ end due to the presence of repetitive regions (grey area)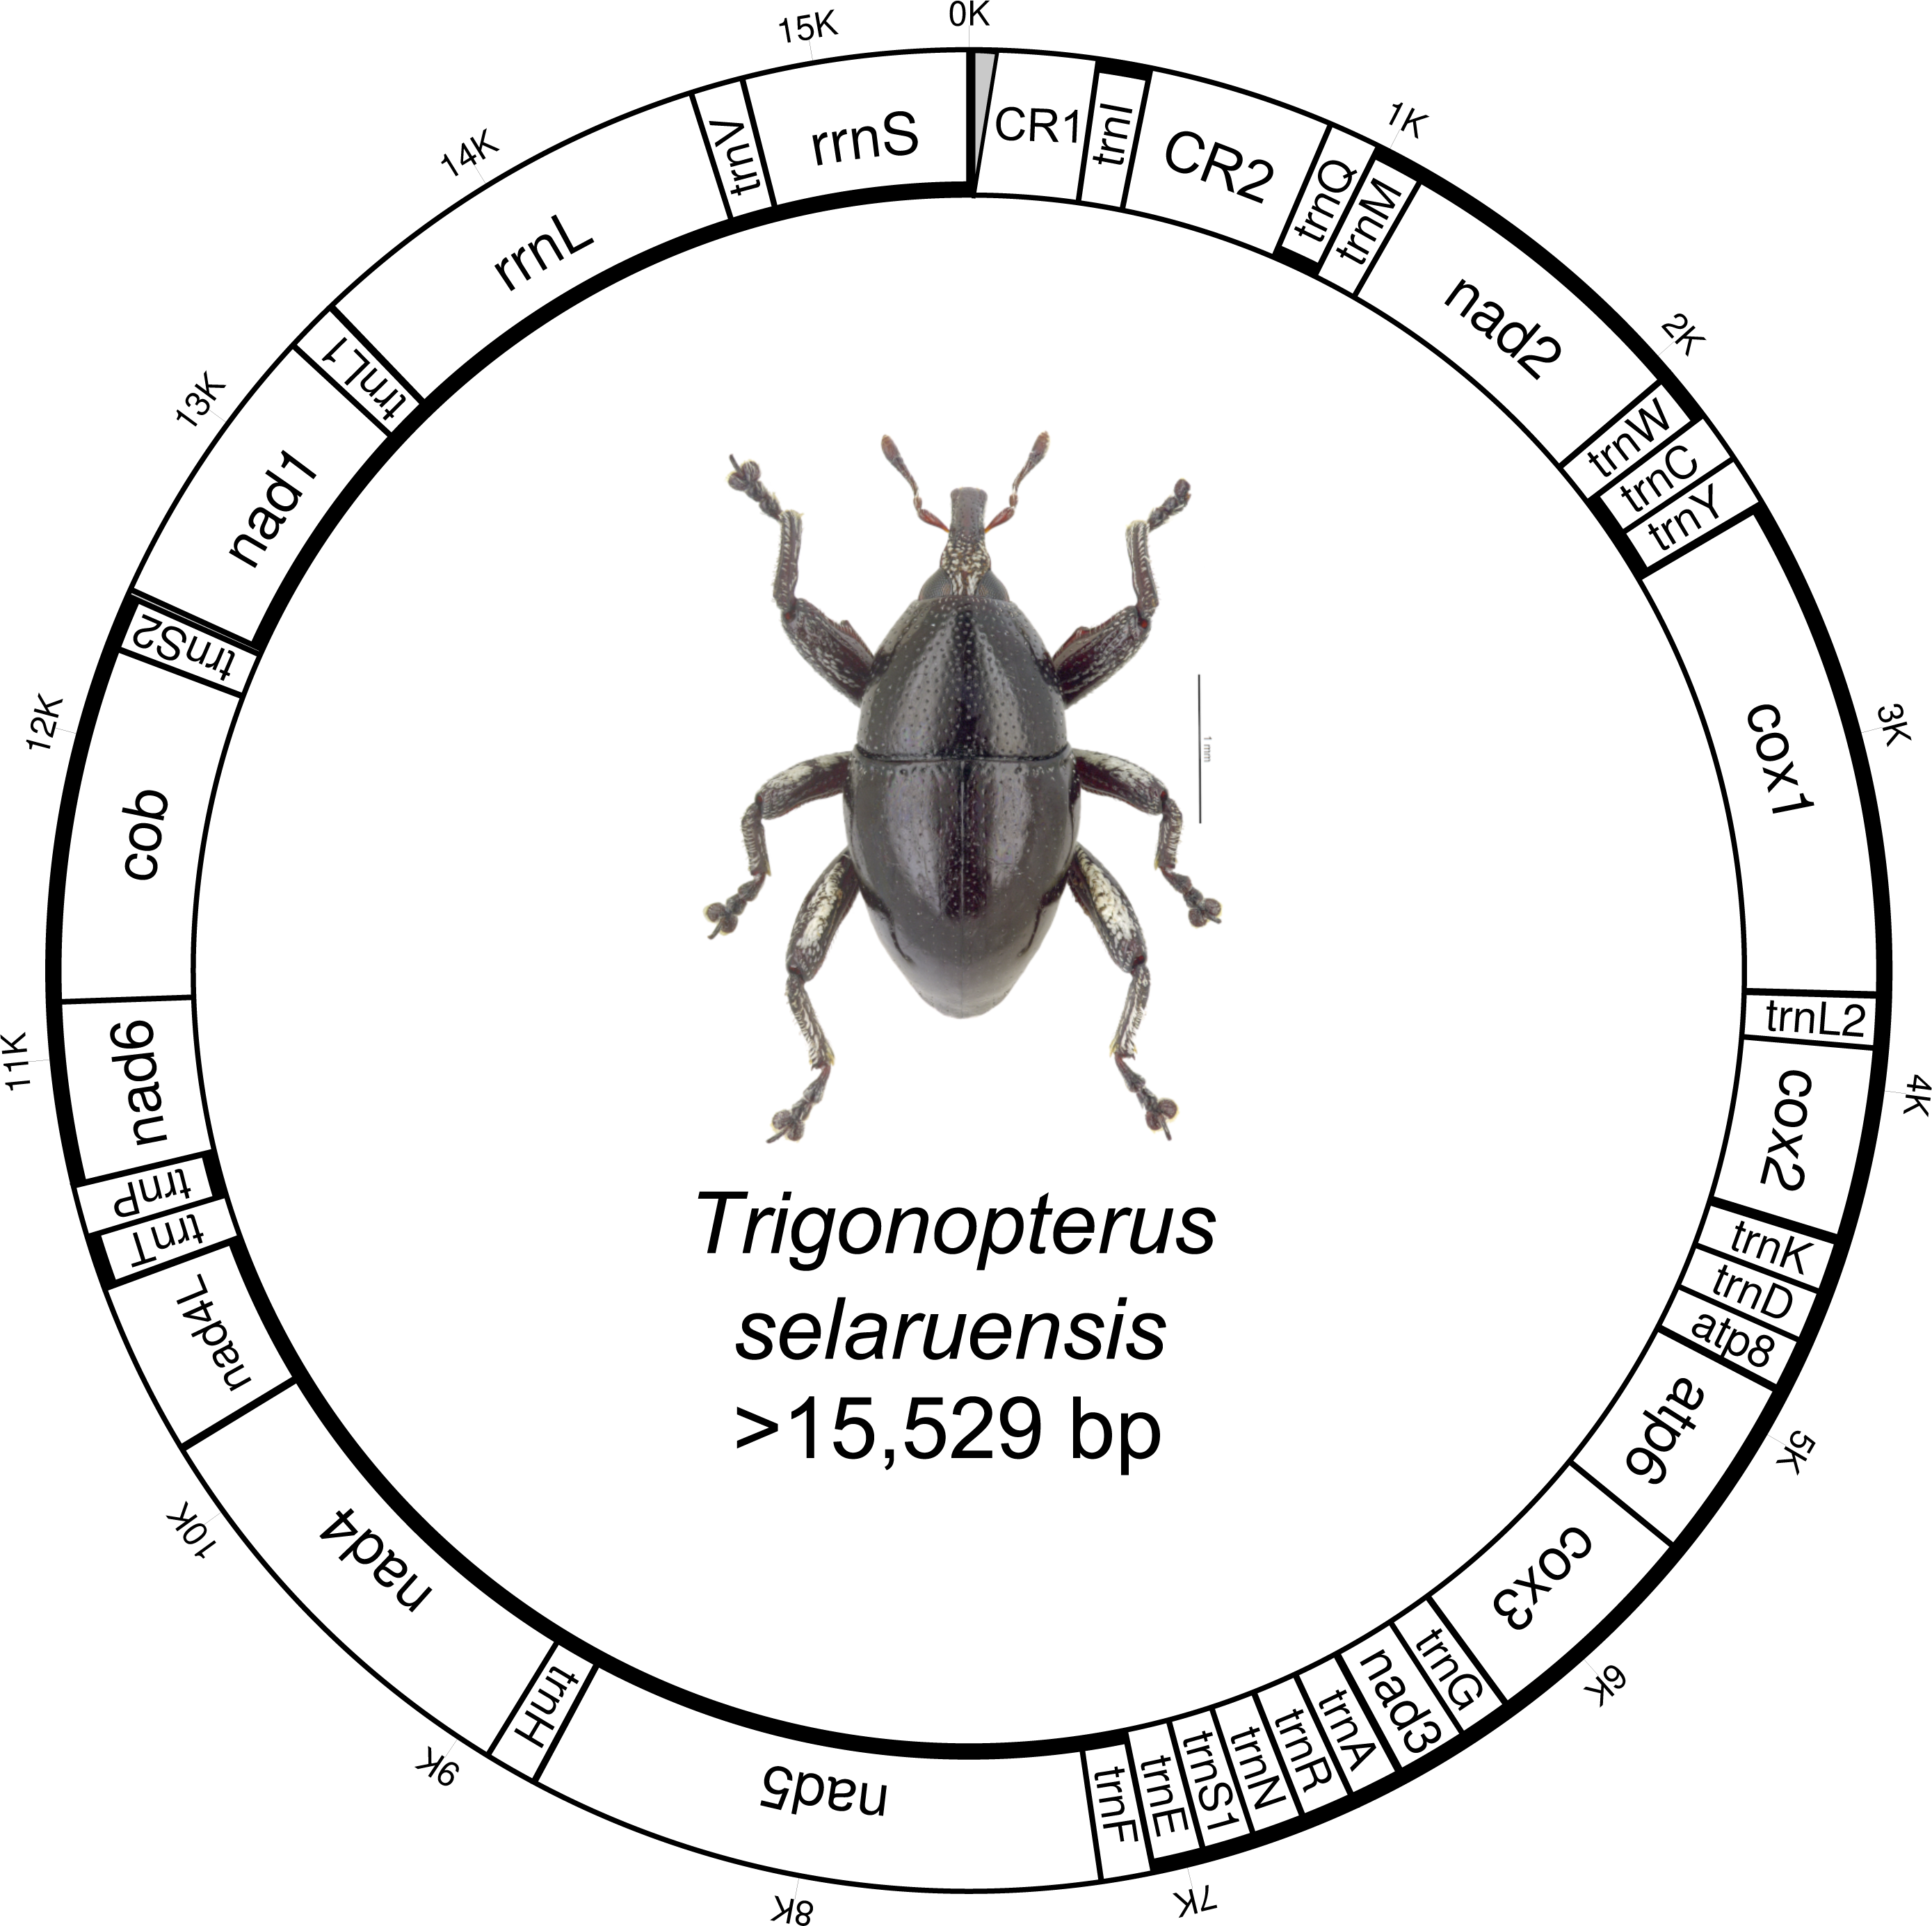
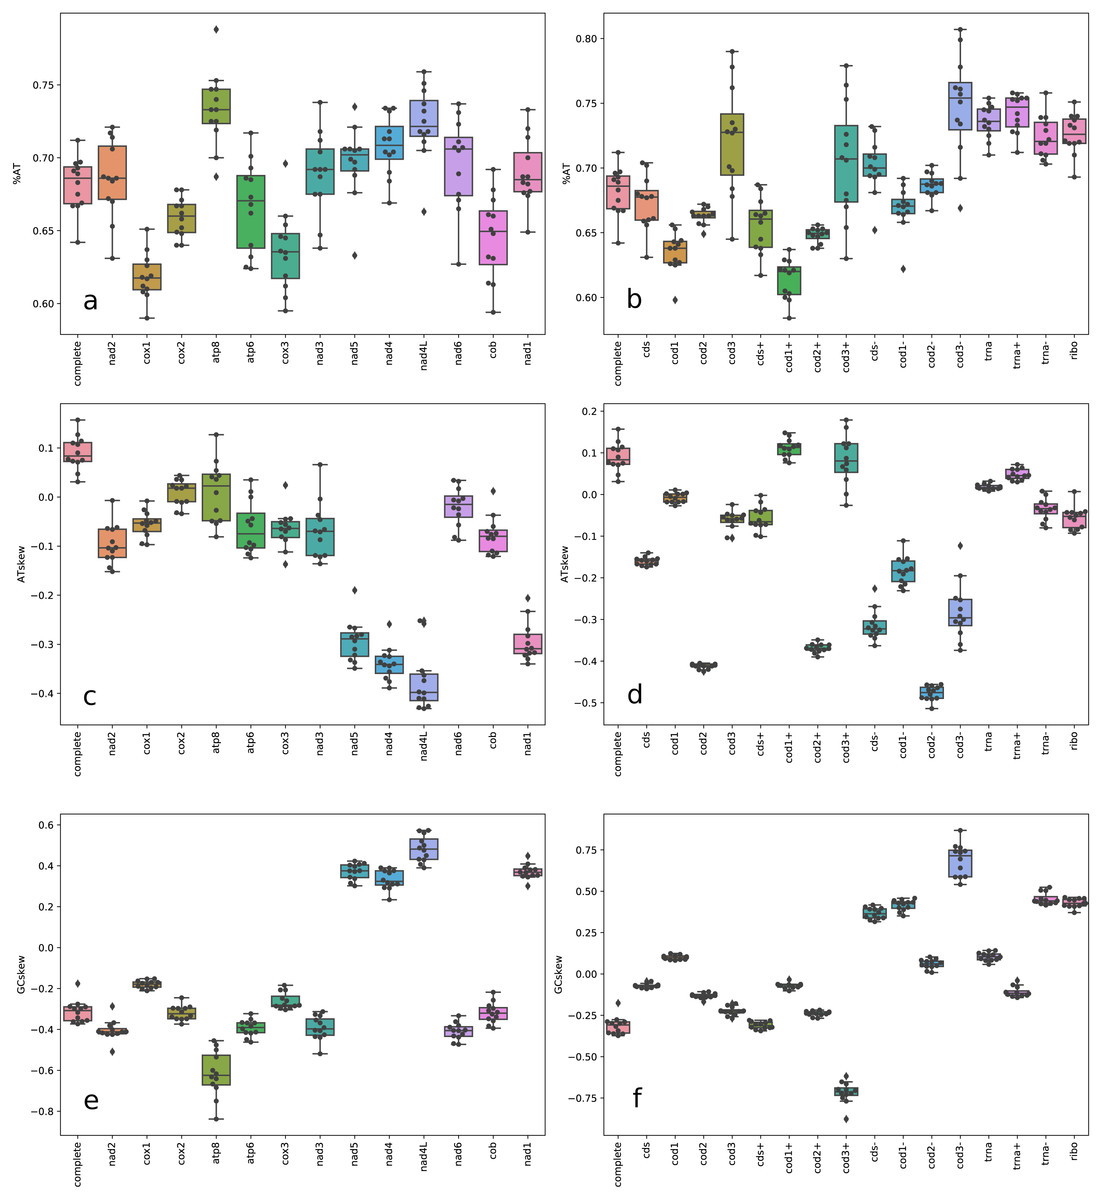
Figure 2: Box plot of nucleotide content.
A+T frequencies (A–B), AT skews (C–D) and GC skews (E–F) for complete mitochondrial genomes, individual genes, gene partitions, and codon sites across Trigonopterus species. Acronyms: cds (13 protein coding gene sequences concatenated), cds+ (concatenated PCG sequences of genes in the plus strand), cds- (concatenated PCG sequences of genes in the minus strand), trna (tRNA sequences), trna- (tRNA sequences on plus strand), trna- (tRNA sequences on minus strand), and ribo (ribosomal RNA sequences).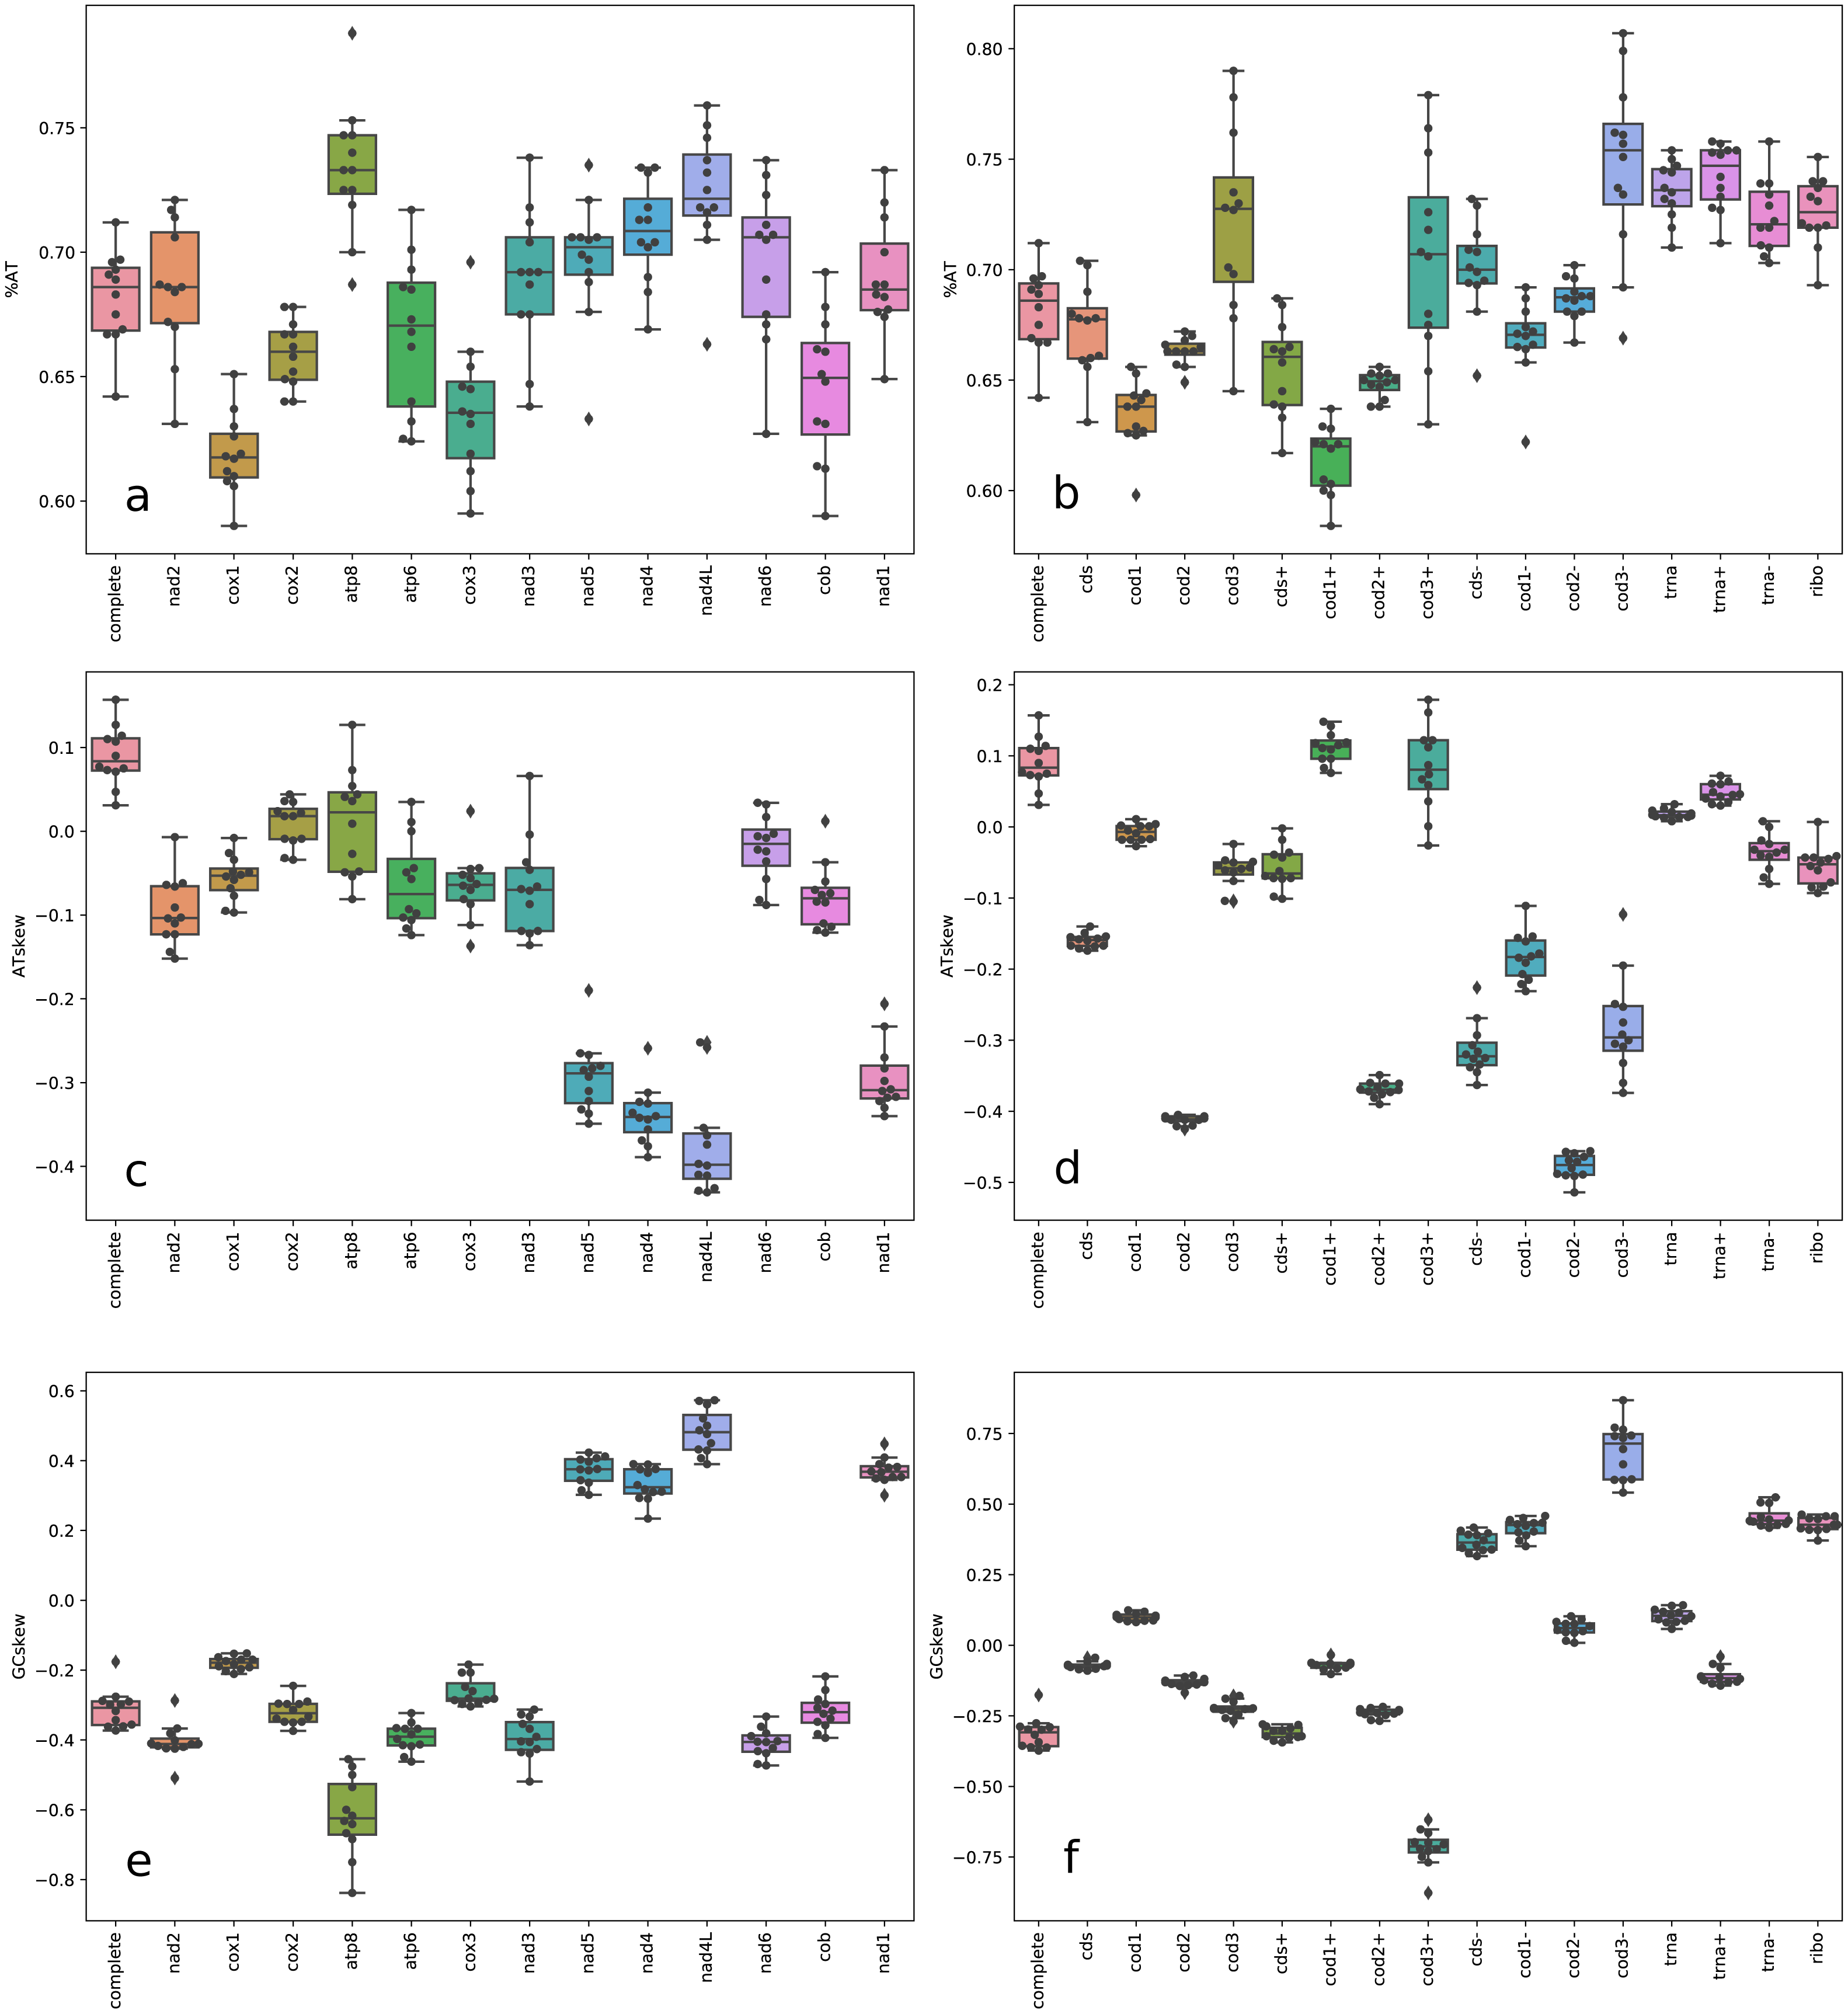
The accurate reconstruction of secondary structures of the large (rrnL gene or 16S) and short (rrnS gene or 12S) subunits of rRNA were not performed here since such remodeling requires complex analyses and posterior manual refinements that are beyond the scope of this study. All 22 tRNAs showed the expected canonical cloverleaf structure except for tRNA S1 that in most metazoans, and hence in Trigonopterus, lost its DHU-arm (Fig. 5). The secondary structures were conserved across the twelve Trigonopterus species studied herein and a closer look at the alignment of their sequences showed many compensatory mutations, such as from A-U to G-C and from GU to GC, or vice-versa, and very few mismatches in base pairings of arms (see tRNA alignments on Data S2).
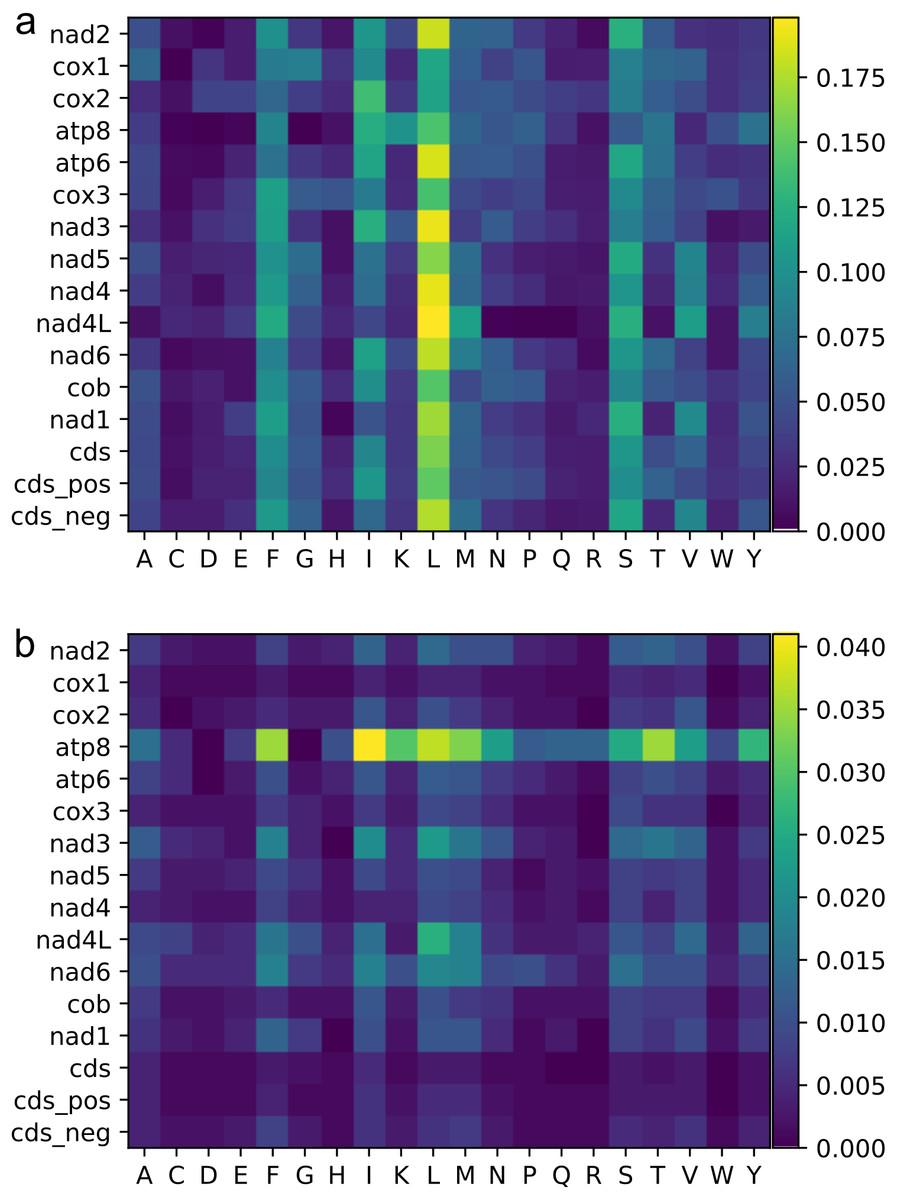
Figure 3: Heat maps of amino acid frequencies.
Mean (A), and standard deviation (B) for amino acid frequencies across Trigonopterus species for each protein codon genes and by codon sites and strands. See legend of Fig. 2 for acronyms.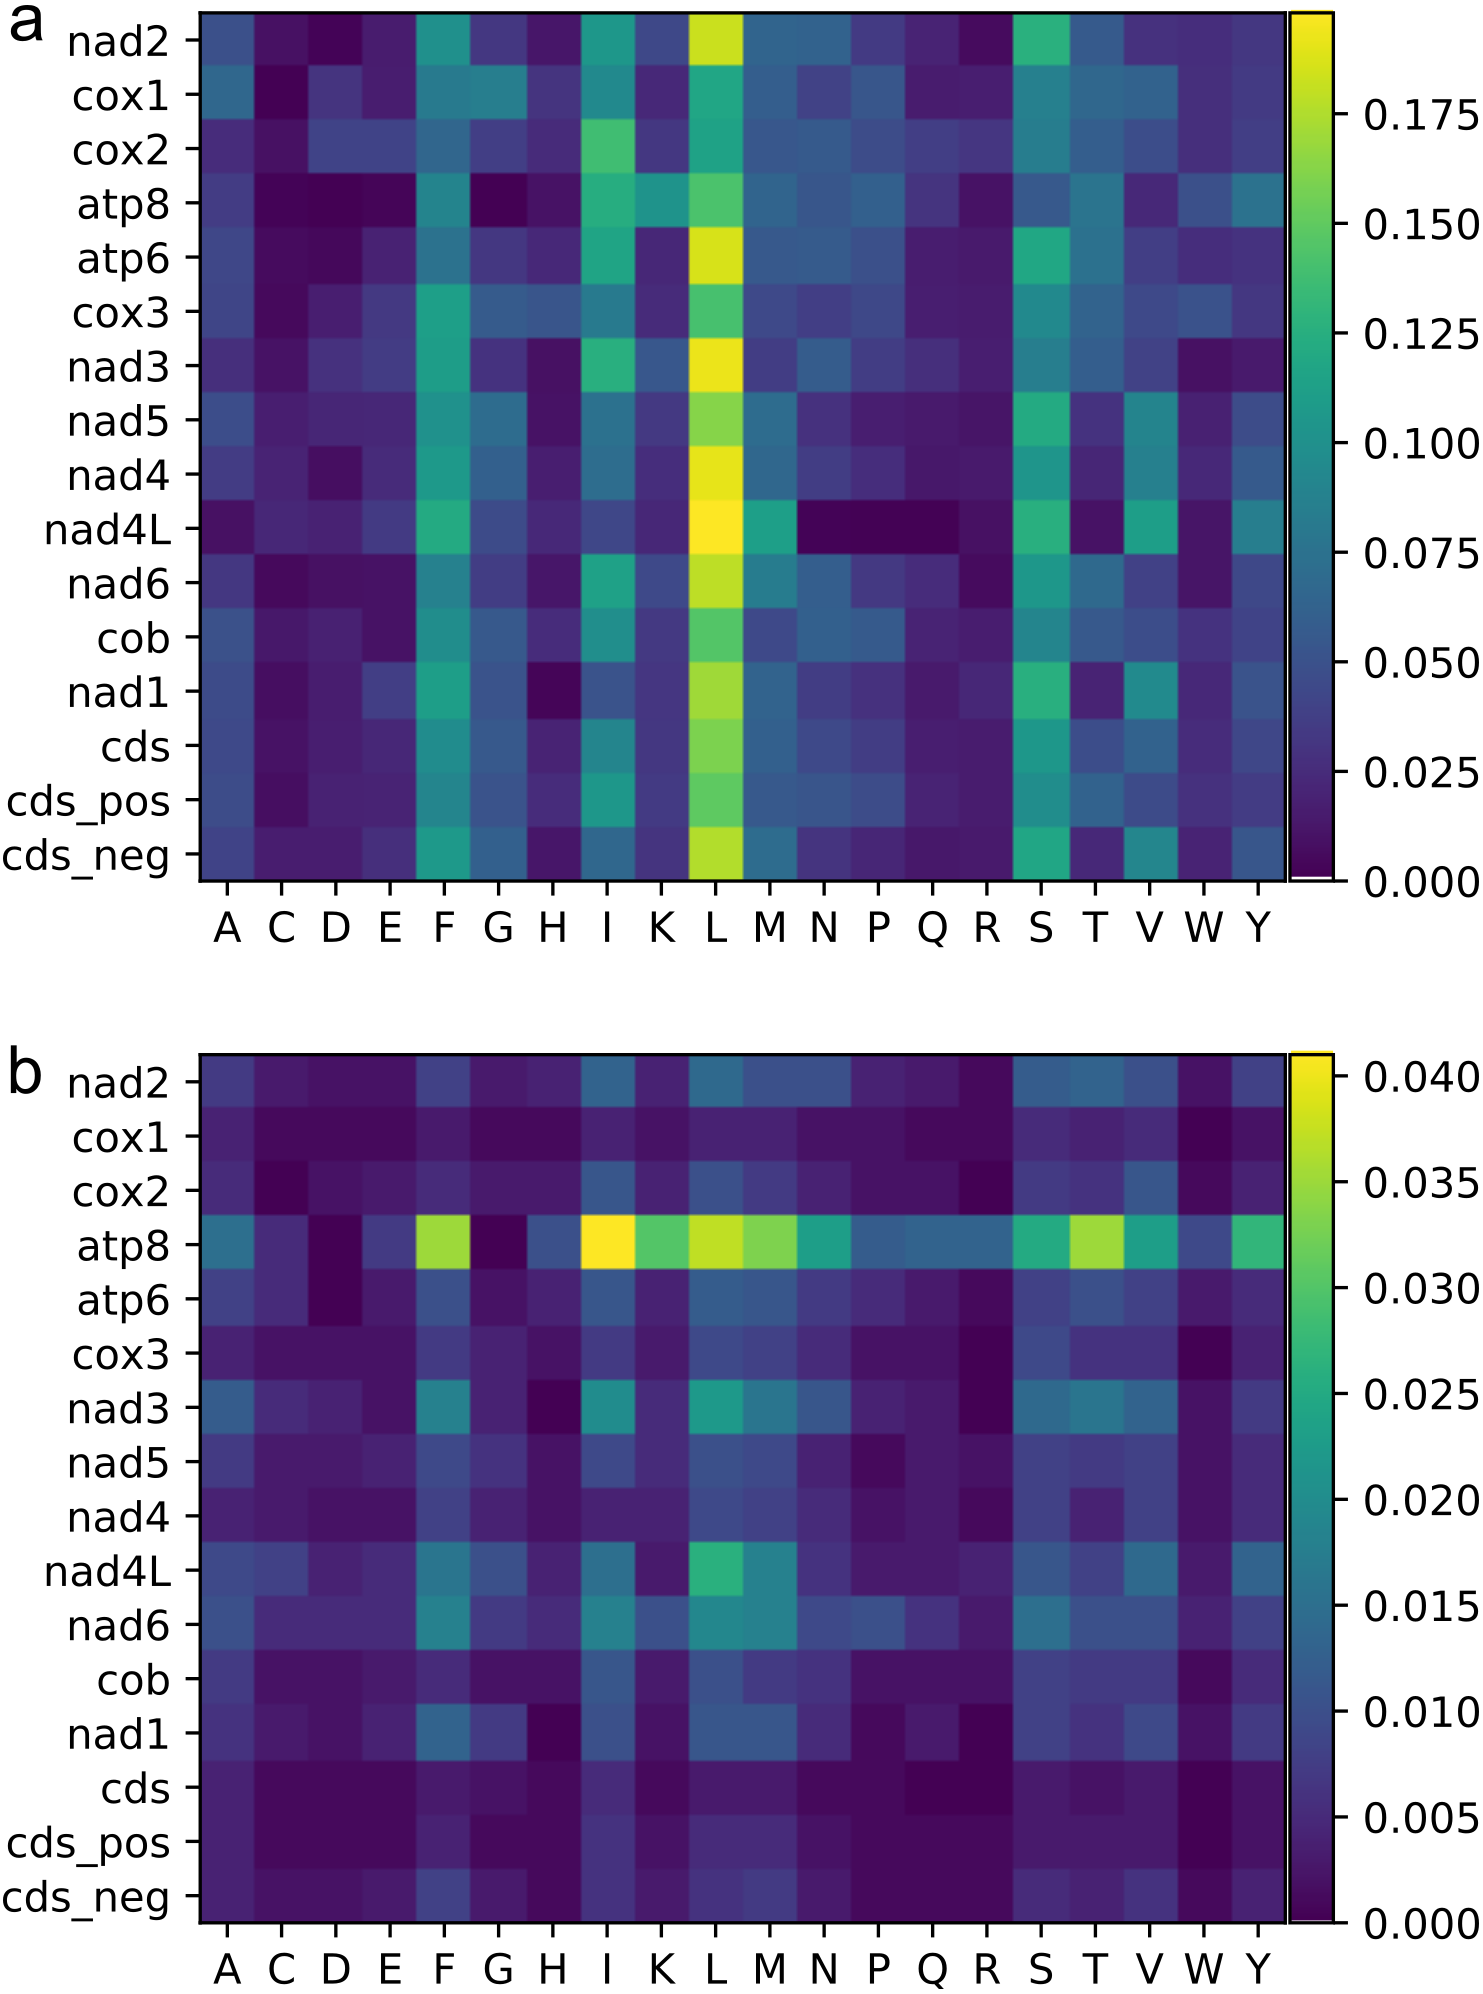
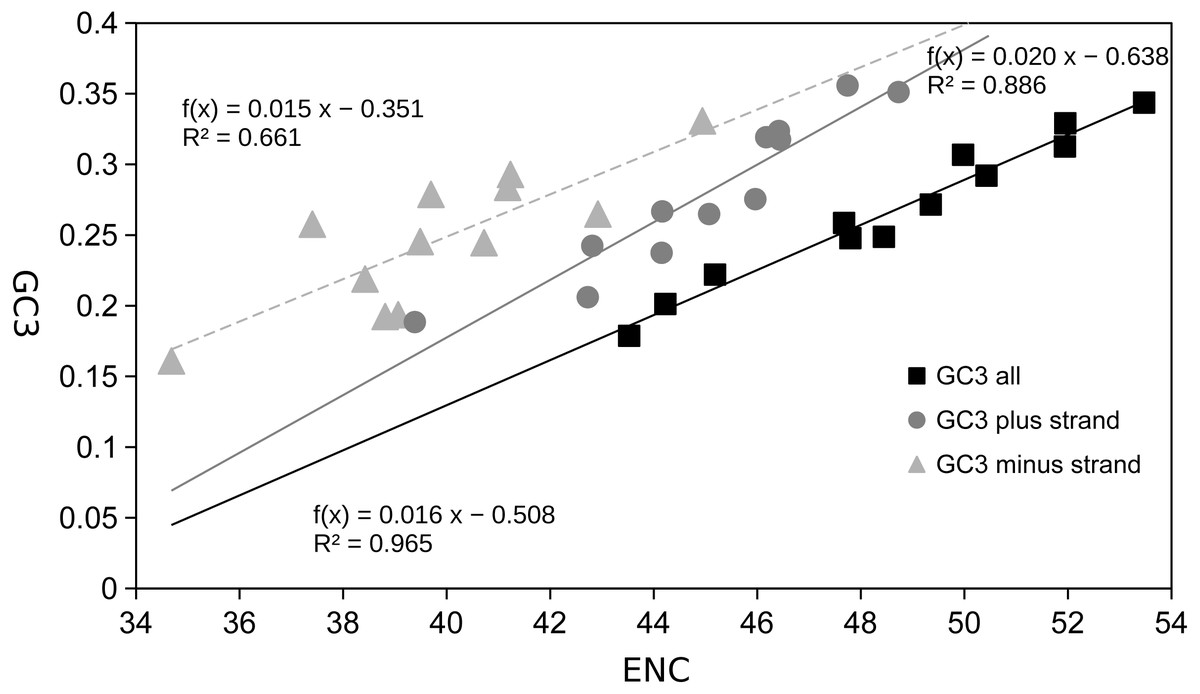
Figure 4: Scatter plot of GC content of 3rd codon sites vs effective number of codons (ENC).
GC3rd (x) vs ENC (y) for the twelve Trigonopterus species using concatenated PCG sequences, as well as separate graphs for PCGs on plus and minus strand only.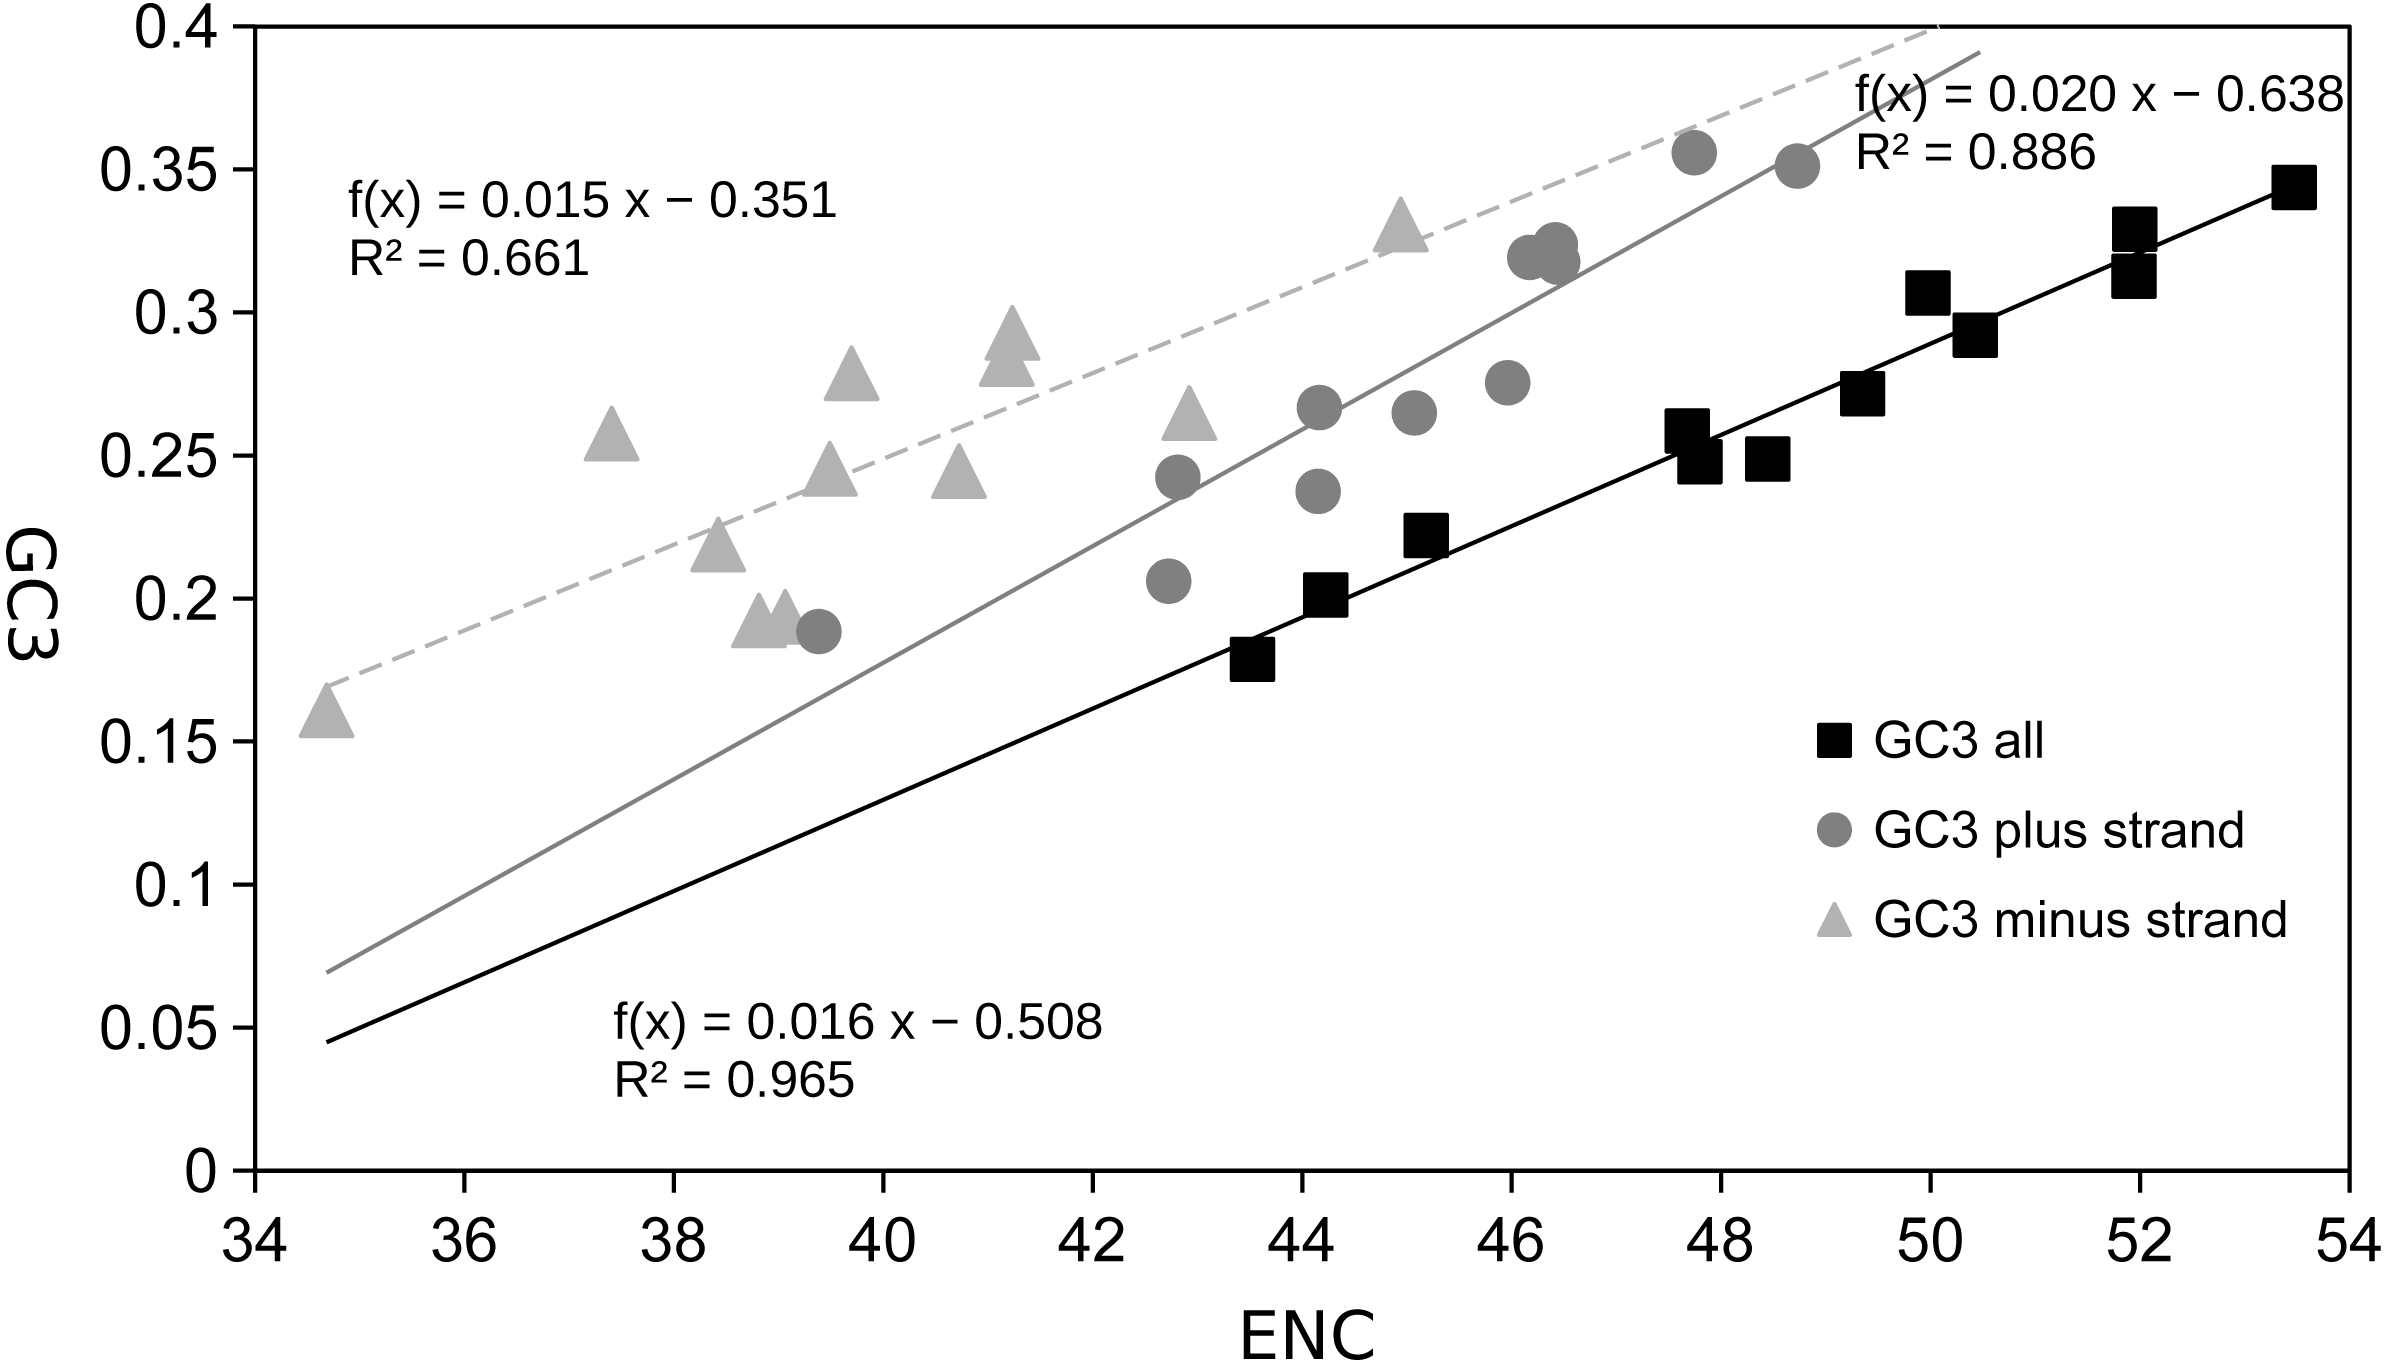
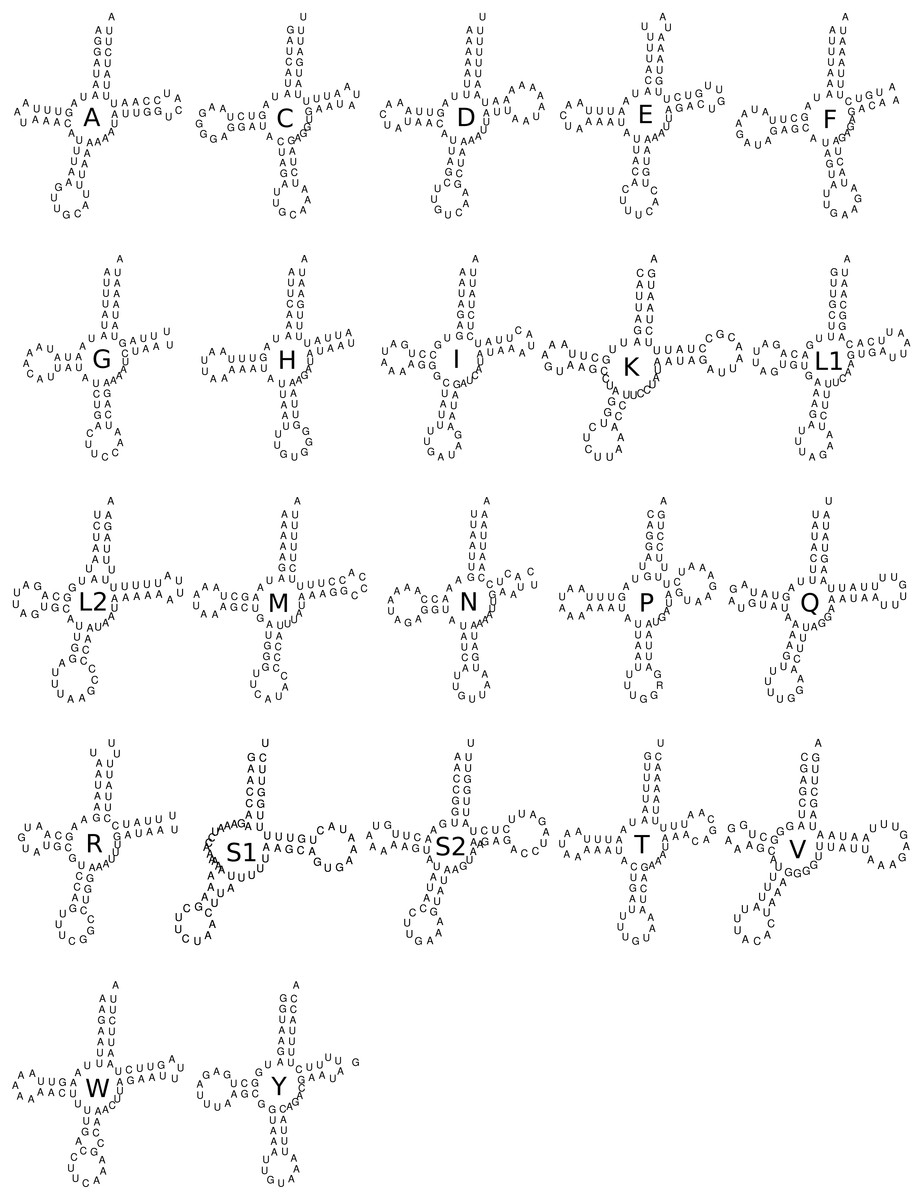
Figure 5: Secondary structure of the 22 tRNA of Trigonopterus selaruensis.
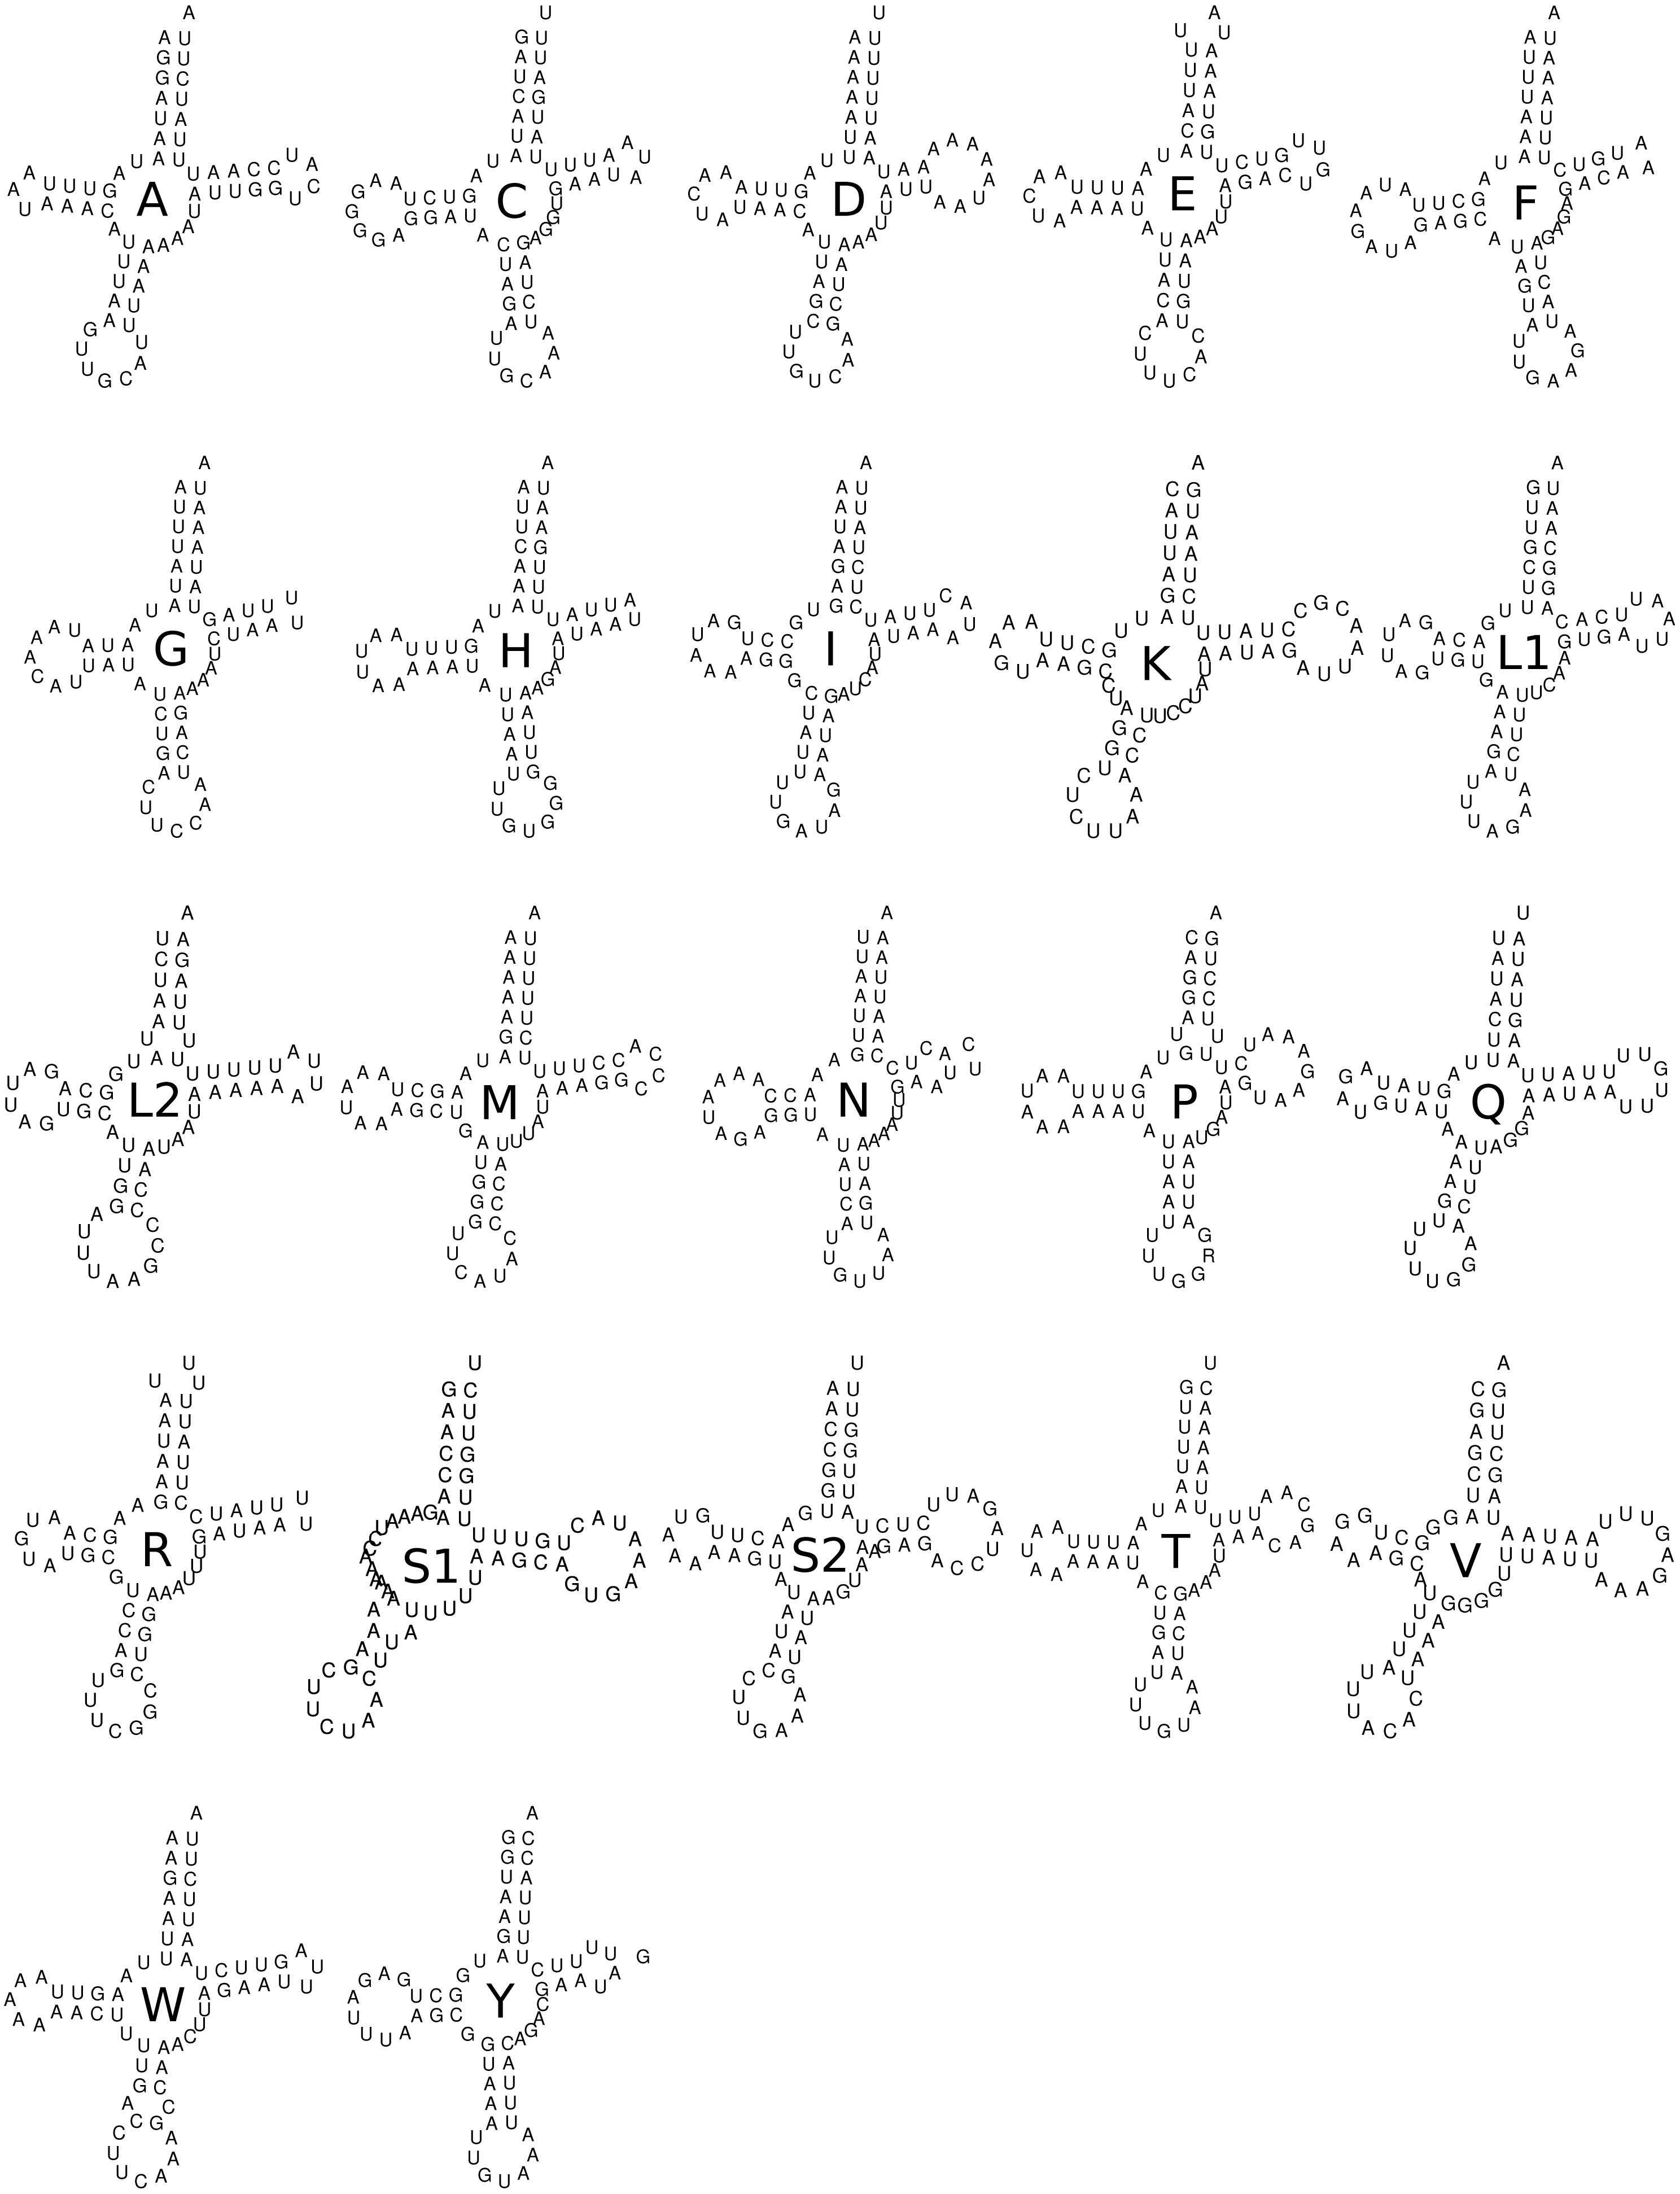
The twelve Trigonopterus species studied herein possess two large non-coding regions, CR1 (between the rrnS and the trnI genes), and CR2 (between the trnI and the trnQ genes). They were difficult to assemble, particularly CR1, since they harbor many repetitive motifs. Coverage plots (Fig. S1) did not show any unusually high peak within the CR that would be an indication of collapsed reads within repetitive regions. The first non-coding region was longer than the second one except in T. carinirostris and Trigonopterus sp. 1113. The CR1 of the ten complete mitogenomes had an average length of 2,072 bp (±614 bp) ranging from 3,178 to 1,345 bp, and CR2 a lower average length of 867 bp with extremely large standard deviation (±1,142 bp, range 4,082 - 98 bp). They were also AT rich, 68.60% (±3.57%, max. 73.18-% and min. 63.53%), and 60.83% (±7.51%, max. 77.94% and min. 49.77%), respectively. The non-coding region CR1 harbors many repetitive sequences, long homopolymer runs of A or T >10 bp, and many palindromic sequences forming secondary structures that are common features associated with control regions. Besides, CR1 includes a motif of 21 bp (ATTTATAGTTATATATATAAAT) which forms a palindromic structure in six out of twelve Trigonopterus species examined. This motif was enclosed within larger sequences recognized as putative origins of replication of the plus strand by MITOS2. Besides, the complete CR1 of each species contained one or two short inverted repeats ranging from 20 to 80 bp in length and a high nucleotide identity ranging from 97% to 68% (see Data S3). The alignment of those CR1 sequences using BlastAlign showed that very few sites (<100 for most pairwise comparison, see Data S3) were conserved across the ten complete control regions, mostly homopolymer runs, and hence without phylogenetic signal. The CR2 showed similar features without conserved regions and its homopolymer stretches were shorter. Besides, it neither included the motif of 21 bp, nor the presence of inverted repeats. Besides, according to MITOS2 it included the origin of replication of the minus strands for several species though primary sequences were not conserved across them. Therefore, we refer to it as “CR2” while Song et al. (2020) described it as ‘supernumerary’ non-coding region (IGS).
There was another short non-coding region between trnS2 and nad1, including the sequence resembling a motif of 22 bp described in several longhorn beetles between the same genes (TTACTAAATTTAATTAACTAAA; Wang et al., 2019). This sequence is capable of forming a palindrome in Trigonopterus and includes two TACTA motifs at both ends (see Data S4).
The ML phylogenetic analyses of the 13 mitochondrial PCGs based on a comparison of BIC factors showed that the 39 preliminary partitions (13 genes per three codon sites) could be merged in seven blocks (see Table 2). This partitioning scheme had better BIC values than analyzing the data as a single partition, by gene (13 partitions), splitting by gene and by codon (39), by codon (3), and by codon and strand (6, see Table 2). The best partition scheme estimated in IQTREE included the 2nd codon sites of atp8 within 1st codon sites of partition 1. However, the inclusion of those atp8 sites with the other 2nd codon sites of genes coded on the plus strand just increased the BIC value by 40.867 units (Table 2). Since this alternative partitioning makes more sense from a functional point of view, we selected it for further phylogenetic analyses. Partitions were as follows: (1) 1st codon sites of genes cob, atp6, atp8, cob, nad2, nad3, nad6, (2), 1st codon sites of cox1-3 genes (3) 1st codon sites of genes coded on minus strand, (4) 2nd codon sites of genes coded on plus strand, (5) 2nd codon sites of genes coded on minus strand, (6) 3rd codon sites of genes coded on plus strand, and (7) 3rd codon sites of genes coded on minus strand. The best nucleotide substitution models were GTR+I+G for partitions 1 to 5 except that partition 2 did not include the Gamma parameter, and HKY+I+G for partitions 6 and 7. The best partitioning and models at the amino acid level were in three blocks starting from 13 independent gene partitions (Table 2): (1) atp6, atp8, nad2, nad3, and nad6 (mtMAM+F+I+G), (2) cob, cox1, cox2, and cox3 (mtMet+I+G), (3) genes coded on the minus strand (nad1, nad4, nad4L, nad5; mtMet+F+I+G4). The ML and Bayesian trees based on the best partitions and models at both DNA and amino acid levels showed similar topologies with low support for several deep nodes (Fig. 6).
| Data type / Model | n partitions | BIC |
|---|---|---|
| nucleotide | ||
| IQTREE best | 7 | 194375.986 |
| alternative (see text) | 7 | 194416.853 |
| by strand + by codon | 6 | 194476.674 |
| by codon | 3 | 200087.080 |
| by gene + by codon + by strand | 39 | 202208.392 |
| by gene | 13 | 204293.956 |
| none | 1 | 206210.303 |
| amino acid | ||
| IQTREE best | 3 | 91091.530 |
| by strand | 2 | 91254.723 |
| none | 1 | 91782.952 |
| by gene | 13 | 93110.067 |
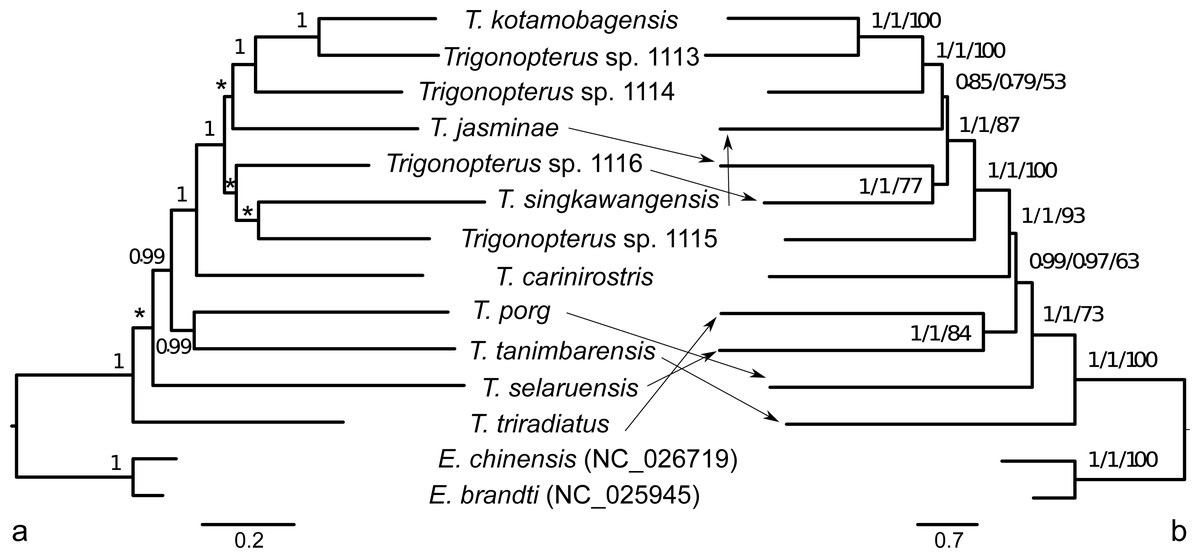
Figure 6: Phylogenetic tree hypothesis of twelve Trigonopterus species studied herein.
Two weevil species of Eucryptorhynchus included as outgroup representatives. Tree estimated with Bayesian framework at amino acid level in A; tree based on ML criterion at nucleotide level in B. Numbers on nodes indicate posterior credibility support (A), and alrt, abayes and fast bootstrap support (B). Asterisks denote lack of posterior credibility support.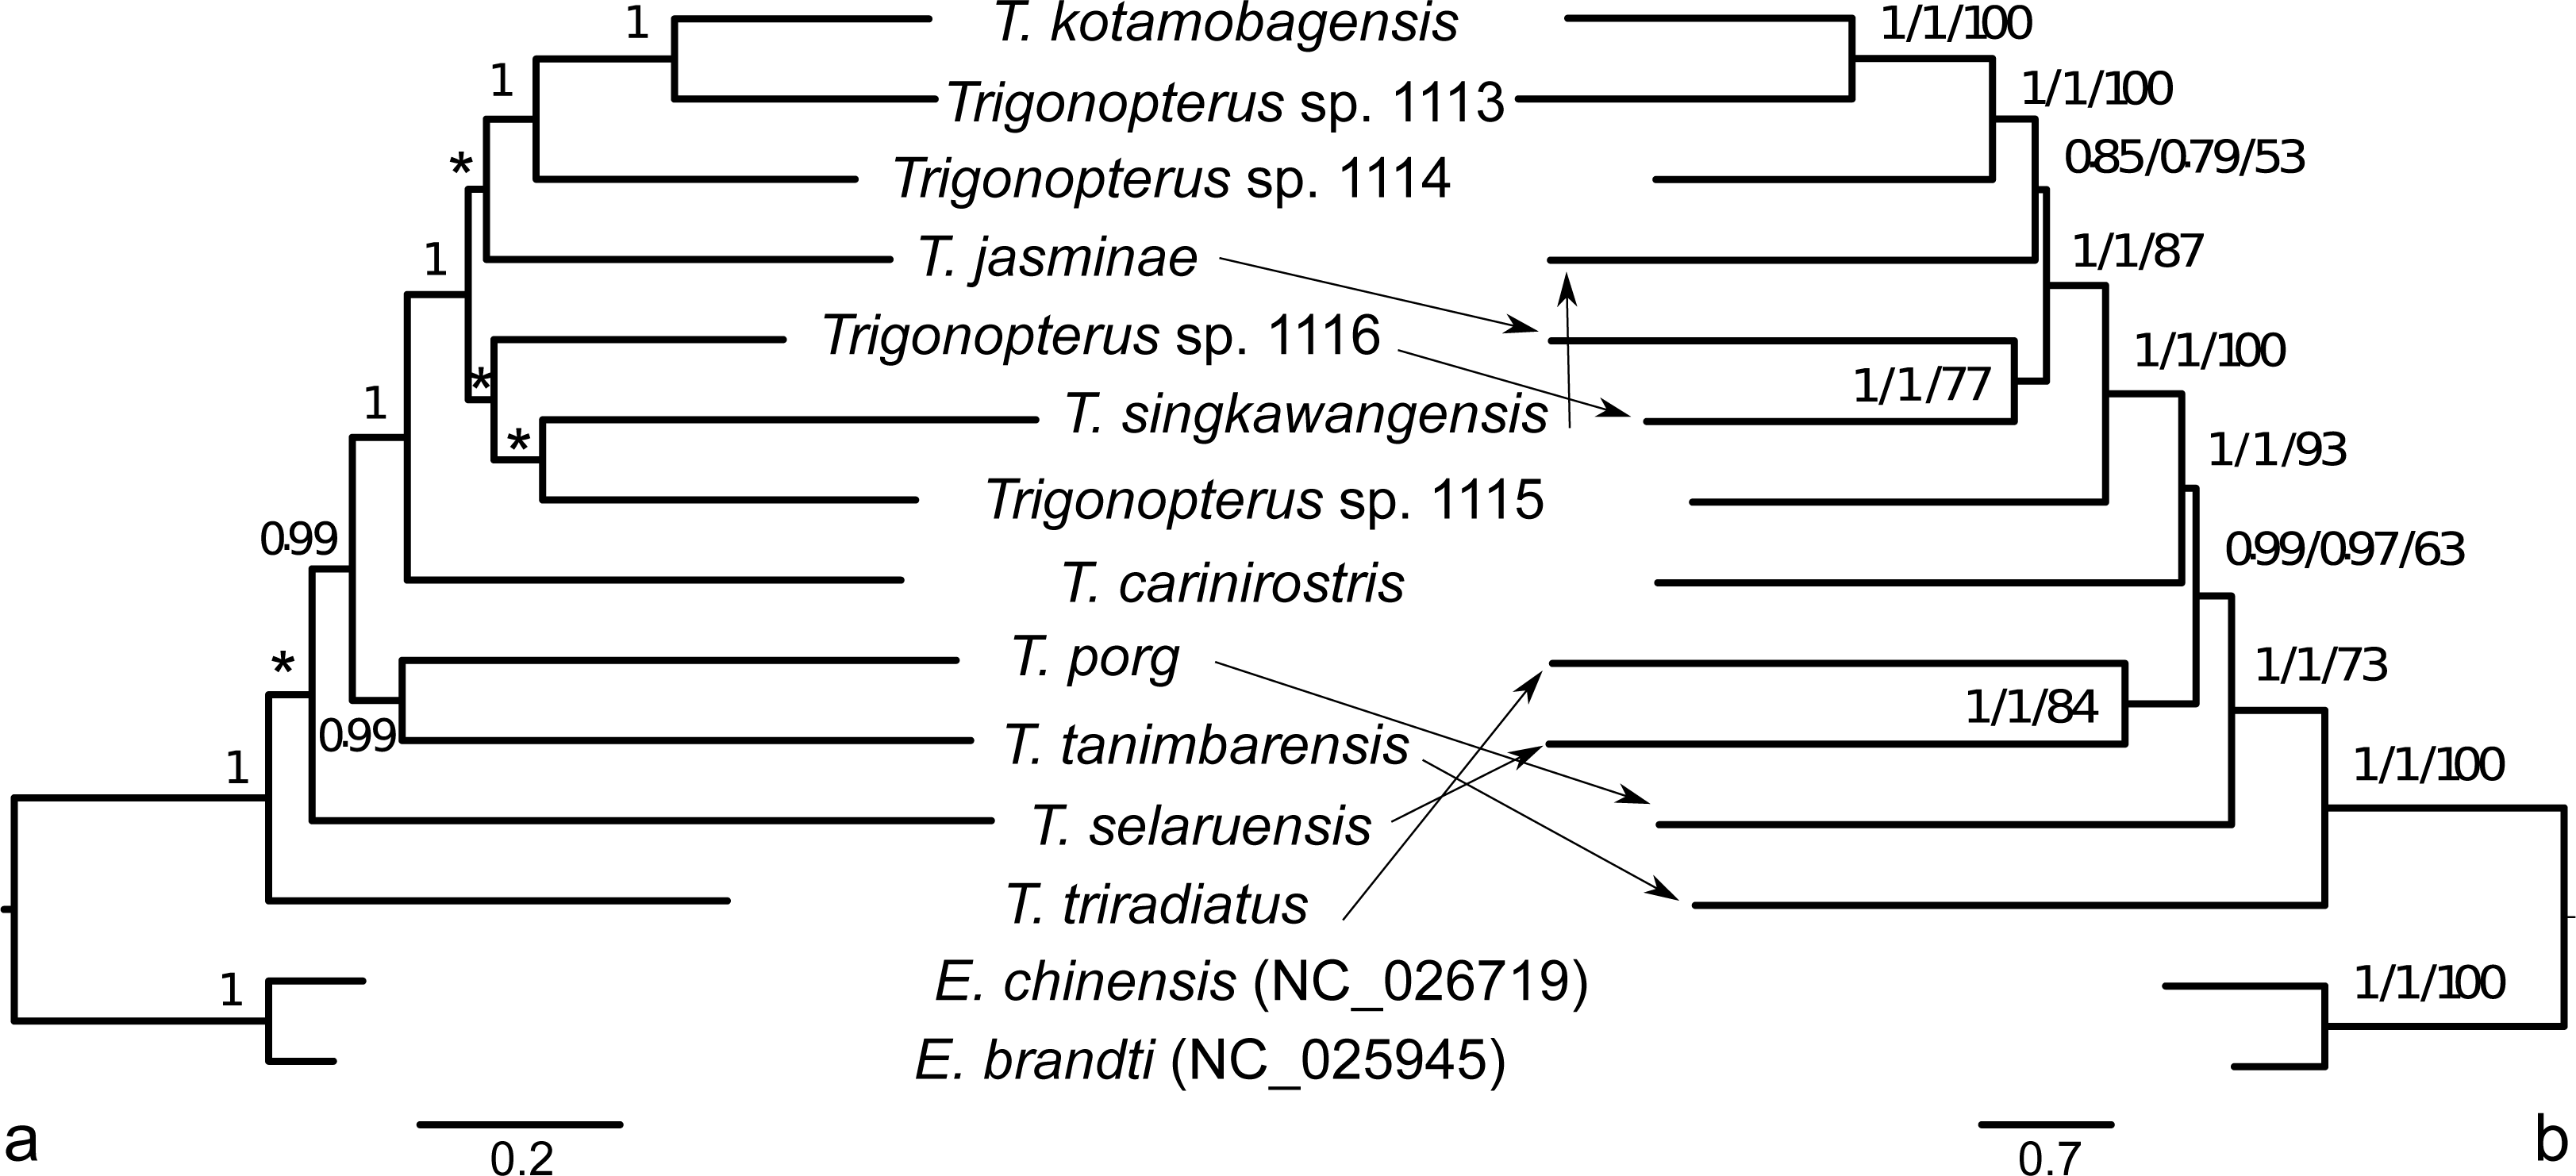
Two different clock relaxation models, UCLN and RLC, were statistically compared against a strict clock using BF estimated from marginal likelihoods in BEAST: −97881.813, −97882.255, and −97912.858, respectively. Thus, the strict clock was statistically rejected (BF > 62) vs UCLN, but not RLC since BF was lower than one. The UCLN model was favored over RLC since the marginal likelihood value was smaller and the former contains fewer number of parameters. The tree topology under the UCLN model (Fig. 7) was identical to those obtained under strict and RLC clocks and similar to that retrieved based on ML with no support for basal nodes. Most node ages were between 25 and 45 Ma with a single younger split at ca. 15 Ma between T. kotamobagensis and Trigonopterus sp. 1113. The mean rate estimated for the mitochondrial PCGs under UCLN clock was 0.0104 × 10−08 nucleotide substitutions per site, year and linage, with a 95% confidence interval between 0.0085 and 0.0131 × 10−08.
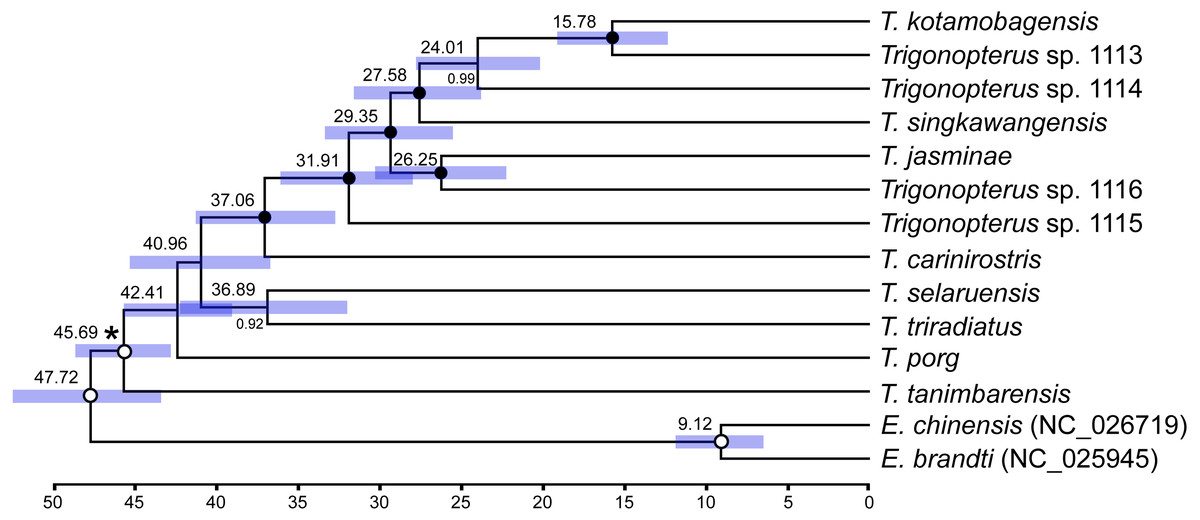
Figure 7: Ultrametric tree under uncorrelated log-normal clock (UCLN) in BEAST.
Numbers above nodes indicate mean ages in million years; those below nodes posterior credibility support. Bars indicate 95% confidence interval of node ages. Black circles highlight fully supported nodes, white circles unsupported ones (<0.95). Asterisk indicates calibration node (see Material and Methods).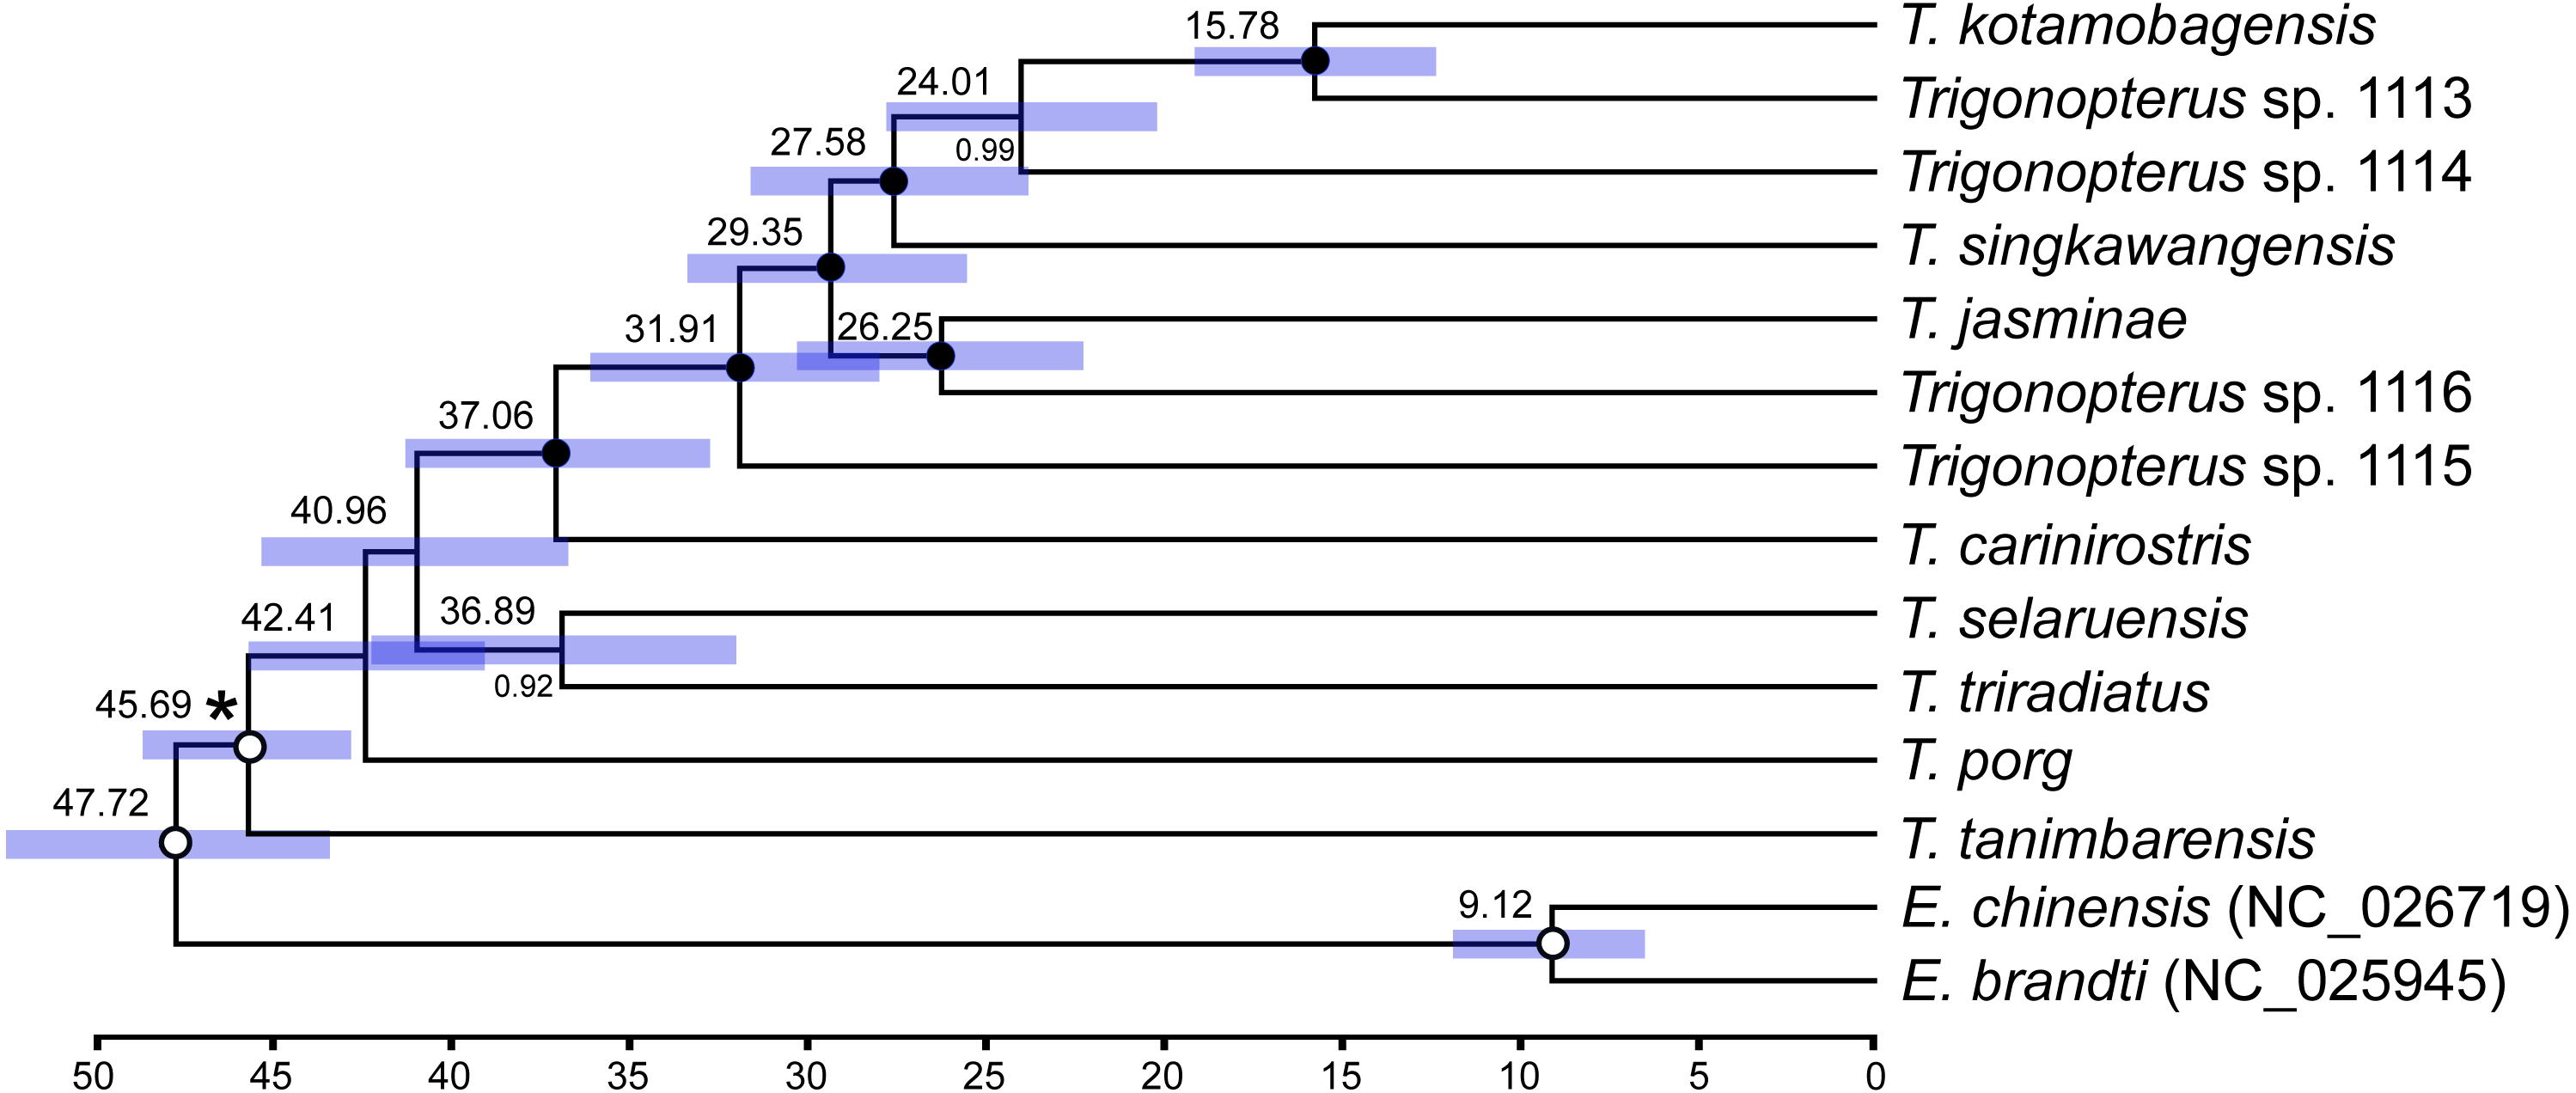
The concatenated nucleotide sequences of the 13 PCGs showed low saturation based on Xia’s test (Iss 0,605 < Iss.c 0,838, Two-tailed p < 0.001). Absent or low saturation was also retrieved after independent analysis of codon sites: 0.531 vs 0.822, 0.398 vs 0.822, and 0.724 vs 0.822 for 1st, 2nd and 3rd codon sites, respectively (Two-tailed p < 0.001 for all of them). These values were estimated for a symmetrical topology as that estimated for our BEAST tree (Total Cophenetic Index 243 within a maximum of 364 and a minimum of 64, and a value of 118.956 for a yule tree).
Discussion
The patterns of nucleotide composition and intrastrand asymmetry observed in Trigonopterus mitogenomes are similar to those previously described in ecdysozoans, particularly in arthropods, most insects, and also in other beetles (Wang et al., 2019; Pons et al., 2014; Lavrov, 2014; Rota-Stabello et al., 2010). AT richness is not as high as in others arthropods, sometimes exceeding 70% (e.g., Cameron, 2014a; Cameron, 2014b; Boore, Lavrov & Brown, 1998). Such A+T content in Trigonopterus is also reflected in the codon usage which is not as biased as in other insect species, although 3rd codon sites have higher chances of showing A or T rather than G or C. Most of the variation found among several features described in Trigonopterus were at the strand and codon level: e.g., higher A+T content on 3rd codon sites, higher positive AT skews but lower GC skew values for genes on plus strand, as described elsewhere in arthropods (Pisani et al., 2013; Pons et al., 2014). In insects, the sign of GC skew value is related to replication orientation but that of AT skew value fluctuate with gene direction, replication and codon positions (Wei et al., 2010). Those unbalanced usages and asymmetrical patterns were also observed in the amino acid content: some amino acids are used frequently (e.g., Leu, Ser, Ile, and Phe), whereas others rarely (e.g., Cys, Asp, Gln, and Arg; e.g., Pons et al., 2014). Finally, the presence of non-canonical start codons is quite common as previously described in other pancrustacean taxa (e.g., Pons et al., 2014).
Pinpointing the start of the cox1 gene is a contentious issue in insects; in Diptera even four base pairs start codons have been proposed (Cameron, 2014b). For Coleoptera, it was suggested that Asp might act as a start codon being the first in-frame codon following the tyrosine tRNA and appearing conserved across Polyphaga (Sheffield et al., 2008; Cameron, 2014a). However, our alignment shows that three Trigonopterus species deviate from this pattern: T. carinirostris has Gln, T. tanimbarensis His, and T. triradiatus Lys in this position. A start codon of ATT, respectively ATC, and in one species (T. singkawangensis) ACT appears most likely, although this involves an overlap of eight base pairs with tyrosine tRNA. On the other hand, most PCGs in Triponopterus terminated in full stop codons (TAA or TAG) which is not unusual in beetles, although it is also known that beetles have incomplete stop codon such as T and TA in various genes (Sheffield et al., 2008; Chen et al., 2018; Takahashi, Okuyama & Martin, 2019). Other arthropod taxa have many PCGs with truncated stop codons (Cameron, 2014a; Stewart & Beckenbach, 2009). Alignments of five PCGs in Trigonopterus showed no gaps near the ends (i.e., atp6, cox3, cox2, nad2, nad3, nad4), while in others only a single amino acid was lost or gained (three gaps in the DNA alignment; atp8, cox1, nad5, nad4L, nad6). However, cob and nad1 showed a larger length variation of up to 24 nucleotide positions at the 3′ end although both genes terminated with a full canonical stop codon (TAA / TAG). The presence of a non-coding spacer between nad1 and the 3′ end of trnS2 could explain the difference in length plasticity in nad1. Another plausible explanation is that the length variability at the 3′ end of the NADH subunit 1 protein is placed in the inner mitochondrial space, while the trans-membrane regions are generally highly conserved in length (∼22 amino acids per trans-membrane section). The cob gene also exhibits a marked length variation at the 3′ end (from 3 to 15 bp) in Trigonopterus, but there is no spacer between the 3′ end of cob and the adjacent 5′ end of trnS2. In spite of its marked length variation cob just overlaps two nucleotides, or is separated by a two-nucleotide spacer, with trnS2. The 3′ end of the cytochrome b protein is located in the outer part of the mitochondrial membrane, which is also more variable in length than the trans-membrane regions. However, other mitochondrial proteins coded in the mitochondrial genomes have inner and outer parts but their lengths are conserved at their 5′ and 3′ ends. In fact, this pattern is located in a single region of the Trigonopterus mitogenome, (3′ end of cob - trnS2 -spacer - 3′ end of nad1, since the latter is coded on the minus strand), and hence length variation and presence of a non-coding spacer could be related to a single evolutionary event. In fact, this intergenic spacer, including TACTA motifs, between cob-trnS2 and nad1 genes of Trigonopterus was also described in other Cryptorhynchinae (Liu et al., 2016), Cerambycidae (Kim et al., 2009; Wang et al., 2019; Liu et al., 2018), other beetles families (Du et al., 2017; Kim et al., 2009; Liu et al., 2018), and is extremely long in Bruchinae (Sayadi et al., 2017). This spacer was probably formed by slipped-strand mispairing and duplication/random loss, and the conserved motif could be a binding site of a transcription termination peptide (Du et al., 2017; Wang et al., 2019) and references therein). Finally, the length increment of nad1 in Trigonopterus implies an enlargement of the mitochondrial sequence, and not a larger overlap between genes.
Trigonopterus mitogenomes harbor two large non-coding regions split only by the trnI gene (64–72 bp). They are extremely long, particularly CR2 that is presumably a secondary control region since it contains the origin of replication of the minus strand in several Trigonopterus species tough Song et al. (2020) described it as a non-coding region (IGS) in some weevils. The non-coding region CR1 shows all typical features of a main control region with long homopolymers of As or Ts >10 bp, palindromic sequences forming secondary structures, repetitive motifs and a putative origin of replication of the plus strand. However, the origins of replication of plus and minus strands are not conserved across species, for neither their primary nucleotide sequence, nor their secondary structure. It is remarkable that a similar pattern of two non-coding regions was described in some orthocerous species of weevils (Song et al., 2020 for Apion squamigerum-Brentidae, Ojo et al., 2016) for Sitophilus - Rhynchophorinae), as well as in some Curculionidae (Ceutorhynchus obstrictus - Ceutorhynchinae, Lee et al., 2019 and Trigonopterus spp-Cryptorhynchinae herein) while it is allegedly missing in other closely related species (Rhynchophorus ferrugineus - Rhynchophorinae, Zhang et al., 2017, Eucryptorhynchus brandti and E. chinensis - Cryptorhynchinae, Liu et al., 2016). Interestingly, the Rhynchophorus mitogenome of Zhang et al. (2017) shows strange duplications of tRNA-Ile, tRNA-Met and tRNA-Thr, while the Eucryptorhynchus mitogenomes of Zhang et al., 2017 are missing the tRNA-Ile. A more recent mitogenome assembly of Rhynchophorus ferrugineus was published within a whole genome project (Hazzouri et al., 2020). Its published sequence is in reverse-complement and contains numerous indels. However, based on the original read data it is evident that it has two non-coding regions and misses the oddities described by Zhang et al. (2017). Thus, the hypothesis that some of the published weevil mitogenomes are not correctly assembled appears more plausible than stipulating character reversal or multiple independent evolution. Mitogenomes covering the full phylogenetic range of weevils should be examined to ascertain if the peculiar structure of the control region is a consistent and possibly apomorphic character of this family.
As mentioned above, the nucleotide pattern in PCGs of Trigonopterus suggests that most differences in A+T frequencies, and AT and GC skews is due to variation at the codon and strand levels, and not at the gene level. A similar pattern is recognized at the amino acid level where most divergence is explained by the coding strand. Interestingly, the best partition scheme estimated in IQTREE using a PartitionFinder approach was very similar to the pattern of variation found at the A+T frequencies, and AT and GC skews. Both suggest and agree to split nucleotide divergence of PCGs by codon sites and coding strands. Many researcher overlooked the A+T frequencies and AT / GC skews features in most phylogenetic analyses, if any, they estimate the best partition scheme in IQTREE (Nguyen et al., 2015), PartitionFinder2 (Lanfear et al., 2017) or similar software. If they do so, they may use different approaches: (1) edge-linked partition models (-q command in IQTREE), (2) allowing partition-specific rates (-spp option), and (3) edge-unlinked partition models (-sp). Linked branch lengths share a single set of relative branch lengths but they can be modified in a second step to allow partition-specific rates (Lanfear et al., 2012). Under the same topology and depending on the likelihood of each subset model, an independent rate multiplier is added to each subset so all branch lengths may increase or decrease by such factor (Lanfear et al., 2012). By contrast, when branch lengths are fully unlinked they are estimated independently for each model in each subset (Lanfear et al., 2012). The results obtained here based on A+T frequencies, and AT and GC skews suggest that their nucleotide substitution models must be estimated independently (-sp) since the substitution model parameter values across partitions are different. However, many studies apply the edge-linked partition model, in which all partition share the same set of branch length, in mitochondrial PCGs datasets so they generally overestimate the number of independent partitions (e.g., Wang et al., 2019). The analysis of our data based on an edge-unlinked partition model or allowing partition-specific rates also produced schemes with more independent partitions (nine and eight, respectively; see Data S5). Such larger splitting overestimate the differences in A+T frequencies, and AT and GC skews particularly, because splits include first and second codon sites that possess lower number of substitutions (i.e., a lower rate). A recent study based on simulations determined that phylogenetic models proportionally linking branch lengths across partitions fits better than unlinked models (Duchêne et al., 2020). However, unlinked branch length models over subsets is more accurate only for phylogenetic studies comprising long sequences from moderate to large numbers of terminals (Duchêne et al., 2020) such as most mitogenomic analyses. On the other hand, fully unlinked branch length models would be strongly disfavored for phylogenomic studies with large numbers of loci (Duchêne et al., 2020). Our findings also apply to phylogenetic analyses at the amino acid level and hence we suggest implementing edge-unlinked partition model in IQTREE and other similar software in phylomitogenomic analyses.
The published phylogenies comprising a larger number of Trigonopterus species (Tänzler et al., 2014; Tänzler et al., 2016; Toussaint et al., 2017) clearly indicate its origin in New Guinea-Australia, a subsequent dispersal to Sulawesi, followed by multiple colonization of the islands further west. Thus, T. triradiatus and T. selaruensis from the Tanimbar Archipelago belonging to the T. illitus- respectively the T. nasutus-group can be expected in a basal phylogenetic position. The remaining ten species are characterized by the derived morphological character of a stridulatory patch. A clade comprising all species from Sulawesi and Borneo (T. kotamobagensis to T. carinirostris, Fig. 7) and dated 37.06 MA is equivalent to “clade G” of Tänzler et al. (2016-Fig. S1). This evolutionary scenario is best compatible with the Bayesian reconstruction based on AA sequences, possibly by reducing the low saturation found at the nucleotide level particularly on third codon sites (Fig. 6, left panel). The ML reconstruction of nucleotide sequences (Fig. 6, right panel), e.g., places T. tanimbarensis with high support at the base—a very implausible position under the considerations above. The same effect is visible in the BEAST analysis (Fig. 7) with none of the basal nodes showing high support. The twelve Trigonopterus species included herein cover most of the genus’ diversity, i.e., a large clade that presumably evolved rapidly in “Proto New Guinea”. This newly formed island arc to the North of Australia would later be amalgamated with other terranes into present New Guinea. Its supposed emergence time (Baldwin, Fitzgerald & Webb, 2012; Hall, 2009) coincides with the age of the crown group of Trigonopterus found here and by Letsch et al. (2020a) and Letsch et al. (2020b). The rate estimated from our calibration constraint of 0.0104 × 10−08 nucleotide substitution per site, year and lineage (95% confidence interval 0.0085–0.0131 × 10−08) is equivalent to a pairwise divergence of 2.08% per my, and similar to Brower’s rate of 2.3% per my for mitochondrial genes (Brower, 1994). Our nucleotide substitution rate estimation in Trigonopterus is also within the confidence interval estimated from mitochondrial PCGs in Coleoptera (Pons et al., 2010; mean 2.68% per my, 95% confidence interval 1.76–3.78%).
It is remarkable that the mitogenomes studied do not allow the reconstruction of an identical, robust infrageneric phylogeny of Trigonopterus with all methods applied. Since phylogenetic signal is not saturated in this highly diverse genus, a rapid radiation about 50 Ma could also explain the lack of resolution on the basal nodes. A denser sampling with more species included should break some of the long branches and lead to more uniform results across phylogenetic analyses. In fact, the analyses of many species and the implementation of complex models taking into account compositional biases, (i.e., heterogeneity) such as a site heterogeneous mixture model in Phylobayes (Lartillot, Lepage & Blanquart, 2009; Lartillot, Brinkmann & Philippe, 2007) and a nonhomogeneous model in nhPhyML (Boussau & Gouy, 2006), improved the phylogeny of higher taxonomic ranks within Coleoptera by suppressing or reducing long-branch attraction (Timmermans et al., 2016; Yuan et al., 2016). Those studies also suggested that partitioning mitochondrial PCGs by codon sites and strands already improved the phylogenetic signal though hard polytomies (true polytomies) as consequence of an ancient fast radiation cannot be solved in spite of adding more data or applying state-of-the-art evolutionary models.
Conclusions
This study summarizes the gene content of ten complete and two partial mitogenomes of twelve Trigonopterus weevil species representing a large radiation from the Indo-Australian Archipelago. A comprehensive analysis of nucleotide and amino acid composition across genes, codons, strands, and species indicates the most variation in mitogenome sequences at the codon and strand level. The best partition scheme estimated by IQTREE for the 13 mitochondrial PCGs matched those previous results suggesting that the split of sequence variation at the codon and strand level increases phylogenetic signal. The phylogeny obtained from PCGs sequences propose the origin of Trigonopterus in New Guinea-Australia, a posterior colonization of Sulawesi, and finally to islands further west.
Supplemental Information
Nucleotide content table
List of A+T frequencies, AT skews, and GC skews for each species Trigonopterus for complete mitochondrial genomes, and at gene, partition, and codon site levels. Translation of species code to species name is in Table 1.
Amino acid content table
List of amino acid frequencies for each Trigonopterus species for each gene, as a protein gene set, and as protein set for each coding strand. Translation of species code to species name is in Table 1.
Plot of coverage values across mitogenome contig from control region 1 (CR1) to rrnS1 (see Fig. 1)
Regions corresponding to CR1 and CR2 are indicated on x-axis (in bp) with a line. Translation of species code to species name is given in Table 1.
Python script to calculate nucleotide and aminoacid composition and AT and GC skews in mitogenomes as raw data
Individual sequence alignments for each tRNA of the twelve Trigonopterus species
a) Inverted repeats found in the control region 1 (CR1) in the mitogenome of the twelve Trigonopterus species included in this study. b) Alignment of the 10 complete CR1 using BlastAlign excluding sequences with more than 99% gaps
DNA alignment of the non-coding region encoded between trnS2 and nad1 gene in the twelve Trigonopterus species included in this study
Lower case letters indicate sequence corresponding to nad1 gene. Motifs of 22 and 5 bp were extracted from Wang et al. (2019).
Best partition schemes estimated in IQTREE. First scheme is based on edge-linked partition models (-q command), and second one on partition-specific rates (-spp command); both in nexus format
Nucleotide dataset of twelve Trigonopterus species plus two outgroups for phylogenetic analyses
Nucleotide sequence alignment of the 13 mitochondrial PCGs concatenated in nexus format including gene sets and best partition scheme.