Article

ANLN and TLE2 in Muscle Invasive Bladder Cancer: A Functional and Clinical Evaluation Based on In Silico and In Vitro Data

1
Department of Urology and Urosurgery, Medical Faculty Mannheim, University of Heidelberg, 68167 Mannheim, Germany
2
Institute of Pathology, Medical Faculty Mannheim, University of Heidelberg, 68167 Mannheim, Germany
3
Institute of Pathology, University Hospital Erlangen, Friedrich-Alexander-University Erlangen-Nürnberg, 91052 Erlangen, Germany
*
Author to whom correspondence should be addressed.
Cancers 2019, 11(12), 1840; https://doi.org/10.3390/cancers11121840
Submission received: 15 October 2019 / Revised: 15 November 2019 / Accepted: 19 November 2019 / Published: 21 November 2019
(This article belongs to the Special Issue Cancer Biomarkers)

Abstract

:
Anilin actin binding protein (ANLN) and transducing-like enhancer protein 2 (TLE2) are associated with cancer patient survival and progression. The impact of their gene expression on progression-free survival (PFS) of patients with muscle invasive bladder cancer (MIBC) treated with radical cystectomy (RC) and subtype association has not yet been investigated. qRT-PCR was used to measure the transcript levels of ANLN and TLE2 in the Mannheim cohort, and validated in silico by The Cancer Genome Atlas (TCGA) cohort. Uni- and multivariate Cox regression analyses identified predictors for disease-specific survival (DSS) and overall survival (OS). In the Mannheim cohort, tumors with high ANLN expression were associated with lower OS and DSS, while high TLE2 expression was associated with a favorable OS. The TCGA cohort confirmed that high ANLN and low TLE2 expression was associated with shorter OS and disease-free survival (DFS). In both cohorts, multivariate analyses showed ANLN and TLE2 expression as independent outcome predictors. Furthermore, ANLN was more highly expressed in cell lines and patients with the basal subtype, while TLE2 expression was higher in cell lines and patients with the luminal subtype. ANLN and TLE2 are promising biomarkers for individualized bladder cancer therapy including cancer subclassification and informed MIBC prognosis.

1. Introduction

Bladder urothelial carcinoma (BLCA) is the most common urinary tumor worldwide with about 386,000 new cases and nearly 150,200 deaths each year [1]. Non-muscle-invasive bladder cancers (NMIBC; 70%) are not immediately life threatening but often progress, while muscle-invasive bladder cancers (MIBC; 30%) are responsible for the most cases of metastases and death [2]. The current therapeutic standard for MIBC is radical cystectomy (RC) with perioperative platinum-based chemotherapy in selected cases [3]. The clinical management of MIBC is currently limited. First, potentially inadequate treatment decisions are informed by a limited clinicopathological staging system [4]. Therefore, mRNA-based molecular subtyping of MIBC, which shows target genes enriched in specific molecular subtypes, has emerged as a promising tool with the potential to stratify patients for treatment [5]. Luminal and basal differentiated tumors are characterized by specific gene expression, such as Keratin 5 (KRT5) in the basal subtype and KRT20 in the luminal subtype [6]. Second, the onset of BLCA is a multi-factorial and multi-step formation process involving multiple genes [7,8]. Therefore, in-depth study of the molecular mechanisms of the genes closely related to the malignant progression of BLCA and therapeutic relevant targets will help to understand the regulatory mechanisms of key genes in the development and progression of BLCA.
Anilin actin binding protein (ANLN) is located on chromosome 7q14.2 and encodes for a 1,125 amino acid actin-binding protein that includes a conserved N-terminal actin (F-actin) and myosin binding region and a conserved C-terminal pH binding domain [9]. Previous studies found that ANLN expression levels were significantly up-regulated in a variety of tumor tissues, including breast, ovarian, colon, lung, and pancreatic cancers [10,11,12,13,14,15]. Furthermore, ANLN and its encoded protein are highly expressed in BLCA tissues, and their expression levels are positively correlated with the pathological grade and stage of BLCA [16]. However, the involved signaling pathways and the interacting molecular targets in the regulation of BLCA biological function are in discussion.
Transducing-like enhancer protein 2 (TLE2), a member of the TLE gene family, is located on chromosome 19p13.3, and acts as a transcriptional corepressor [17]. Previous studies revealed that the molecular properties of the TLE2 protein point to a function in transcriptional regulation, involved in embryonic neuronal development in conjunction with Hairy/Enhancer of split (HES) proteins [17,18]. The TLE2 protein inhibits replication-and-transcription-activator-mediated transactivation and lytic reactivation of Kaposi’s sarcoma-associated herpesvirus [19]. The function of TLE2 in BLCA has not yet been investigated.
In a previous study, ANLN expression was associated with Wnt/β-catenin signaling in gastric cancer [20]. Also, the Wnt/β-catenin pathway regulates gene expression via T-cell factor/lymphoid enhancer-binding factor 1 (TCF/LEF1) family, which is repressed by transcription factors for TLEs [21,22]. However, the association between ANLN and TLE2 was not elucidated yet.
This study was the first to investigate the expression of TLE2 in human urothelial cell lines and MIBC samples in correlation with histopathology and survival data. The involved signaling pathways and the impact of ANLN and TLE2 on MIBC molecular subtypes were also evaluated.

2. Results

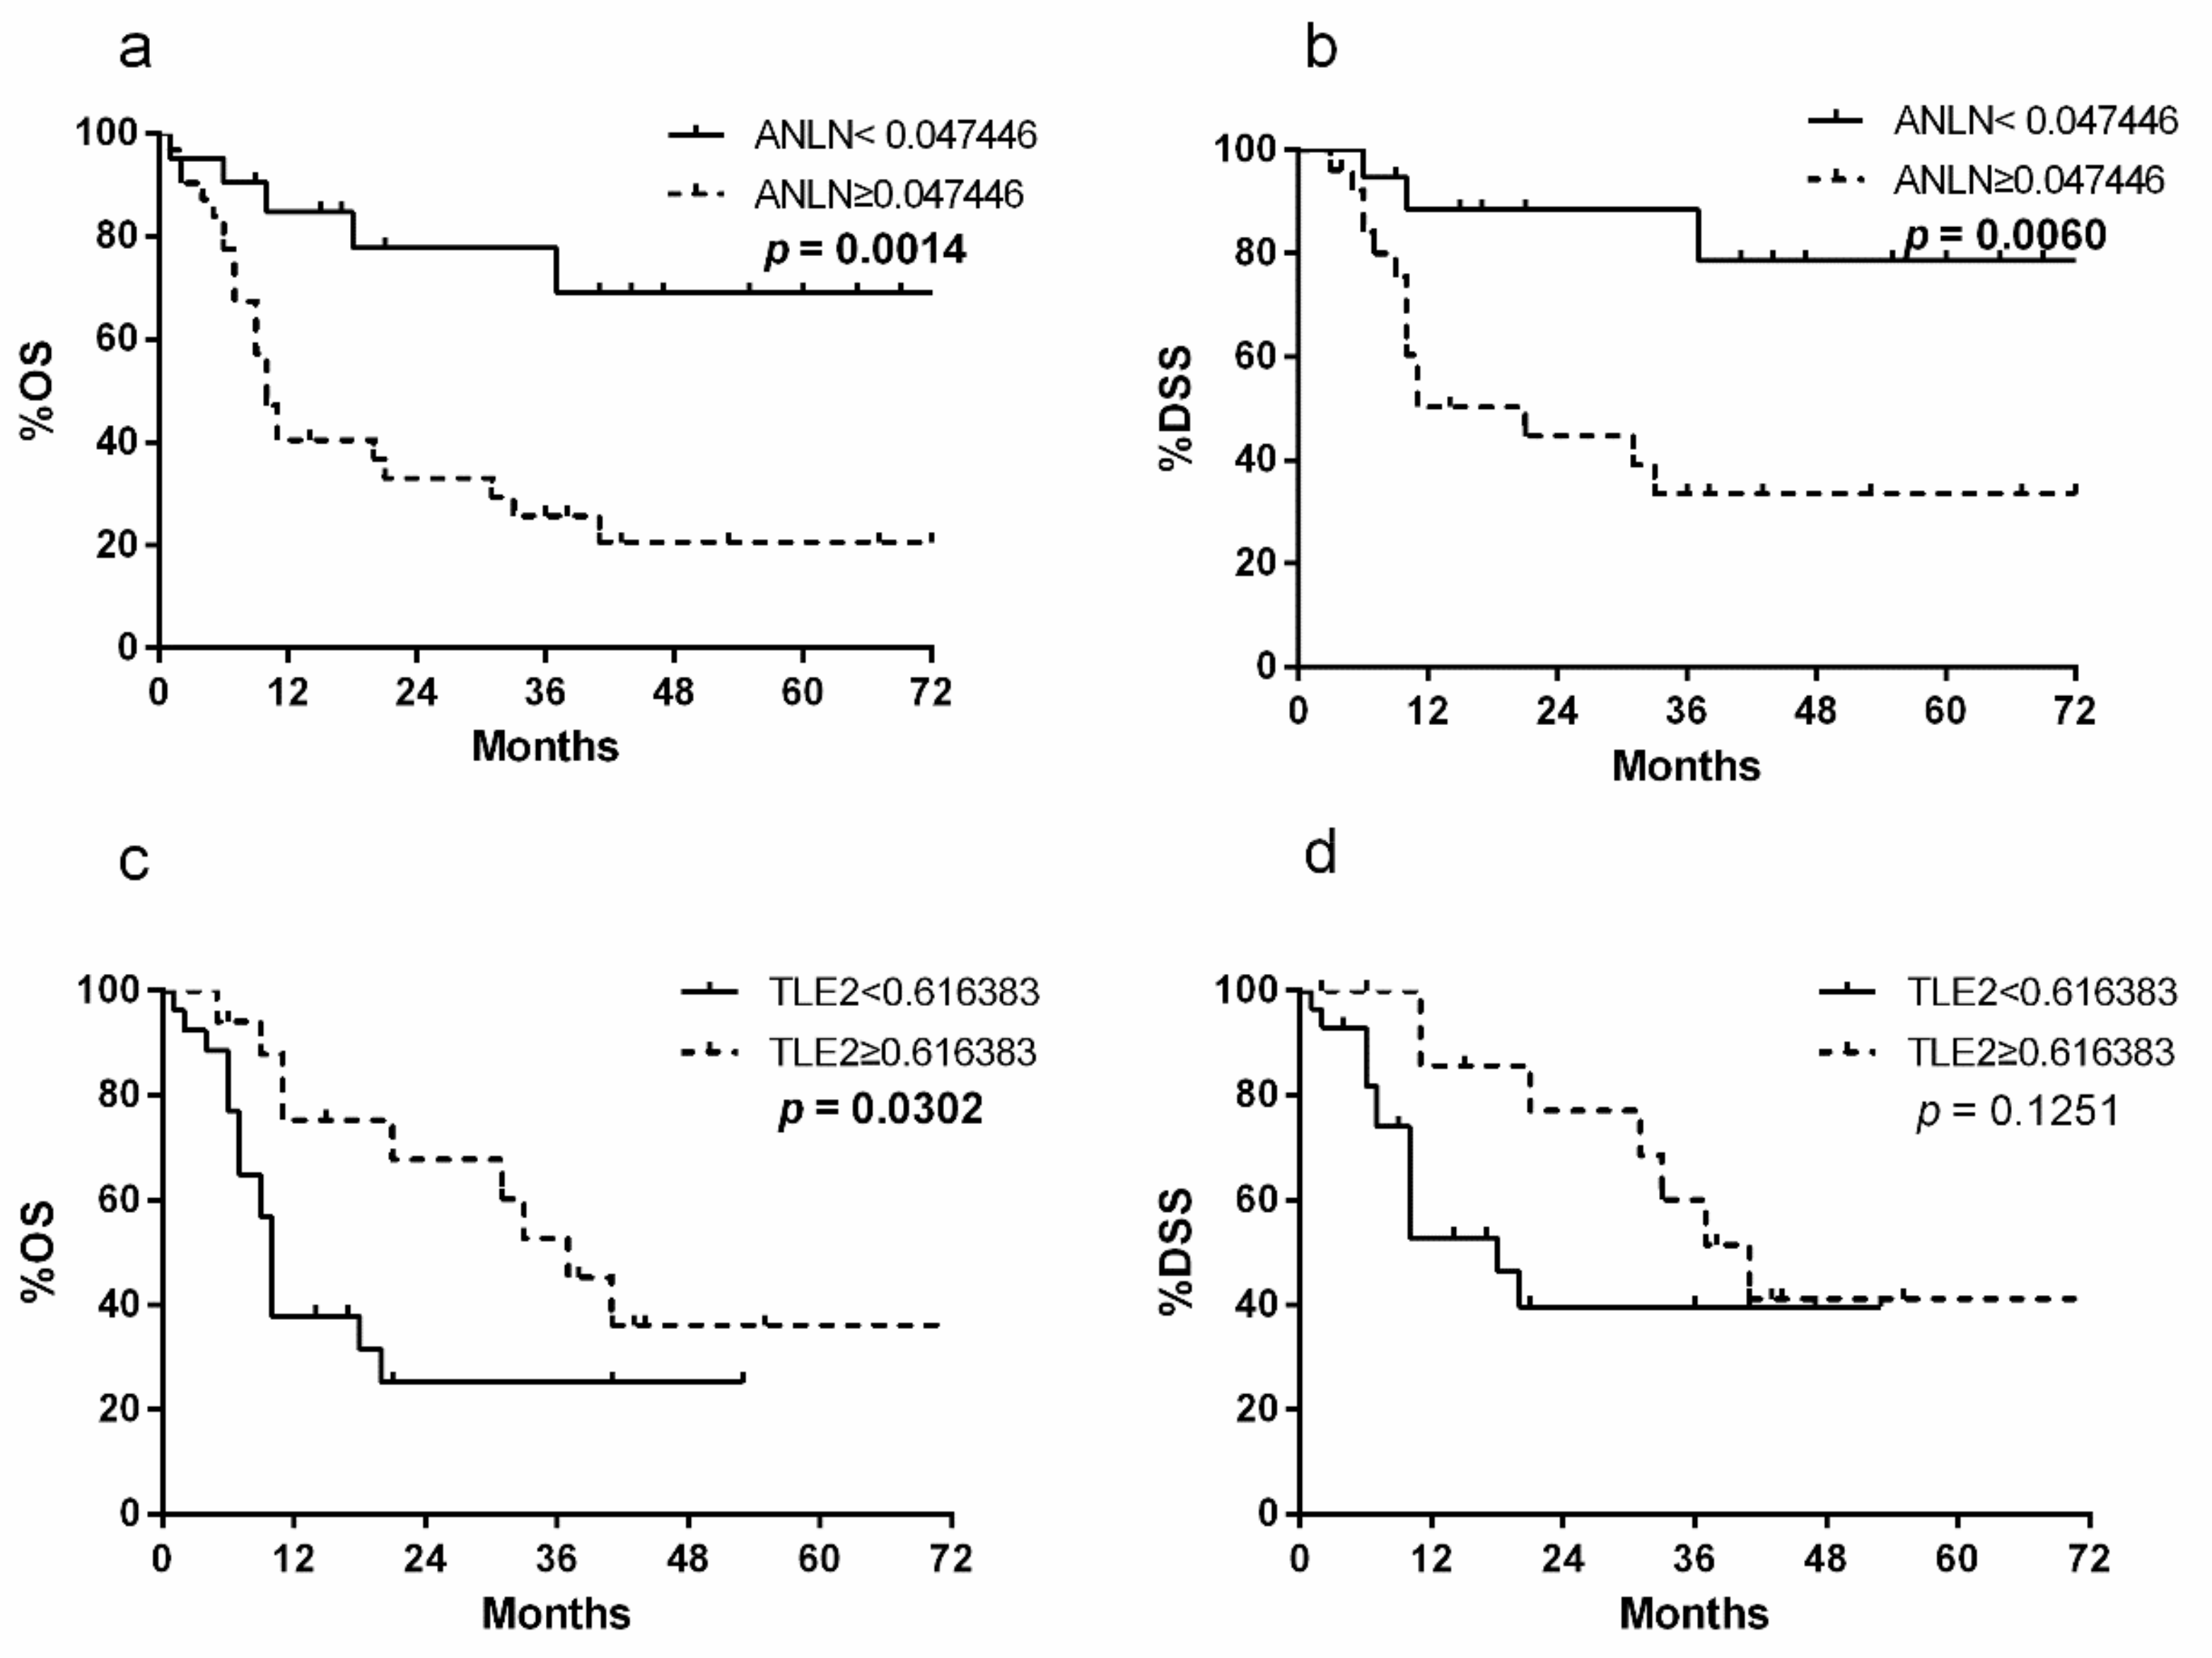
2.1. Patient Population and Survival Analysis

Demographic and clinical-pathological data of the 60 patients with MIBC included in the Mannheim cohort are shown in Table 1. Median follow-up of the entire cohort was 15 months (range 3–99 months) and the median follow-up of surviving patients was 38 months (range 9–99 months). In total, 26 patients (43.33%) suffered a relapse (local relapse n = 3, lymph nodes and/or distant metastases n = 15, unclear metastasis pattern n = 8). Of the 33 (55.00%) patients who died during the follow-up, 26 (43.33%) of them died due to BLCA.

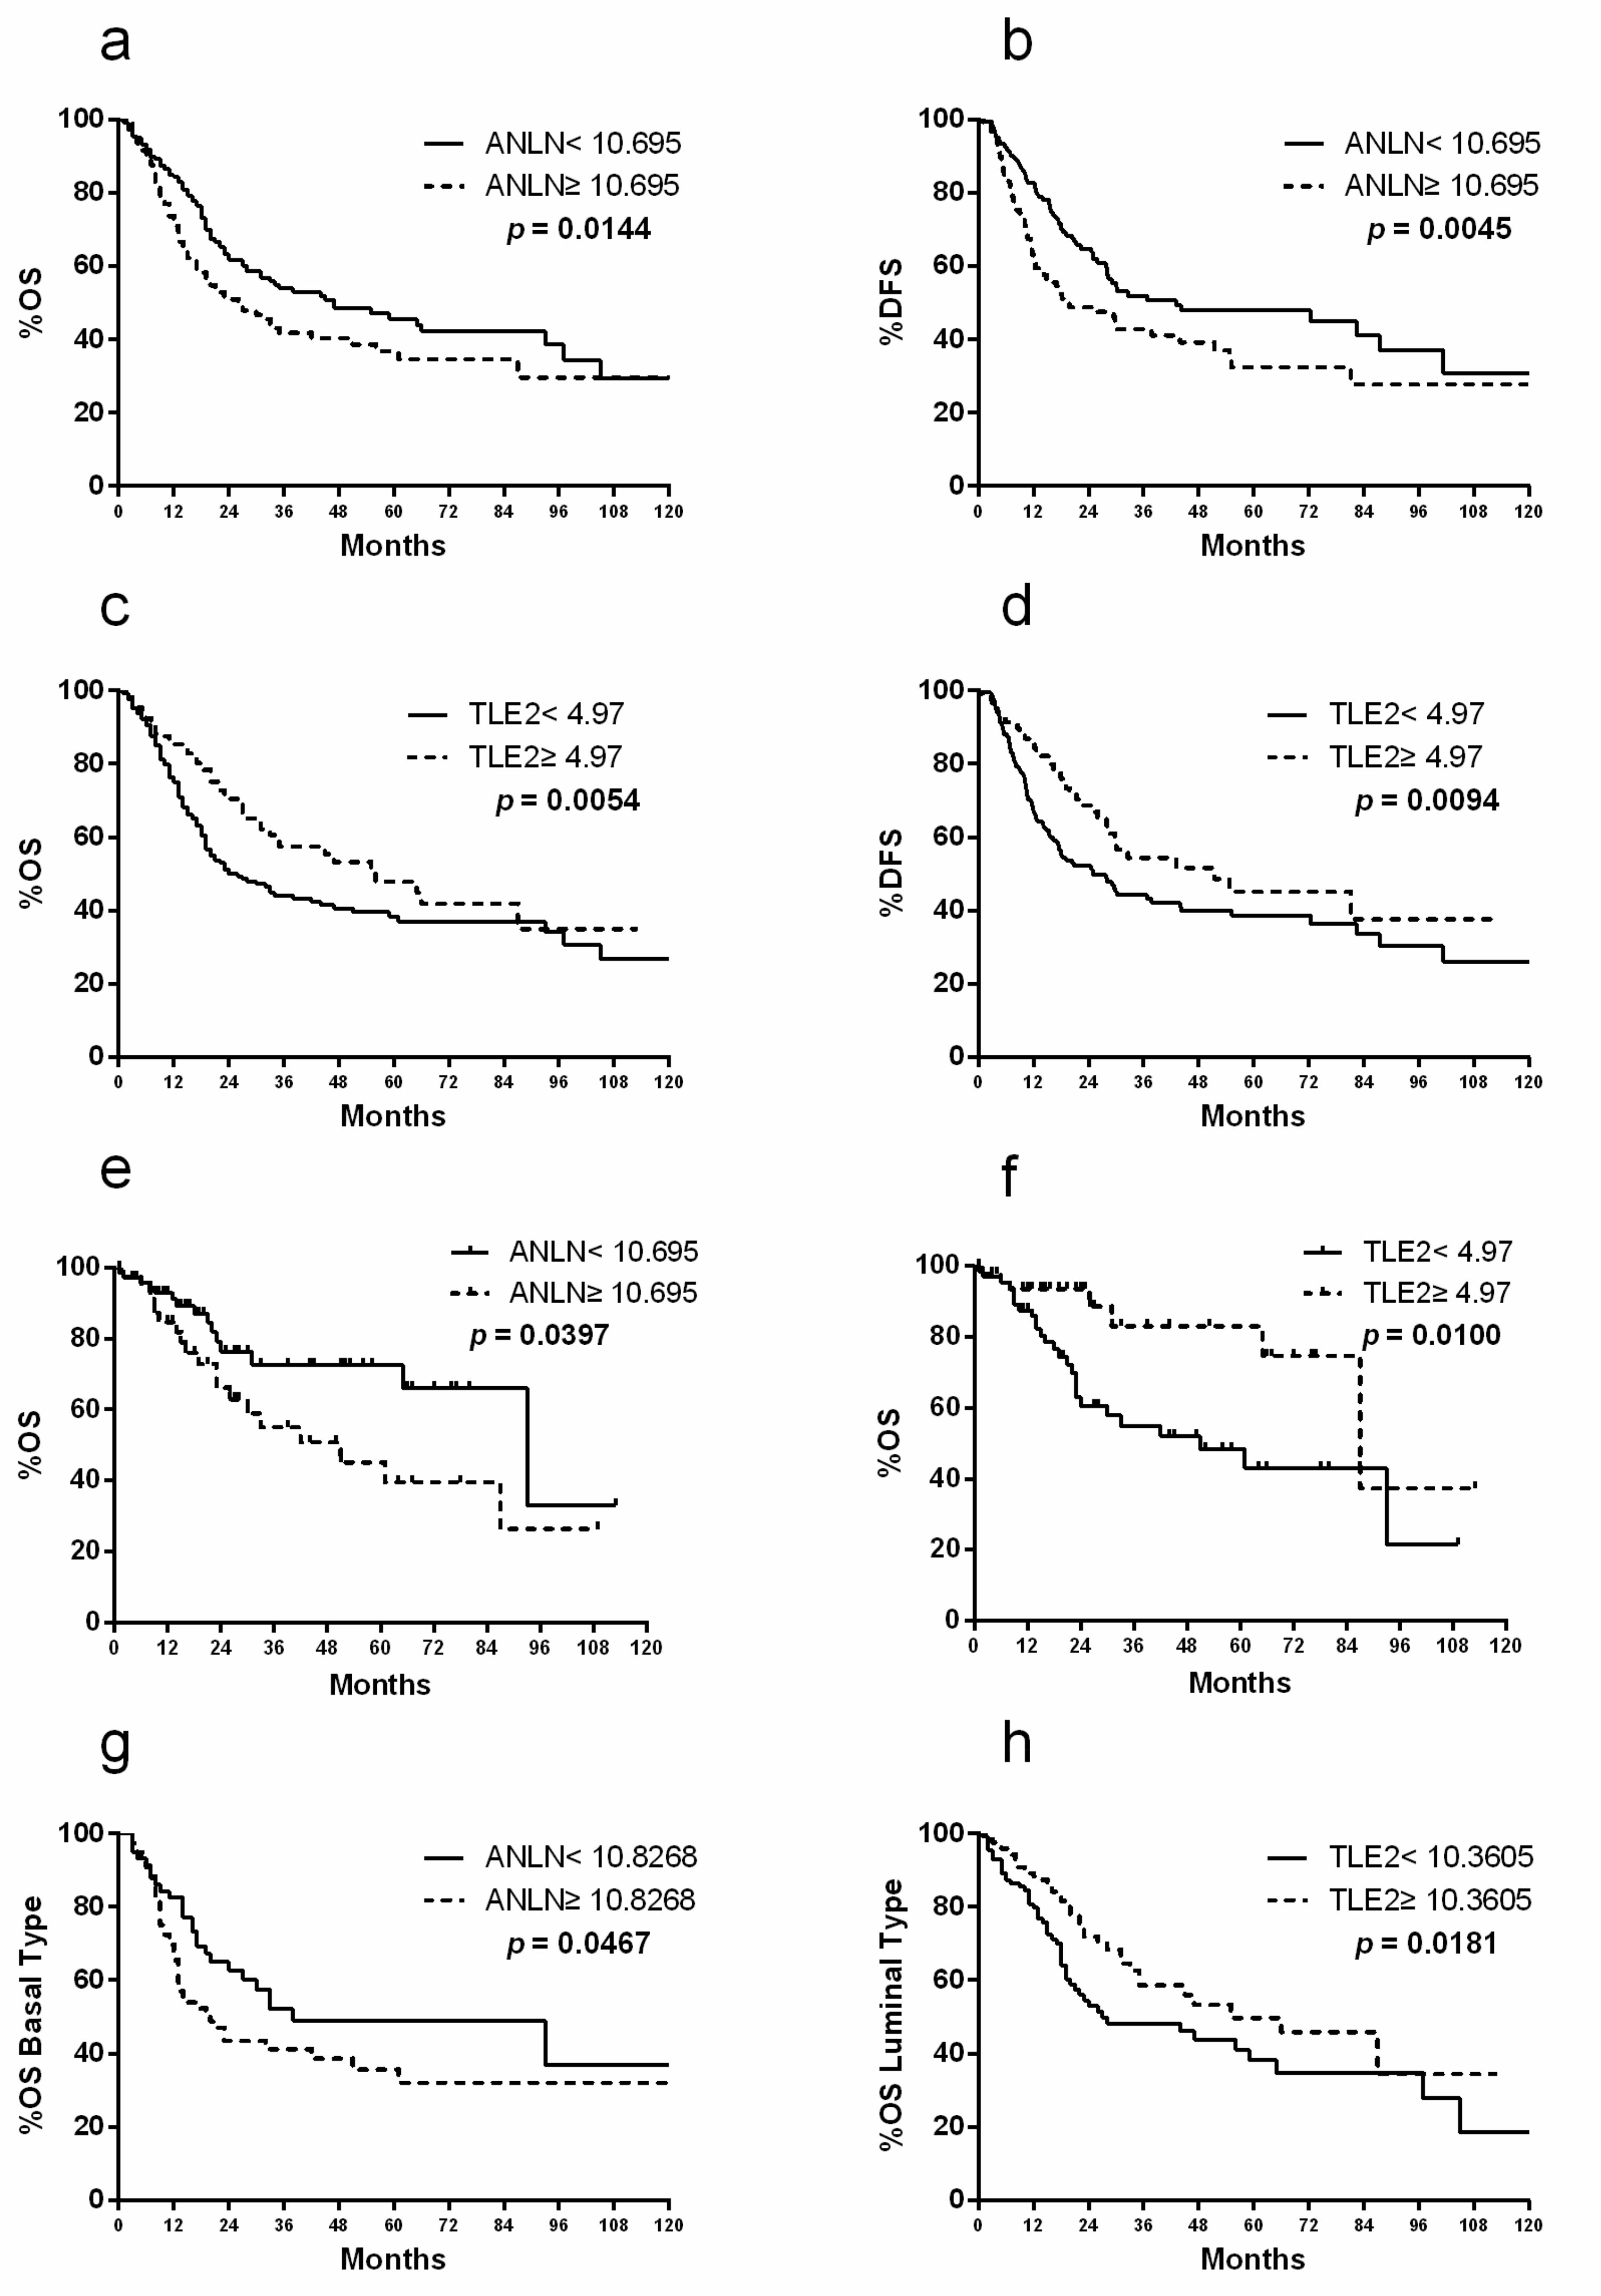
2.2. ANLN and TLE2 as Risk Markers for Prognostic Prediction After RC

In the Mannheim cohort, patients with high ANLN expression showed worse overall survival (OS) (n = 22 with low expression, n = 38 with high expression; median survival, 21 vs. 10 months, and p = 0.0010) and disease-specific survival (DSS) (n = 20 with low expression, n = 40 with high expression; median survival, 21 vs. 10 months, and p = 0.0060) after RC than patients with low expression (Figure 1a,b). Conversely, patients with high TLE2 expression displayed more favorable OS (n = 29 with high expression, n = 31 with low expression; median survival, 15 vs. 9 months, and p = 0.0236) and DSS (n = 29 with high expression, n = 31 with low expression; median survival, 31 vs. 13 months, and p = 0.2083) than patients with low expression (Figure 1c,d). The gene expression levels were not normally distributed.
In the univariate and multivariate Cox regression analysis, ANLN (p = 0.0020 and p = 0.0390, respectively) and TLE2 (p = 0.0120 and p = 0.0020, respectively) expression were independent predictors. Furthermore, lymph node status was identified as an independent prognostic factor by both analyses (p = 0.0030 and p = 0.0240), as was lymphovascular invasion (LVI) (p = 0.0040) by only the univariate Cox regression analysis (Table 2). No significant correlation was observed between patient age, patient gender, or stage of tumor and ANLN and TLE2 expression.
In The Cancer Genome Atlas (TCGA) cohort, higher ANLN expression was associated with worse OS (n = 246 with low expression, n = 161 with high expression; median survival, 18.07 vs. 15.31 months, and p = 0.0144) and disease-free survival (DFS) (n = 246 with low expression, n = 161 with high expression; median survival, 18.82 vs. 13.99 months, and p = 0.0045, Figure 2a,b). In contrast, higher TLE2 expression was associated with more favorable OS (n = 250 with low expression, n = 157 with high expression; median survival, 16.69 vs. 18.99 months, and p = 0.0054) and DFS (n = 250 with low expression, n = 157 with high expression; median survival, 15.31 vs. 16.79 months, and p = 0.0094, Figure 2c,d). In the TCGA cohort, correlation between ANLN and TLE2 expression and stage showed that ANLN was significantly expressed in pT3 and pT4 (higher stages, median expression 9.95 vs. 10.16, and p = 0.0109, Figure S1a), while TLE2 was dominantly expressed in pT2 (lower stage, median expression 9.88 vs. 9.73, and p = 0.0228, Figure S1b). Further analysis of the TCGA bladder cancer cohort according to clinical stage showed that lower ANLN (n = 77 with low expression, n = 41 with high expression; median survival, 23.43 vs. 19.66 months, and p = 0.0397) and TLE2 (n = 67 with low expression, n = 51 with high expression; median survival, 17.94 vs. 20.37 months, and p = 0.0100) expression in the pT2 subgroup could be attributed to a good and poor prognosis of OS, respectively (Figure 2e,f). Furthermore, the gene expression of ANLN and TLE2 was analyzed in subtypes of MIBC. Notably, in the TCGA cohort, ANLN expression in patients with MIBC and basal subtype was associated with worse OS (n = 61 with low expression, n = 81 with high expression; median survival, 20.37 vs. 13.96 months, and p = 0.0467, Figure 2g) compared with the whole TCGA cohort. Higher TLE2 expression showed better OS in patients with MIBC and luminal subtype (n = 130 with high expression, n = 115 with low expression; median survival, 19.48 vs. 17.87 months, and p = 0.0181, Figure 2h) compared with the whole TCGA cohort. The gene expression levels were not normally distributed.
In the univariate Cox regression analysis of clinicopathological features, stage (p < 0.001), lymph node status (p < 0.001), ANLN (p = 0.0160), and TLE2 (p = 0.0060) expression were independent. Furthermore, stage (p = 0.0060), ANLN (p = 0.0180), and TLE2 (p = 0.0400) were also independent prognostic factors in the multivariate Cox regression analysis (Table 3).

2.3. Gene Expression Profiling of ANLN and TLE2 in Comparison with other Tumor Entities

Bar plots compared the gene expression profiles across all 31 tumor samples and paired normal tissues from TCGA database. ANLN expression was confirmed to be up-regulated in the majority of tumor samples (26/31, 83.87%), while TLE2 was down-regulated in the majority of tumor samples (25/31, 80.64%). In BLCA tumor samples, ANLN expression was up-regulated (median expression 16.72) compared to normal tissues (median expression 1.54; Figure S2a), while TLE2 expression was down-regulated (median expression 22.27) compared to normal tissues (median expression 60.99; Figure S2b). The dot-box plots with data normalized for log-scale showed that ANLN expression was significantly higher in BLCA tumor samples than normal tissues (median expression 4.15 vs. 1.34, and p < 0.001, Figure S2c). In contrast, TLE2 expression was significantly lower in BLCA samples than in normal tissues (median expression 4.54 vs. 5.95, and p < 0.001, Figure S2d).

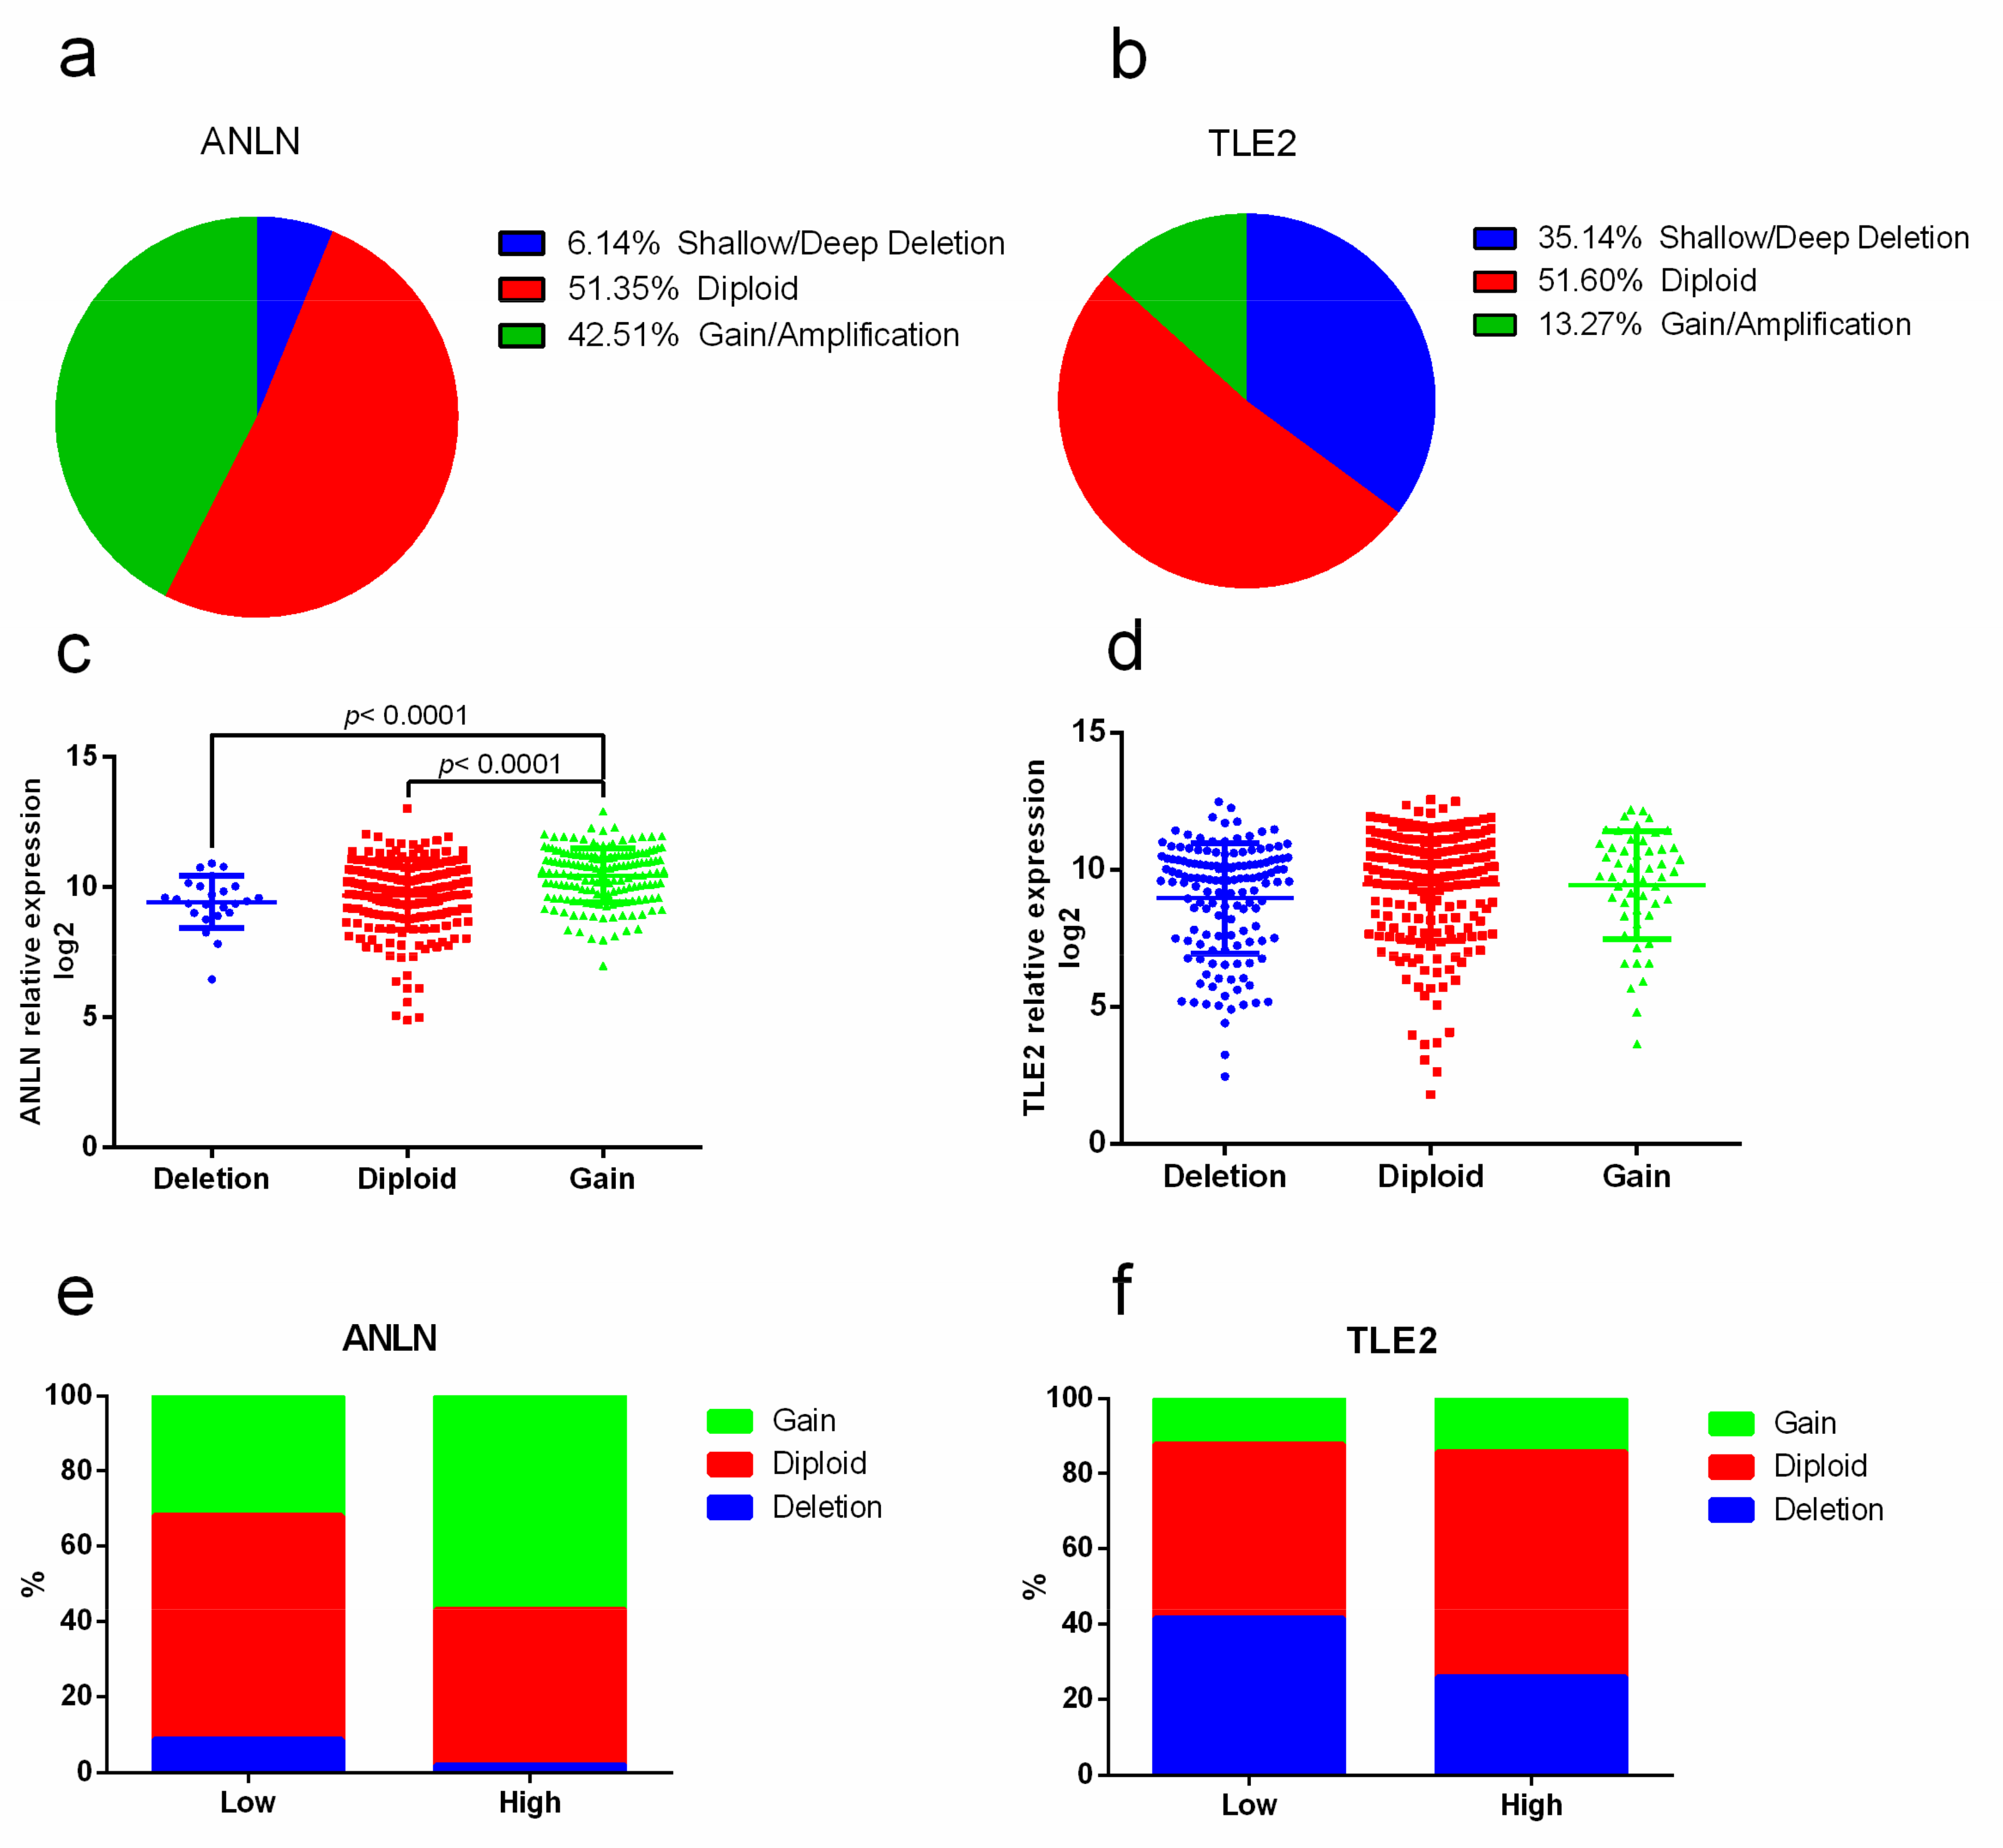
2.4. Association of Copy-number Alterations with ANLN and TLE2 Gene Expression

Analysis of ANLN and TLE2 gene expression in association with copy-number alterations revealed a genetic alteration rate of 10% (41/407) for ANLN and 5% (21/407) for TLE2. Putative copy-number alterations including deep/shallow deletion, diploid, gain, and amplification were acquired from GISTIC (Genomic Identification of Significant Targets in Cancer). The majority of copy-number alteration signatures for ANLN were gains and amplifications rather than deletions (number 173 vs. 25, 42.51% vs. 6.14%, median expression 10.54 vs. 9.45, and p = 0.0002, Figure 3a). For TLE2, most samples showed deletion variations rather than amplifications (number 143 vs. 54, 35.14% vs. 13.27%, median expression 9.63 vs. 9.77, and p = 0.0394, Figure 3b). Significantly higher expression of ANLN was observed in the subgroup with gain compared to diploid (median expression 10.54 vs. 9.88, and p < 0.0001) and deletion (median expression 10.54 vs. 9.45, and p < 0.0001, Figure 3c). There were no significant differences in TLE2 expression in the subgroups with deletion compared to diploid (median expression 9.63 vs. 9.98, and p = 0.1458) or gain (median expression 9.63 vs. 9.73, and p = 0.9190, Figure 3d). When gene expression levels were grouped into low and high expression, analysis revealed higher rates of amplification/gains in the subgroup with higher ANLN expression (n = 86, 56.90%) compared to lower ANLN expression (n = 77, 31.95%, Figure 3e). In contrast, amplification was only observed in 12.2% (n = 30) of the TLE2 low expression group and in 14.29% (n = 22) of the TLE2 high expression group (Figure 3f). Furthermore, higher rates of deletion were seen in the TLE2 low expression subgroup than in the TLE2 high expression subgroup (n = 102, 41.46% vs. n = 40, 25.97%).

2.5. Correlation with Signaling Pathways and Therapeutic Targets in Bladder Cancer

The protein-protein interactions of ANLN and TLE2 were analyzed by Search Tool for Retrieval of Interacting Genes/Proteins (STRING, Figure S3). The number of counted gene sets and the false discovery rate for each Gene Ontology (GO) term are shown in Table S2. The interaction network based on curated databases and experimentally derived results showed that key molecules in signaling pathways were significantly correlated with ANLN and TLE2, including cell proliferation (false discovery rate, FDR = 1.99−10), Notch signaling (FDR = 2.38−9), Wnt signaling (FDR = 2.38−9), and hormone receptor (FDR = 3.16−8). The correlation with important therapeutic targets in BLCA, including epidermal growth factor receptor (EGFR) (p = 7.73−31 for ANLN and p = 1.78−14 for TLE2), Erb-B2 receptor tyrosine kinase 2 (ERBB2) (p = 3.44−13 for ANLN and p = 1.96−43 for TLE2), fibroblast growth factor receptor 3 (FGFR3) (p = 6.52−9 for ANLN and p = 0.0016 for TLE2), and programmed death-ligand 1 (PD-L1) (p = 2.89−18 for ANLN and p = 1.07−18 for TLE2) were found to be significantly correlated with ANLN and TLE2 based on TCGA data (Table 4).
It is noteworthy that ANLN was positively correlated with cell proliferation markers including cyclin-dependent kinase 1 (CDK1) (ρ = 0.594, p = 3.98−40), Rac GTPase activating protein 1 (RACGAP1) (ρ = 0.725, p = 1.41−67), marker of proliferation Ki-67 (MKI67) (ρ = 0.711, p = 7.56−64), and forkhead box M1 (FOXM1) (ρ = 0.688, p = 2.98−58). In contrast, TLE2 was negatively correlated with cell proliferation molecules involving CDK1 (ρ = -0.338, p = 2.63−12), RACGAP1 (ρ = -0.451, p = 9.46−22), MKI67 (ρ = -0.396, p = 1.07−16), and FOXM1 (ρ = -0.400, p = 4.46−17). TLE2 was also correlated with molecules involved in Wnt signaling including catenin beta 1 (CTNNB1) (ρ = -0.276, p = 1.6−8) and hormone receptors including forkhead box A1 (FOXA1) (ρ = 0.505, p = 9.11−28) and GATA binding protein 3 (GATA3) (ρ = 0.65, p = 2.8−50; Table 4). Further, expression of RACGAP1, MKI67, FOXM1, CDK1, CTNNB1, and GATA3 were examined in the Mannheim cohort. This analysis showed that ANLN was significantly correlated with RACGAP1 (ρ = 0.455, p < 0.0001), FOXM1 (ρ = 0.549, p < 0.0001), MKI67 (ρ = 0.577, p < 0.0001), and CDK1 (ρ = 0.763, p < 0.0001; Figure S4a–d). TLE2 was significantly correlated with GATA3 (ρ = 0.409, p = 0.0012) and CTNNB1 (ρ = 0.363, p = 0.0070) (Figure S4e,f). Similar expression data was also detected in the urothelial cell lines (Figure S5a).

2.6. Molecular Subtype Specificity of ANLN and TLE2

In silico RNA-seq data from the Cancer Cell Line Encyclopedia showed ANLN and TLE2 expression levels in TPM (transcripts per million) for 25 BLCA cell lines, with different molecular subtypes of each (basal, luminal, and mixed; Figure S5b). Cell lines that were classified as basal subtypes, including UMUC3 and SCaBER, showed slightly higher expression of ANLN, while TLE2 dominantly expressed in cell lines classified as luminal subtypes, e.g., RT112 and RT4. qPCR based on SYBR Green showed relative expression of ANLN and TLE2 in five malignant urothelial cell lines (RT4, RT112, UMUC3, T24, and ScaBER), which correspond with the RNA-seq data (Figure S5a). Similarly, in patients with BLCA (TCGA, Provisional), expression of ANLN was higher in the basal than in the luminal subtypes (median expression 10.93; range 6.1–13.01 vs. median expression 9.64; range 4.87–12.25, p < 0.0001, Figure S5c) according to the mRNA clustering. In contrast, TLE2 showed an opposite trend with a higher expression in luminal than basal subtypes (median expression 10.41; range 5.04–12.55 vs. median expression 7.41, range 1.79–12.25, p < 0.0001, Figure S5d). In addition, the basal subtype marker KRT5 and the luminal subtype marker KRT20 were analyzed in the Mannheim cohort. KRT5 was significantly correlated with ANLN (ρ = 0.278, p = 0.042; Figure S6a), and KRT20 was significantly correlated with TLE2 (ρ = 0.296, p = 0.026; Figure S6b). The expression of ANLN and TLE2 were also analyzed in the high KRT5 and the high KRT20 expression group, which were classified based on median expression of KRT5 and KRT20. It was observed that ANLN expression was higher in the high KRT5 group than in the high KRT20 group (p = 0.1119, Figure S6c), and TLE2 expression was higher in the high KRT20 group than in the high KRT5 group (p = 0.1413, Figure S6d).

3. Discussion

This study aimed to retrospectively evaluate the prognostic and clinical impact of ANLN and TLE2 gene expression and to validate these results in published datasets. In order to evaluate the translational benefit, gene expression was compared with molecular subtypes, targets, and relevant clinicopathologic parameters in multivariable analyses. Higher ANLN transcript levels were found to be associated with worse OS and DSS in the Mannheim cohort, which corresponds with results from previous studies of BLCA and upper urinary tract urothelial carcinoma [23]. Together, these results indicate that ANLN, in addition to lymph node status, may be an independent predictor for progression-free survival (PFS), and superior to the use of T stage and LVI as predictors. As a key regulator of cytokinesis, it is not surprising that ANLN might play a critical role in carcinogenesis [24]. Previous research has established that knockdown of ANLN could significantly inhibit the proliferation of bladder cancer both in vitro and in vivo. Furthermore, knockdown of ANLN strongly suppressed the migration and invasion ability of J82 and 5637 bladder cancer cell lines [16]. Additionally, in upper urinary tract urothelial carcinoma, overexpression of ANLN in the nucleus is a poor prognostic factor, which was confirmed by data on protein levels, while low expression of ANLN in the cytoplasm is a poor prognosis maker [23].
In contrast to ANLN, TLE2 was found to be dominantly expressed in patients with lower stages of BLCA. Patients with higher TLE2 expression had a more favorable OS and DFS, both in the whole-stage group and in the T2 subgroup. These results, together with univariate and multivariate Cox regression analysis of the Mannheim and the TCGA cohort, suggest that TLE2 could serve as an independent risk factor for prognostic prediction of patients with BLCA. The most recent research about TLE2 showed an inhibition of replication and transcription in Kaposi’s sarcoma-associated herpesvirus [19]. To our knowledge, there is only very limited data about the role of TLE2 in cancer and no data specific to BLCA. Therefore, our findings are the first describing the role of TLE2 in BLCA. In adition, the Kaplan–Meier curves of ANLN and TLE2 with OS and DSS showed separation at earlier time points, but convergence at later time points, between the high and low expression group in the TCGA cohort. It indicated that the predictive capabilities of ANLN and TLE2 expression might be stronger at earlier time points after RC.
In our study, ANLN expression was strongly correlated with cell proliferation markers including CDK1, RACGAP1, MKI67, and FOXM1. In urothelial carcinoma cell lines, these genes showed a consistently strong positive correlation with the expression of ANLN, which is highly expressed in ScaBER cells and expressed in low amounts in RT4 cells. In our patient cohort, we also found a strong correlation of ANLN with RACGAP1, MKI67, and CDK1. These results indicate that ANLN could have a crucial role in tumor proliferation of MIBC. It is already known that the proliferation markers MKI67 and RACGAP1 have a significant importance in BLCA [25,26]. Previous research showed that mRNA expression of MKI67 is significantly correlated and associated with stage and grade in NMIBC [27]. Furthermore, the expression of RACGAP1 correlated significantly with the tumor stage in BLCA after RC, and RACGAP1 was strongly expressed in the early stages of NMIBC patient samples [28]. Additionally, FOXM1 has been shown to be overexpressed on the mRNA and protein levels in bladder cancer cells, and plays an important role in cisplatin resistance, outcome prediction, and risk stratification of patients with BLCA [29].
In this study, TLE2 expression correlated with several Wnt pathway components, such as β-catenin (CTNNB1), TCF7, and LEF1 in the TCGA cohort. By analyzing the expression in the Mannheim cohort, it was also found that TLE2 was significantly correlated with CTNNB1. In addition, CTNNB1 is highly expressed in RT4 cells and expressed in lower amounts in ScaBER cells, which is similar to the expression pattern of TLE2. The activation of the Wnt/β-catenin signaling pathway plays an important role in tumorigenesis and development of various cancers including BLCA [30,31,32]. Gain-of-function mutations in CTNNB1 are detected in numerous human cancers [33,34,35]; therefore, it is necessary to explore the role of Wnt/β-catenin regulated genes in BLCA. Previous research has shown that TLE2 was significantly suppressed and the level of β-catenin protein was increased in esophageal tumor cells, both of which were modulated by NDRG1 overexpression [36]. Interestingly, ANLN positively correlates with CTNNB1, while TLE2 correlates inversely with CTNNB1, which was also observed in the Mannheim cohort. Although there is no direct correlation between ANLN and TLE2 in both cohorts, the involvement of ANLN and TLE2 underlying the Wnt/β-catenin signaling pathway was preliminarily revealed by our study.
To reveal more details of ANLN and TLE2 expression in bladder cancer, the RNA-seq data of transcripts based on TCGA cohort were analyzed. Interestingly, the splice variants of ANLN and TLE2 showed different expression levels, with ANLN-201 (ENST00000265748.6), ANLN-202 (ENST00000396068.6), ANLN-210 (ENST00000457743.1), ANLN-212 (ENST00000491782.1), TLE2-201 (ENST00000262953.10), TLE2-202 (ENST00000426948.6), TLE2-204 (ENST00000455444.6), and TLE2-215 (ENST00000590101.5) highly expressed compared with other transcripts. These findings indicate that differential expression patterns of ANLN and TLE2 splice variants might potentially have a practical usefulness, which needs further investigations.
Our study demonstrates that ANLN and TLE2 show a distinct subtype-specific overexpression in BLCA cell lines. ANLN showed overexpression in basal-like urothelial carcinoma cell lines and patients, while TLE2 showed significantly higher expression in luminal-like urothelial carcinoma cell lines and patients. Interestingly, for patients with MIBC in the whole TCGA cohort, ANLN and TLE2 harbored similar prognostic values for basal and luminal subtypes, respectively. Molecular classification has emerged as a promising research tool beyond histopathology to stratify cancer patients for personalized medicine [37]. Recent years have witnessed increasing interest and research into the molecular basis of bladder cancer [6]. Several studies subclassified both MIBC and NMIBC through RNA-seq-based data and identified distinct molecular subtypes that correlated well with outcome and therapy response [5,38,39]. MIBC molecular subtypes, which are broadly grouped into basal and luminal subtypes, showed similarities to the molecular phenotypes of breast cancer [40]. It is believed that epithelial-to-mesenchymal transition (EMT) is a critical step in the progression of breast cancer, particularly the basal-like one [41]. The basal and EMT/claudin-low markers were highly expressed in the same subtype of patients with BLCA based on the TCGA database [42]. Due to the significant association with basal subtype of BLCA, it is suggested that ANLN could play a potential role in EMT in BLCA. Also, KRT5 is highly upregulated in basal and KRT20 in luminal subtype in BLCA [6]. qPCR-based molecular subtyping of BLCA by KRT5 and KRT20 mRNA expression is a method associated with the survival of patients with MIBC [43]. It is confirmed that KRT5 and KRT20 showed significant association with ANLN and TLE2 in the Mannheim cohort. The differences of ANLN and TLE2 expression were not significant in the high KRT5 and KRT20 group maybe due the fact that only KRT5 and KRT20 were used for subtype association.
Until recently, effective targets following platinum-based chemotherapy were limited for patients with advanced urothelial carcinoma. The most promising option is immunotherapy with programmed cell death 1 (PD-1)/programmed cell death ligand 1 (PD-L1) checkpoint inhibitors, coupled with the anti-cytotoxic T-lymphocyte-associated protein 4 (CTLA-4) antibodies [44,45]. Apart from differences in expression thresholds for defining PD-L1 positivity, the validated biomarkers for optimal patient selection are still unrevealed [46]. In our study, expression of ANLN and TLE2 correlate with the therapeutic targets for bladder cancer as indicated in existing research and clinical trials. Notably, ANLN was positively and TLE2 was negatively correlated with PD-L1 in the TCGA cohort. TLE2 also showed a negative correlation with PD-1 and the key immunoregulator CTLA-4. These results suggest that ANLN and TLE2 could serve as potential biomarkers for response to immunotherapy and precise therapeutic management of MIBC.

4. Materials and Methods

4.1. Patients and Tissue Samples

This study retrospectively enrolled sixty patients who received RC at the Department of Urology and Urosurgery of the University Medical Centre Mannheim between 2008 and 2011 and who had a histological diagnosis of MIBC (n = 47, 78% male, median age: 72 years, range: 41–87 years; n = 13, 22% females, median age: 74 years, and range: 71–86 years; Mannheim cohort). All patients were treated with RC and bilateral lymphadenectomy without preoperative or adjuvant chemotherapy or radiotherapy. With the help of the clinic’s internal documentation program, the following parameters were collected after examination of the pathology findings: sex, age, T-stage, N-stage, M-stage, grading, lymphovascular invasion (LVI), blood vessel invasion (VI), simultaneous carcinoma in situ (CIS), multifocality, and soft tissue positive surgical margin.
Formalin fixed paraffin embedded (FFPE) tumor tissue samples were evaluated for pathological stage according to the 2017 TNM classification from the Union for International Cancer Control (UICC) [47]. Tumors were graded using the 2017 WHO/ISUP classification [48] (Table 1). Studies involving human participants were approved by the ethical board of University Medical Centre Mannheim (2015-549-MA) and performed in accordance with relevant guidelines and regulations. The Cancer Genome Atlas cohort (TCGA, Provisional) contained RNA sequencing data of 407 patients with MIBC and complete clinicopathological data and follow-up data.

4.2. Database

Expression data of 25 human bladder cancer cell lines were collected from Cancer Cell Line Encyclopedia (Novartis/Broad, Nature 2012), including 20 bladder urothelial cell carcinomas, one bladder squamous cell carcinoma, and four bladder carcinoma cell lines from unknown primaries. Expression of ANLN and TLE2 were analyzed by Expression Atlas (https://www.ebi.ac.uk/gxa/home) and normalized by transcripts per million (TPM). Expression data of 9736 tumor samples and 8,587 normal samples across 31 types of tissues were collected from TCGA (https://tcga-data.nci.nih.gov/tcga/) and the Genotype-Tissue Expression (GTEx) projects (https://gtexportal.org/) and analyzed by cBioPortal (http://www.cbioportal.org/) and Gene Expression Profiling Interactive Analysis (GEPIA, http://gepia.cancer-pku.cn) [49]. The height of a bar in the resulting bar plots represents the median expression tumor types or normal tissue. Each dot represents the expression of ANLN and TLE2 in samples in the dot-box plots. The protein-protein interactions were analyzed by STRING (https://string-db.org/). GO enrichment analysis and Kyoto Encyclopedia of Genes and Genomes (KEGG) pathways were analyzed by Enrichr (http://amp.pharm.mssm.edu/Enrichr/) [50]. Expression of transcripts and exons was analyzed by Xena (https://xena.ucsc.edu/).

4.3. Cell Lines

Six different cell lines were used in this study, including one normal human urothelium cell line (UROtsa), two basal-like urothelial carcinoma cell lines (ScaBER and UMUC3), two luminal-like urothelial carcinoma cell lines (RT112 and RT4), and one mixed-type urothelial carcinoma cell line (T24). UROtsa cells were cultured in Roswell Park Memorial Institute medium (RPMI) with 5% fetal bovine serum (FBS). RT112, RT4, ScaBER, and UMUC3 cells were cultured in Dulbecco’s modified Eagle’s medium (DMEM) containing 10% FBS. T24 cells were cultured in McCoy’s 5A medium containing 10% FBS. UMUC3, ScaBER, RT112 and T24 cells were obtained from the European Collection of Authenticated Cell Cultures (ECACC), RT4 from the American Type Culture Collection (ATCC), and UROtsa cells from a collaborator. All cells were incubated at 37 °C in an atmosphere of 5% CO2, per manufacturer instructions. Before starting the experiment, all cell lines were authenticated by Multiplexion (Heidelberg, Germany).

4.4. RNA Extraction and qRT-PCR

The total RNA of all cell lines was isolated using the RNeasy Mini kits (Qiagen, Hilden, Germany) according to the manufacturer’s instructions using a high salt buffer content and binding of RNA to a silica membrane. After washing steps, contaminants were removed and then RNA was eluted in RNase-free water. For FFPE tissues, RNA was extracted and enriched using the magnetic-bead-based XTRAKT FFPE Kit (Stratifyer, Cologne, Germany) according to the instructions of manufacturer [28]. Next, reverse transcription was performed for cell samples using the M-MLV Reverse Transcriptase kit (Invitrogen, Thermo Fisher Scientific, Waltham, MA, USA), and, for FFPE samples, using the Superscript III® reverse transcriptase kit (Invitrogen, Thermo Fisher Scientific, Waltham, MA, USA) with sequence-specific primers. qPCR was used to measure relative mRNA expression with TaqMan Fast advanced Master Mix (Invitrogen, Thermo Fisher Scientific, Waltham, MA, USA). Experiments were performed on a StepOnePlus (Applied Biosystems, Darmstadt, Germany) with 20 s at 95 °C, followed by 40 cycles of 3 s at 95 °C, and 30 s at 60 °C. β-Glucuronidase (GUS) and Calmodulin2 (Calm2) were measured as reference genes [51,52]. The relative mRNA expression level was normalized to reference genes and determined using the 2−ΔΔCT method for cell culture samples and the 40-∆CT for FFPE samples, as previously described [53]. All primers and probes used in this study are shown in Supplementary Table S1.

4.5. Statistical Analysis

Statistical analyses were performed with SPSS 20.0 (IBM, Chicago, IL, USA) and GraphPad Prism 6.0 (GraphPad Software, La Jolla, CA, USA). A Kolmogorov–Smirnov (K-S) test was used to determine whether the data were normally distributed. Student’s t-tests were used to compare between groups of normally distributed numerical data, while Mann–Whitney U and Kruskal–Wallis tests were used to compare the non-normally distributed numerical data. Linear regression was used to determine the efficiency of amplification. Spearman tests were used to test the correlation between different gene expressions. The cut-off values (2−ΔΔCT value) of the high (≥0.047466) and low (<0.047466) ANLN expression groups, as well as the high (≥0.616383) and low (<0.616383) TLE2 expression groups were determined by receiver operating characteristic (ROC) curve analysis in the Mannheim cohort [54]. Similarly, in the TCGA cohort, the cut-off value (log2 value) of high (≥10.695 in the whole group and ≥10.8268 in the basal subgroup) and low (<10.695 in the whole group and <10.8268 in the basal subgroup) ANLN expression group, as well as high (≥4.97 in the whole group and ≥10.3605 in the luminal subgroup) and low (<4.97 in the whole group and <10.3605 in the luminal subgroup) TLE2 expression group was determined by ROC curve analysis. The Cox regression model was used for univariate and multivariate analysis to calculate hazard ratio (HR). Survival rates of patients were calculated by the Kaplan–Meier method, and comparison was made by the log-rank test. In all cases, p < 0.05 was considered statistically significant.

5. Conclusions

This study provides in silico and in vitro evidence supporting the prognostic potential of ANLN and TLE2 for patients with MIBC. These results indicate that developing ANLN and TLE2 as new biomarkers will help to further optimize personalized therapy for these patients.

Supplementary Materials

The following are available online at https://www.mdpi.com/2072-6694/11/12/1840/s1, Table S1: Primers and probes used in this study, Table S2: GO enrichment analysis by Enrichr indicated the significant GO terms for ANLN and TLE2 including biological process, molecular function, cellular component, and KEGG pathways, Figure S1: Correlation between ANLN and TLE2 expression and stage from the TCGA bladder cancer cohort (TCGA, Provisional) showed that ANLN was significantly expressed in higher T3-4 stages (median expression 9.95 vs. 10.16, p = 0.0109) (a), while TLE2 was dominantly expressed in lower T2 stage (median expression 9.88 vs. 9.73, p = 0.0228) (b), Figure S2: Expression of ANLN and TLE2 in BLCA tumor samples compared with normal tissues. ANLN expression was up-regulated (median expression 16.72) in tumors compared with normal tissues (median expression 1.54) based on TCGA data (a). TLE2 expression was down-regulated in tumors (median expression 22.27) compared with normal tissues (median expression 60.99) based on TCGA data (b). ANLN expression was significantly higher in BLCA tumor samples than normal tissues (median expression 4.15 vs. 1.34, p < 0.001) based on TCGA and GTEx projects (c), while TLE2 expression was significantly lower in in BLCA tumor samples than normal tissues (median expression 4.54 vs. 5.95, p < 0.001) based on TCGA and GTEx projects (d), Figure S3: Protein-protein interactions predicted by STRING showed the interaction network of ANLN (a) and TLE2 (b) based on curated databases and experimental determination. Figure S4: Correlation of selected genes in the Mannheim cohort. ANLN was significantly correlated with RACGAP1 (a), FOXM1 (b), MKI67 (c), and CDK1 (d). TLE2 was significantly correlated with GATA3 (e) and CTNNB1 (f), Figure S5: qPCR showed relative expression of ANLN and TLE2 in five malignant urothelial cell lines (RT4, RT112, UMUC3, T24, and ScaBER) (a). In silico RNA-seq data from the Cancer Cell Line Encyclopedia showed expression level in TPM (transcripts per million) for ANLN and TLE2 in 25 BLCA cell lines with different molecular subtypes of each (b). Expression of ANLN was higher in basal than luminal subtype (median expression 10.93 with range of 6.1 to 13.01 vs. median expression 9.64 with range of 4.87 to 12.25, p < 0.0001) in patients with BLCA (c). TLE2 expression was higher in luminal than basal subtype (median expression 10.41 with range of 5.04 to 12.55 vs. median expression 7.41 with range of 1.79 to 12.25, p < 0.0001) (d), Figure S6: Correlation of KRT5 and ANLN (a) and KRT20 and TLE2 (b) in the Mannheim cohort. ANLN expression was higher in the high KRT5 group than in the high KRT20 group (p = 0.1119, (c), and TLE2 expression was higher in the high KRT20 group than in the high KRT5 group (p = 0.1413, d).

Author Contributions

Conceptualization, S.W. and P.E.; methodology, S.W.; software, S.W.; validation, K.N. and P.E.; formal analysis, J.H.; investigation, S.W.; resources, P.E.; data curation, S.W., K.N. and P.E.; writing—original draft preparation, S.W.; writing—review and editing, P.E., K.N., J.H., C.-A.W., T.S.W., M.E. and S.P.; visualization, S.W.; supervision, P.E.; project administration, P.E.; funding acquisition, P.E.

Funding

Sheng Wu was supported by a scholarship from the China Scholarship Council. The study was funded by the common scientific pool of participating institutions.

Acknowledgments

The authors would like to thank Annette Steidler and Lena Hoffmann for excellent technical support. We are thankful to Edit911.com for providing editing services for the manuscript.

Conflicts of Interest

The authors declare no conflicts of interest.

References

  1. Jemal, A.; Bray, F.; Center, M.M.; Ferlay, J.; Ward, E.; Forman, D. Global cancer statistics. CA A Cancer J. Clin. 2011, 61, 69–90. [Google Scholar] [CrossRef]
  2. Babjuk, M.; Bohle, A.; Burger, M.; Capoun, O.; Cohen, D.; Comperat, E.M.; Hernandez, V.; Kaasinen, E.; Palou, J.; Roupret, M.; et al. EAU Guidelines on Non-Muscle-invasive Urothelial Carcinoma of the Bladder: Update 2016. Eur. Urol. 2017, 71, 447–461. [Google Scholar] [CrossRef]
  3. Shah, J.B.; McConkey, D.J.; Dinney, C.P. New strategies in muscle-invasive bladder cancer: On the road to personalized medicine. Clin. Cancer Res. 2011, 17, 2608–2612. [Google Scholar] [CrossRef] [PubMed]
  4. Svatek, R.S.; Shariat, S.F.; Novara, G.; Skinner, E.C.; Fradet, Y.; Bastian, P.J.; Kamat, A.M.; Kassouf, W.; Karakiewicz, P.I.; Fritsche, H.M.; et al. Discrepancy between clinical and pathological stage: External validation of the impact on prognosis in an international radical cystectomy cohort. BJU. Int. 2011, 107, 898–904. [Google Scholar] [CrossRef] [PubMed]
  5. Robertson, A.G.; Kim, J.; Al-Ahmadie, H.; Bellmunt, J.; Guo, G.; Cherniack, A.D.; Hinoue, T.; Laird, P.W.; Hoadley, K.A.; Akbani, R. Comprehensive molecular characterization of muscle-invasive bladder cancer. Cell 2017, 171, 540–556. [Google Scholar] [CrossRef] [PubMed]
  6. Choi, W.; Porten, S.; Kim, S.; Willis, D.; Plimack, E.R.; Hoffman-Censits, J.; Roth, B.; Cheng, T.; Tran, M.; Lee, I.-L. Identification of distinct basal and luminal subtypes of muscle-invasive bladder cancer with different sensitivities to frontline chemotherapy. Cancer Cell 2014, 25, 152–165. [Google Scholar] [CrossRef]
  7. Martens-Uzunova, E.S.; Böttcher, R.; Croce, C.M.; Jenster, G.; Visakorpi, T.; Calin, G.A. Long noncoding RNA in prostate, bladder, and kidney cancer. Eur. Urol. 2014, 65, 1140–1151. [Google Scholar] [CrossRef]
  8. Kandimalla, R.; Van Tilborg, A.A.; Zwarthoff, E.C. DNA methylation-based biomarkers in bladder cancer. Nat. Rev. Urol. 2013, 10, 327–335. [Google Scholar] [CrossRef]
  9. Miller, K.G.; Field, C.M.; Alberts, B.M. Actin-binding proteins from Drosophila embryos: A complex network of interacting proteins detected by F-actin affinity chromatography. J. Cell Biol. 1989, 109, 2963–2975. [Google Scholar] [CrossRef]
  10. Hall, P.A.; Todd, C.B.; Hyland, P.L.; McDade, S.S.; Grabsch, H.; Dattani, M.; Hillan, K.J.; Russell, S.E. The septin-binding protein anillin is overexpressed in diverse human tumors. Clin. Cancer Res. 2005, 11, 6780–6786. [Google Scholar] [CrossRef]
  11. Wang, Z.; Chen, J.; Zhong, M.-Z.; Huang, J.; Hu, Y.-P.; Feng, D.-Y.; Zhou, Z.-J.; Luo, X.; Liu, Z.-Q.; Jiang, W.-Z. Overexpression of ANLN contributed to poor prognosis of anthracycline-based chemotherapy in breast cancer patients. Cancer Chemother. Pharmacol. 2017, 79, 535–543. [Google Scholar] [CrossRef] [PubMed]
  12. Schiewek, J.; Schumacher, U.; Lange, T.; Joosse, S.A.; Wikman, H.; Pantel, K.; Mikhaylova, M.; Kneussel, M.; Linder, S.; Schmalfeldt, B. Clinical relevance of cytoskeleton associated proteins for ovarian cancer. J. Cancer Res. Clin. Oncol. 2018, 144, 2195–2205. [Google Scholar] [CrossRef] [PubMed]
  13. Wang, G.; Shen, W.; Cui, L.; Chen, W.; Hu, X.; Fu, J. Overexpression of Anillin (ANLN) is correlated with colorectal cancer progression and poor prognosis. Cancer Biomark. 2016, 16, 459–465. [Google Scholar] [CrossRef] [PubMed]
  14. Suzuki, C.; Daigo, Y.; Ishikawa, N.; Kato, T.; Hayama, S.; Ito, T.; Tsuchiya, E.; Nakamura, Y. ANLN plays a critical role in human lung carcinogenesis through the activation of RHOA and by involvement in the phosphoinositide 3-kinase/AKT pathway. Cancer Res. 2005, 65, 11314–11325. [Google Scholar] [CrossRef]
  15. Olakowski, M.; Tyszkiewicz, T.; Jarzab, M.; Krol, R.; Oczko-Wojciechowska, M.; Kowalska, M.; Kowal, M.; Gala, G.M.; Kajor, M.; Lange, D.; et al. NBL1 and anillin (ANLN) genes over-expression in pancreatic carcinoma. Folia Histochem. Cytobiol. 2009, 47, 249–255. [Google Scholar] [CrossRef]
  16. Zeng, S.; Yu, X.; Ma, C.; Song, R.; Zhang, Z.; Zi, X.; Chen, X.; Wang, Y.; Yu, Y.; Zhao, J. Transcriptome sequencing identifies ANLN as a promising prognostic biomarker in bladder urothelial carcinoma. Sci. Rep. 2017, 7, 3151. [Google Scholar] [CrossRef]
  17. Grbavec, D.; Lo, R.; Liu, Y.; Stifani, S. Transducin-like Enhancer of split 2, a mammalian homologue of Drosophila Groucho, acts as a transcriptional repressor, interacts with Hairy/Enhancer of split proteins, and is expressed during neuronal development. Eur. J. Biochem. 1998, 258, 339–349. [Google Scholar] [CrossRef]
  18. Hoffman, B.G.; Zavaglia, B.; Beach, M.; Helgason, C.D. Expression of Groucho/TLE proteins during pancreas development. BMC Dev. Biol. 2008, 8, 81. [Google Scholar] [CrossRef]
  19. He, Z.; Liu, Y.; Liang, D.; Wang, Z.; Robertson, E.S.; Lan, K. Cellular corepressor TLE2 inhibits replication-and-transcription-activator-mediated transactivation and lytic reactivation of Kaposi’s sarcoma-associated herpesvirus. J. Virol. 2010, 84, 2047–2062. [Google Scholar] [CrossRef]
  20. Pandi, N.S.; Manimuthu, M.; Harunipriya, P.; Murugesan, M.; Asha, G.V.; Rajendran, S. In silico analysis of expression pattern of a Wnt/beta-catenin responsive gene ANLN in gastric cancer. Gene 2014, 545, 23–29. [Google Scholar] [CrossRef]
  21. Cavallo, R.A.; Cox, R.T.; Moline, M.M.; Roose, J.; Polevoy, G.A.; Clevers, H.; Peifer, M.; Bejsovec, A. Drosophila Tcf and Groucho interact to repress Wingless signalling activity. Nature 1998, 395, 604–608. [Google Scholar] [CrossRef] [PubMed]
  22. Cinnamon, E.; Paroush, Z. Context-dependent regulation of Groucho/TLE-mediated repression. Curr. Opin. Genet. Dev. 2008, 18, 435–440. [Google Scholar] [CrossRef] [PubMed]
  23. Liang, P.-I.; Chen, W.T.; Li, C.-F.; Li, C.-C.; Li, W.-M.; Huang, C.-N.; Yeh, H.-C.; Ke, H.-L.; Wu, W.-J.; Chai, C.-Y. Subcellular localisation of anillin is associated with different survival outcomes in upper urinary tract urothelial carcinoma. J. Clin. Pathol. 2015, 68, 1026–1032. [Google Scholar] [CrossRef] [PubMed]
  24. Zhang, S.; Nguyen, L.H.; Zhou, K.; Tu, H.-C.; Sehgal, A.; Nassour, I.; Li, L.; Gopal, P.; Goodman, J.; Singal, A.G. Knockdown of anillin actin binding protein blocks cytokinesis in hepatocytes and reduces liver tumor development in mice without affecting regeneration. Gastroenterology 2018, 154, 1421–1434. [Google Scholar] [CrossRef] [PubMed]
  25. Wang, L.; Zhou, M.; Feng, C.; Gao, P.; Ding, G.; Zhou, Z.; Jiang, H.; Wu, Z.; Ding, Q. Prognostic value of Ki67 and p63 expressions in bladder cancer patients who underwent radical cystectomy. Int. Urol. Nephrol. 2016, 48, 495–501. [Google Scholar] [CrossRef] [PubMed]
  26. Stone, R.; Sabichi, A.L.; Gill, J.; Lee, I.-L.; Adegboyega, P.; Dai, M.S.; Loganantharaj, R.; Trutschl, M.; Cvek, U.; Clifford, J.L. Identification of genes correlated with early-stage bladder cancer progression. Cancer Prev. Res. 2010, 3, 776–786. [Google Scholar] [CrossRef] [PubMed]
  27. Breyer, J.; Wirtz, R.M.; Laible, M.; Schlombs, K.; Erben, P.; Kriegmair, M.C.; Stoehr, R.; Eidt, S.; Denzinger, S.; Burger, M. ESR1, ERBB2, and Ki67 mRNA expression predicts stage and grade of non-muscle-invasive bladder carcinoma (NMIBC). Virchows Arch. 2016, 469, 547–552. [Google Scholar] [CrossRef]
  28. Martini, T.; Heinkele, J.; Mayr, R.; Weis, C.-A.; Wezel, F.; Wahby, S.; Eckstein, M.; Schnöller, T.; Breyer, J.; Wirtz, R. Predictive value of lymphangiogenesis and proliferation markers on mRNA level in urothelial carcinoma of the bladder after radical cystectomy. In Urologic Oncology: Seminars and Original Investigations; Elsevier: Amsterdam, The Netherlands, 2018; pp. e530-19–e530-27. [Google Scholar]
  29. Rinaldetti, S.; Wirtz, R.M.; Worst, T.S.; Eckstein, M.; Weiss, C.A.; Breyer, J.; Otto, W.; Bolenz, C.; Hartmann, A.; Erben, P. FOXM1 predicts overall and disease specific survival in muscle-invasive urothelial carcinoma and presents a differential expression between bladder cancer subtypes. Oncotarget 2017, 8, 47595–47606. [Google Scholar] [CrossRef]
  30. Pei, Z.; Du, X.; Song, Y.; Fan, L.; Li, F.; Gao, Y.; Wu, R.; Chen, Y.; Li, W.; Zhou, H. Down-regulation of lncRNA CASC2 promotes cell proliferation and metastasis of bladder cancer by activation of the Wnt/β-catenin signaling pathway. Oncotarget 2017, 8, 18145–18153. [Google Scholar] [CrossRef]
  31. Du, H.-F.; Ou, L.-P.; Lv, C.-K.; Yang, X.; Song, X.-D.; Fan, Y.-R.; Wu, X.-H.; Luo, C.-L. Expression of hepaCAM inhibits bladder cancer cell proliferation via a Wnt/β-catenin-dependent pathway in vitro and in vivo. Cancer Biol. Ther. 2015, 16, 1502–1513. [Google Scholar] [CrossRef]
  32. Chen, Z.; Zhou, L.; Wang, L.; Kazobinka, G.; Zhang, X.; Han, X.; Li, B.; Hou, T. HBO1 promotes cell proliferation in bladder cancer via activation of Wnt/β-catenin signaling. Mol. Carcinog. 2018, 57, 12–21. [Google Scholar] [CrossRef] [PubMed]
  33. Kurnit, K.C.; Kim, G.N.; Fellman, B.M.; Urbauer, D.L.; Mills, G.B.; Zhang, W.; Broaddus, R.R. CTNNB1 (beta-catenin) mutation identifies low grade, early stage endometrial cancer patients at increased risk of recurrence. Mod. Pathol. 2017, 30, 1032–1041. [Google Scholar] [CrossRef] [PubMed] [Green Version]
  34. Crippa, S.; Ancey, P.B.; Vazquez, J.; Angelino, P.; Rougemont, A.L.; Guettier, C.; Zoete, V.; Delorenzi, M.; Michielin, O.; Meylan, E. Mutant CTNNB1 and histological heterogeneity define metabolic subtypes of hepatoblastoma. EMBO Mol. Med. 2017, 9, 1589–1604. [Google Scholar] [CrossRef] [PubMed] [Green Version]
  35. Ahadova, A.; von Knebel Doeberitz, M.; Bläker, H.; Kloor, M. CTNNB1-mutant colorectal carcinomas with immediate invasive growth: A model of interval cancers in Lynch syndrome. Fam. Cancer 2016, 15, 579–586. [Google Scholar] [CrossRef] [PubMed]
  36. Ai, R.; Sun, Y.; Guo, Z.; Wei, W.; Zhou, L.; Liu, F.; Hendricks, D.T.; Xu, Y.; Zhao, X. NDRG1 overexpression promotes the progression of esophageal squamous cell carcinoma through modulating Wnt signaling pathway. Cancer Biol. Ther. 2016, 17, 943–954. [Google Scholar] [CrossRef] [Green Version]
  37. Hambly, N.; Shimbori, C.; Kolb, M. Molecular classification of idiopathic pulmonary fibrosis: Personalized medicine, genetics and biomarkers. Respirology 2015, 20, 1010–1022. [Google Scholar] [CrossRef] [Green Version]
  38. Pietzak, E.J.; Bagrodia, A.; Cha, E.K.; Drill, E.N.; Iyer, G.; Isharwal, S.; Ostrovnaya, I.; Baez, P.; Li, Q.; Berger, M.F. Next-generation sequencing of nonmuscle invasive bladder cancer reveals potential biomarkers and rational therapeutic targets. Eur. Urol. 2017, 72, 952–959. [Google Scholar] [CrossRef]
  39. Hedegaard, J.; Lamy, P.; Nordentoft, I.; Algaba, F.; Høyer, S.; Ulhøi, B.P.; Vang, S.; Reinert, T.; Hermann, G.G.; Mogensen, K. Comprehensive transcriptional analysis of early-stage urothelial carcinoma. Cancer Cell 2016, 30, 27–42. [Google Scholar] [CrossRef]
  40. Damrauer, J.S.; Hoadley, K.A.; Chism, D.D.; Fan, C.; Tiganelli, C.J.; Wobker, S.E.; Yeh, J.J.; Milowsky, M.I.; Iyer, G.; Parker, J.S. Intrinsic subtypes of high-grade bladder cancer reflect the hallmarks of breast cancer biology. Proc. Natl. Acad. Sci. USA. 2014, 111, 3110–3115. [Google Scholar] [CrossRef] [Green Version]
  41. Fedele, M.; Cerchia, L.; Chiappetta, G. The Epithelial-to-Mesenchymal Transition in Breast Cancer: Focus on Basal-Like Carcinomas. Cancers 2017, 9. [Google Scholar] [CrossRef]
  42. Li, Y.; Yang, K.; Li, K.; Liu, H.; Zhao, S.; Jiao, M.; Fu, X. Clinical and molecular characteristics of bladder urothelial carcinoma subtypes. J. Cell. Biochem. 2019, 120, 9956–9963. [Google Scholar] [CrossRef] [PubMed]
  43. Eckstein, M.; Wirtz, R.M.; Gross-Weege, M.; Breyer, J.; Otto, W.; Stoehr, R.; Sikic, D.; Keck, B.; Eidt, S.; Burger, M.; et al. mRNA-Expression of KRT5 and KRT20 Defines Distinct Prognostic Subgroups of Muscle-Invasive Urothelial Bladder Cancer Correlating with Histological Variants. Int. J. Mol. Sci. 2018, 19. [Google Scholar] [CrossRef] [PubMed] [Green Version]
  44. Moon, Y.W.; Hajjar, J.; Hwu, P.; Naing, A. Targeting the indoleamine 2,3-dioxygenase pathway in cancer. J. Immunother. Cancer 2015, 3, 51. [Google Scholar] [CrossRef] [PubMed] [Green Version]
  45. Tumeh, P.C.; Harview, C.L.; Yearley, J.H.; Shintaku, I.P.; Taylor, E.J.; Robert, L.; Chmielowski, B.; Spasic, M.; Henry, G.; Ciobanu, V. PD-1 blockade induces responses by inhibiting adaptive immune resistance. Nature 2014, 515, 568–571. [Google Scholar] [CrossRef]
  46. Aggen, D.H.; Drake, C.G. Biomarkers for immunotherapy in bladder cancer: A moving target. J. Immunother. Cancer 2017, 5, 94. [Google Scholar] [CrossRef]
  47. Paner, G.P.; Stadler, W.M.; Hansel, D.E.; Montironi, R.; Lin, D.W.; Amin, M.B. Updates in the Eighth Edition of the Tumor-Node-Metastasis Staging Classification for Urologic Cancers. Eur. Urol. 2018, 73, 560–569. [Google Scholar] [CrossRef]
  48. Woldu, S.L.; Bagrodia, A.; Lotan, Y. Guideline of guidelines: Non-muscle-invasive bladder cancer. BJU Int. 2017, 119, 371–380. [Google Scholar] [CrossRef] [Green Version]
  49. Tang, Z.; Li, C.; Kang, B.; Gao, G.; Li, C.; Zhang, Z. GEPIA: A web server for cancer and normal gene expression profiling and interactive analyses. Nucleic Acids Res. 2017, 45, W98–W102. [Google Scholar] [CrossRef] [Green Version]
  50. Kuleshov, M.V.; Jones, M.R.; Rouillard, A.D.; Fernandez, N.F.; Duan, Q.; Wang, Z.; Koplev, S.; Jenkins, S.L.; Jagodnik, K.M.; Lachmann, A. Enrichr: A comprehensive gene set enrichment analysis web server 2016 update. Nucleic Acids Res. 2016, 44, W90–W97. [Google Scholar] [CrossRef] [Green Version]
  51. Tramm, T.; Sørensen, B.S.; Overgaard, J.; Alsner, J. Optimal reference genes for normalization of qRT-PCR data from archival formalin-fixed, paraffin-embedded breast tumors controlling for tumor cell content and decay of mRNA. Diagn. Mol. Pathol. 2013, 22, 181–187. [Google Scholar] [CrossRef]
  52. Breyer, J.; Wirtz, R.M.; Otto, W.; Erben, P.; Kriegmair, M.C.; Stoehr, R.; Eckstein, M.; Eidt, S.; Denzinger, S.; Burger, M. In stage pT1 non-muscle-invasive bladder cancer (NMIBC), high KRT20 and low KRT5 mRNA expression identify the luminal subtype and predict recurrence and survival. Virchows Arch. 2017, 470, 267–274. [Google Scholar] [CrossRef] [PubMed]
  53. Livak, K.J.; Schmittgen, T.D. Analysis of relative gene expression data using real-time quantitative PCR and the 2−ΔΔCT method. Methods 2001, 25, 402–408. [Google Scholar] [CrossRef] [PubMed]
  54. Zanetti, M.R.D.; Petricelli, C.D.; Alexandre, S.M.; Paschoal, A.; Araujo Júnior, E.; Nakamura, M.U. Determination of a cutoff value for pelvic floor distensibility using the Epi-no balloon to predict perineal integrity in vaginal delivery: ROC curve analysis. Prospective observational single cohort study. Sao Paulo Med. J. 2016, 134, 97–102. [Google Scholar] [CrossRef] [PubMed] [Green Version]
Figure 1. Kaplan–Meier plots of overall- (OS) and disease-specific (DSS) survival associated with anilin actin binding protein (ANLN) and transducing-like enhancer protein 2 (TLE2) risk stratification in the Mannheim cohort. The group with high ANLN expression showed worse OS (a) and DSS (b) than the group with low expression. The group with high TLE2 expression displayed more favorable OS (c) and DSS (d) than the group with low expression.
Cancers 11 01840 g001
Figure 2. Kaplan–Meier plots of OS and disease-free survival (DFS) associated with ANLN and TLE2 risk stratification in The Cancer Genome Atlas (TCGA) cohort. Higher ANLN expression showed worse OS (a) and DFS (b). Higher TLE2 expression showed more favorable OS (c) and DFS (d). In the T2 subgroup, low ANLN (e) and TLE2 (f) expression showed good and poor prognosis of OS, respectively. Higher ANLN expression showed worse OS in basal subtype (g) and higher TLE2 showed better OS in luminal subtype (h).
Cancers 11 01840 g002
Figure 3. ANLN and TLE2 expression in association with copy-number alterations. ANLN showed 6.14% of shallow/deep deletion, 51.35% of diploid, and 42.51% of gain/amplification (a). TLE2 showed 35.14% of shallow/deep deletion, 51.60% of diploid and 13.27% of gain/amplification (b). Significant higher expression of ANLN was observed in the subgroup with gain than diploid (median expression 10.54 vs. 9.88, and p < 0.0001) and deletion (median expression 10.54 vs. 9.45, and p < 0.0001) (c). No significant differences of TLE2 expression were found in the subgroups with deletion against diploid (median expression 9.63 vs. 9.98, and p = 0.1458) or gain (median expression 9.63 vs. 9.73, and p = 0.9190) (d). The gene expression levels of ANLN and TLE2 were grouped into high and low expression. In the subgroup with lower ANLN expression, diploid (n = 143, 59.34%) was more frequently observed than gain (n = 77, 31.95%) and deletion (n = 21, 8.71%). The subgroup with higher ANLN expression is associated with a higher percentage of gain (n = 86, 56.90%) than diploid (n = 62, 41.10%) and deletion (n = 3, 2.00%) (e). TLE2 was mainly expressed in the subgroup with deletion and diploid in TLE2 low expression (n = 102, 41.46% in deletion; n = 114, 46.34% in diploid) and TLE2 high expression (n = 40, 25.97% in deletion; n = 92, 59.74% in diploid). Gain was observed in only 12.2% (n = 30) in TLE2 low expression group and in 14.29% (n = 22) in the TLE2 high expression group (f).
Cancers 11 01840 g003
Table 1. Clinicopathological characteristics of patients and specimens of the Mannheim cohort.
Clinicopathological Featuresn
Age<7023
≥7037
GenderMale47
Female13
GradeLow5
High55
StageT16
T211
T328
T415
Lymph node metastasisNegative37
Positive15
Table 2. Univariate and multivariate Cox regression analysis of ANLN and TLE2 with clinicopathological features in the Mannheim cohort (HR = hazard ratio, CI = confidence interval, LVI = lymphovascular invasion, significant p Values are bold).
FactorUnivariate Multivariate
HR (95% CI)p ValueHR (95% CI)p Value
Diagnosis Age
<70 vs. ≥700.584 (0.269–1.269)0.174
Gender
Male vs. Female1.128 (0.405–3.140)0.957
Stage
T1/T2 vs. T3/40.168 (0.015–1.832)0.128
LVI
Negative vs. Positive0.542 (0.359–0.819)0.004
Lymph node Statues
Negative vs. Positive0.549 (0.371–0.813)0.0030.612 (0.399–0.938)0.024
ANLN
Low vs. High0.220 (0.084–0.575)0.0020.328 (0.114–0.945)0.039
TLE2
Low vs. High0.305 (0.121–0.769)0.0120.172 (0.057–0.519)0.002
Table 3. Univariate and multivariate Cox regression analysis of ANLN and TLE2 with clinicopathological features in the TCGA cohort (HR = hazard ratio, CI = confidence interval, significant p Values are bold).
FactorUnivariate Multivariate
HR (95% CI)p ValueHR (95% CI)p Value
Diagnosis Age
<70 vs. ≥701.260 (0.931–1.705)0.134
Gender
Male vs. Female1.257 (0.902–1.751)0.177
Smoking Status
No vs. Yes1.335 (0.940–1.897)0.106
Stage
T2 vs. T3/41.950 (1.393–2.731)<0.0011.646 (1.156–2.342)0.006
Lymph node Statues
Negative vs. Positive2.145 (1.596–2.883)<0.0011.989 (1.461–2.707)<0.001
ANLN
Low vs. High1.439 (1.070–1.934)0.0161.438 (1.064–1.943)0.018
TLE2
Low vs. High0.636 (0.460–0.880)0.0061.415 (1.015–1.973)0.040
Table 4. Correlation of ANLN and TLE2 with key molecules in signaling pathways and therapeutic targets (correlation coefficient values above 0.4 and below −0.4 are bold).
Correlated GeneANLNTLE2
Correlation Coefficientp ValueCorrelation Coefficientp Value
Cell proliferationCDK10.5943.98 × 10−40−0.3382.63 × 10−12
RACGAP10.7251.41 × 10−67−0.4519.46 × 10−22
MKI670.7117.56 × 10−64−0.3961.07 × 10−16
FOXM10.6882.98 × 10−58−0.44.46 × 10−17
Notch signalingNOTCH10.1090.027294−0.190.000115
RBPJ−0.1966.6 × 10−50.050.311468
Wnt signalingTCF70.0670.1750970.0060.89689
TCF7L10.1620.001066−0.2674.75 × 10−8
TCF7L2−0.1860.0001640.232.84 × 10−6
LEF1−0.1010.041347−0.0260.596286
CTNNB10.2371.29 × 10−6−0.2761.6 × 10−8
Hormone receptor signalingAR−0.1850.0001710.3884.9 × 10−16
ESR1−0.0030.944815−0.0480.332592
ESR2−0.1910.000110.3344.33 × 10−12
FOXA1−0.381.89 × 10−150.5059.11 × 10−28
GATA3−0.4032.33 × 10−170.652.80 × 10−50
Therapeutic targetsEGFR0.537.73 × 10−31−0.3681.78 × 10−14
ERBB2−0.353.44 × 10−130.6131.96 × 10−43
FGFR3−0.2836.52 × 10−90.1560.001575
PIK3CA0.4262.19 × 10−19−0.2646.34 × 10−8
CDK40.2072.68 × 10−5−0.2674.69 × 10−8
HRAS−0.0230.648147−0.1830.000202
PDCD10.08810.0754−0.3131.07 × 10−10
PD-L10.4142.89 × 10−18−0.4191.07 × 10−18
CTLA40.09630.052−0.3633.71 × 10−14
EZH20.4462.51 × 10−21−0.1620.001009

