

Abstract
Peatlands cover only about 3% the global land area, but store about twice as much carbon as global forest biomass. If intact peatlands are drained for agriculture or other human uses, peat oxidation can result in considerable CO2 emissions and other greenhouse gases (GHG) for decades or even centuries. Despite their importance, emissions from degraded peatlands have so far not been included explicitly in mitigation pathways compatible with the Paris Agreement. Such pathways include land-demanding mitigation options like bioenergy or afforestation with substantial consequences for the land system. Therefore, besides GHG emissions owing to the historic conversion of intact peatlands, the increased demand for land in current mitigation pathways could result in drainage of presently intact peatlands, e.g. for bioenergy production. Here, we present the first quantitative model-based projections of future peatland dynamics and associated GHG emissions in the context of a 2 °C mitigation pathway. Our spatially explicit land-use modelling approach with global coverage simultaneously accounts for future food demand, based on population and income projections, and land-based mitigation measures. Without dedicated peatland policy and even in the case of peatland protection, our results indicate that the land system would remain a net source of CO2 throughout the 21st century. This result is in contrast to the outcome of current mitigation pathways, in which the land system turns into a net carbon sink by 2100. However, our results indicate that it is possible to reconcile land use and GHG emissions in mitigation pathways through a peatland protection and restoration policy. According to our results, the land system would turn into a global net carbon sink by 2100, as projected by current mitigation pathways, if about 60% of present-day degraded peatlands would be rewetted in the coming decades, next to the protection of intact peatlands.
Export citation and abstract BibTeX RIS

Original content from this work may be used under the terms of the Creative Commons Attribution 4.0 license. Any further distribution of this work must maintain attribution to the author(s) and the title of the work, journal citation and DOI.
1. Introduction
Peatlands cover only about 3% the global land area (381–463 Mha) but store about twice as much carbon as global forest biomass (Yu et al 2010, Joosten 2010, Joosten et al 2016, Leifeld and Menichetti 2018, Leifeld et al 2019). About 43–51 Mha of the global peatland area is degraded (Joosten 2010, Leifeld and Menichetti 2018, Leifeld et al 2019), i.e. those peatlands have been drained for agriculture, forestry or peat extraction. Degraded peatlands emit carbon dioxide (CO2) from peat oxidation and other greenhouse gases (GHG) for centuries if not rewetted (Wilson et al 2016, Leifeld and Menichetti 2018). Estimates of present-day global GHG emissions from degraded peatlands range between 1.30 and 1.91 Gt CO2eq yr−1 (Joosten 2010, Leifeld and Menichetti 2018, Leifeld et al 2019), which corresponds to 2.6%–3.8% of total global anthropogenic GHG emissions (49 Gt CO2eq yr−1 in 2010) (Edenhofer et al 2014).
Natural peatlands accumulate peat from dead plant material, thereby removing CO2 from the atmosphere (Hooijer et al 2010). At the same time, the decomposition of dead plant material under anaerobic conditions causes methane (CH4) emissions with a GHG effect roughly 30 times that of CO2 (Jauhiainen et al 2016). Over a 100-year timescale these counteracting effects can even cancel out each other (Barthelmes et al 2015). Therefore, natural peatlands can be considered from a moderate net GHG sink (Levy and Gray 2015) to climate neutral (Barthelmes et al 2015). When peatlands are drained the peat starts to decompose aerobically and therefore at a much higher rate compared to the anaerobic accumulation, which results in considerable CO2 emissions. In addition, peat oxidation causes smaller amounts of nitrous oxide (N2O) and CH4 emissions (Hiraishi et al 2014, Wilson et al 2016). On top of that, ditches in drained peatlands carry larger amounts of dissolved organic carbon (DOC) out of the peatland than in their natural state, and most of the DOC is oxidized and released as CO2 (Hiraishi et al 2014). In terms of global warming potential (GWP) CO2 is by far the most important GHG from degraded peatlands (Hiraishi et al 2014, Barthelmes et al 2015). The process of complete peat oxidation may take centuries for deep peat deposits (Leifeld and Menichetti 2018). Therefore, each unit of drained peatland is a contributor to global warming until all the peat is eventually decomposed. Besides the protection of intact peatlands, an option to reverse this trend is the restoration of drained peatlands through rewetting (Jaenicke et al 2010, Wilson et al 2013, Barthelmes et al 2015). Similar to intact peatlands, rewetted peatlands absorb CO2 from the atmosphere but emit on average 46% more methane (Abdalla et al 2016). Net GHG emissions from rewetted peatlands are in many cases much lower compared to drained peatlands, but the emission reductions are variable over time and in different climatic regions, and therefore not easily generalizable (Barthelmes et al 2015, Wilson et al 2016). According to the most up-to-date emission factors, rewetted peatlands over mid-term have higher GHG emissions than intact peatlands (Hiraishi et al 2014, Barthelmes et al 2015, Wilson et al 2016). But despite rewetted peatlands may remain 'negative' for the climate in an absolute sense, the GHG mitigation compared to the previous drained status remains considerable.
For climate policy-making in line with the Paris Agreement it is therefore crucial that emissions from degraded peatlands, which can be estimated with the help of IPCC Guidelines (Hiraishi et al 2014), are accounted for in mitigation pathways towards 1.5 °C or 2 °C in 2100. To our knowledge, which is based on the IPCC special report on 1.5° (Rogelj et al 2018), the IPCC special report on climate change and land (Smith et al 2019, table 6.76), and the IAMC 1.5 °C scenario explorer (Huppmann et al 2018), there is currently no single integrated assessment modelling (IAM) study, which specifically accounts for the challenges of peatland protection and restoration related to mitigation and food security. Considering emissions from degraded peatlands in mitigation pathways is first of all crucial due to the legacy of historic peatland conversion. On top of that, most pathways consistent with 1.5 °C or 2 °C include land-demanding mitigation options, such as bioenergy and afforestation, with substantial consequences for the land system (Clarke et al 2014, Rogelj et al 2018). However, it remains unclear so far if and to what extent land-demanding mitigation options could negatively affect intact peatlands by clearance and drainage for energy crops in the future. In this study, we estimate for the first time the potential GHG consequences of peatland degradation in a likely 2 °C mitigation pathway, along with increasing demand for food and feed for a growing population. Moreover, we explore, also for the first time, the potential of peatland protection and restoration policies for lowering GHG emissions from degraded peatlands, including effects on food security, in a likely 2 °C mitigation pathway.
2. Methods
For this study, we developed a peatland module for the MAgPIE 4 open-source framework for modeling global land systems (Dietrich et al 2019). The model version including the peatland module we use here is MAgPIE 4.2.1 (Dietrich et al 2020). MAgPIE combines economic and biophysical approaches to simulate spatially explicit global scenarios of land use within the 21st century and the respective interactions with the environment (figure S2-S3 (https://stacks.iop.org/ERL/15/104093/mmedia)). The MAgPIE framework has been used to simulate mitigation pathways for different shared socioeconomic pathways (SSPs) (Popp et al 2017) and contributed to several IPCC reports (Rogelj et al 2018, Smith et al 2019). In particular, the MAgPIE framework has been used for several studies on the environmental effects of terrestrial climate change mitigation measures, including large-scale bioenergy production and afforestation (Popp et al 2011, Popp et al 2014, 2014, Humpenöder et al 2018, Bonsch et al 2016, Kreidenweis et al 2016). In line with these earlier studies, we do not account for impacts of climate change on crop yields and vegetation carbon stocks in this study. In the following we describe how we initialize the peatland module, how we model future peatland dynamics and associated GHG emissions, and how we implemented the peatland protection and restoration scenarios. The SI provides a schematic overview of the study setup (figure S1) and a description of the main characteristic of the MAgPIE 4 modelling framework.
2.1. Initial peatland map
The peatland module is initialized with a map of present-day degraded and intact peatlands (figure S4), which we generated by combining a map of potential peatland area, provided by the authors of Leifeld and Menichetti (2018) and Yu et al (2010), with country level data on the status and extent of peatlands (intact and degraded) for the year 2015 from the Global Peatland Database (GPD) (Greifswald Mire Centre 2015). The map of potential peatland distribution is mainly based on geomorphology and hydrology. On the global level the area of the potential peatland map is about twice as large (∼997 Mha) compared to the country level peatland area data (∼497 Mha). We downscaled the country level peatland area (intact and degraded) to 0.5-degree resolution grid cell level by using the potential peatland map as weight and upper limit. In a first step, the degraded and intact peatland area of each country from GPD is distributed to the corresponding grid cells weighted by the potential peatland map. In a second step, we limit the peatland area in each grid cell to the area of the potential peatland map (for more details see source code in supplementary data). Since there is some mismatch between GPD and the potential peatland map, the area of the resulting map is slightly smaller than the area of GPD (∼421 Mha vs. ∼497 Mha globally). On the global level, degraded peatland in our map is about 5 Mha smaller compared to GPD, while intact peatland is about 71 Mha smaller.
Our spatially explicit map for the year 2015 provides for each grid cell the extent of intact and degraded peatlands, but does not provide information on how degraded peatland is used (for instance as cropland). The IPCC wetland GHG emission factors, however, are differentiated into the land-use categories cropland, pasture and forestry (see table S1). Since MAgPIE has detailed land use information for each cell, we allocate degraded peatland area in consecutive order to the land-use categories cropland, pasture and forestry, which is comparable to the allocation rules used in Leifeld and Menichetti (2018). To make sure that the initial distribution of degraded peatland to cropland, pasture and forestry is consistent with our approach for modelling future peatland dynamics (see next subsection), we account for the ratio of total peatland area to total land area in each cell (hereafter referred to as scaling factor) in the initial distribution. In each of the three steps (cropland, pasture, forestry), the allocation of degraded peatland to managed land is constrained by the respective level of land use in MAgPIE in 2015 multiplied with the scaling factor (see model code for details). Any unallocated degraded peatland area after these three steps is assigned to an unused peatland category with area-weighted distribution among cropland, pasture and forestry.
2.2. Modelling future peatland dynamics
Starting from this initial peatland map for the year 2015, we estimate future peatland dynamics based on projections of changes in cropland, pasture and forestry from MAgPIE. We assume that changes of cropland, pasture and forestry translate into changes of degraded peatland proportional to the ratio of total peatland area to total land area in each cell (scaling factor between 0 and 1). Furthermore, we assume that the sum of the peatland categories intact, degraded, unused and rewetted remains constant over time in each cell, which also implies that the scaling factor is constant over time. The following example illustrates the mechanism used for projecting peatland dynamics (see equations in model code for details): In a given cell, the total land area is 50 Mha and the total peatland area is 10 Mha. Therefore, the scaling factor is 0.2 (10 Mha divided by 50 Mha). If cropland expands by 5 Mha, 1 Mha of intact peatland is converted to degraded peatland (5 Mha*0.2). By multiplying changes in managed land with the scaling factor we implicitly assume that intact peatlands are distributed equally within a cell. If the totality of the cell would become cropland, degraded peatland would equal to the total peatland area (50 Mha * 0.2 = 10 Mha). Expansion of cropland, pasture or forestry in cells with peatland does not necessarily result in degradation of intact peatlands. If degraded peatland in the unused category exists, the model will use this land first before converting intact peatland. To avoid double accounting of costs, we do not assume specific costs for the drainage of intact peatlands because MAgPIE already accounts for one-time costs of 8000 USD ha−1 (2005 market exchange rate; MER) for the conversion of unmanaged to managed land.
If cropland, pasture or forestry decline, the process just works the other way around, i.e. degraded peatland is reduced proportional based on the scaling factor, with the difference that the reduction of degraded peatland results in an increase of the peatland categories unused or rewetted, depending on the pricing of GHG emissions from peatlands (see next sub-sections). The initial distribution of degraded peatland to cropland, pasture and forestry makes sure that in case all managed land in a cell is abandoned for peatland restoration, all degraded peatland will be rewetted.
2.3. GHG emission factors for degraded and rewetted peatlands
We use of the most up-to-date wetland GHG emission factors for drained and rewetted peatlands (table S1). The emission factors differ by emission type (CO2, CH4, N2O, CO2-DOC), land type (cropland, pasture, forestry) and climate zone (tropical, temperate, boreal). The GHG emission factors in table S1 are taken from table 5 in Wilson et al (2016), which is based on the 2013 Wetland Supplement to the 2006 IPCC Guidelines for National Greenhouse Gas Inventories (Hiraishi et al 2014). In line with the IPCC Tier 1 approach we use nutrient poor emission factors for boreal and nutrient rich emission factors for temperate regions. Emission factors for tropical grassland have been added based on IPCC (Hiraishi et al 2014). For the mapping of climate regions and cells we use the Koeppen–Geiger climate classification (table S2). GHG emissions from degraded peatlands are obtained by multiplication of GHG emission factors for drained peatlands (t CO2eq ha−1 yr−1) with the respective area of degraded peatland (categories degraded and unused) in MAgPIE. In line with IPCC guidelines, we assume the same GHG emission factors for all degraded peatlands, irrespective of the point in time when the peat oxidation started. GHG emission savings due to peatland restoration are obtained by multiplication of GHG emission reduction factors for rewetted peatlands (difference between drained and rewetted emission factors) with the respective area of rewetted peatland in MAgPIE. Impacts of future climate change on emissions from peatlands are not accounted for in this study.
2.4. Peatland protection and restoration
Peatland protection and restoration policies are implemented as economic process in the model by pricing GHG emissions from degraded and rewetted peatlands (see section below on scenario setup for details on the used CO2 price path). Since the goal function of MAgPIE is cost minimization, pricing GHG emissions from degraded peatlands creates an incentive to minimize future peatland degradation, and hence managed land expansion in cells with peatland. Rewetted peatlands have lower net GHG emissions (CO2eq) compared to degraded peatlands according to the GHG emission factors in table S1. Therefore, pricing GHG emissions from degraded peatlands in combination with the option for rewetting creates an economic incentive to retire managed land in cells with degraded peatland. For tracking rewetted peatlands and for calculating GHG emission savings, rewetted peatlands are added in a separate category, besides degraded, unused, and intact peatland. We use a transition matrix that accounts for these four categories to make sure that the total peatland area remains constant over time. For peatland restoration, we assume one-time costs of 7000 USD ha−1 (2005 MER) for the initial rewetting and recurring costs of 200 USD ha−1 yr−1 for maintenance, based on an indicative cost estimate of 200–10.000 £ ha−1 for rewetting, and 25–400 £ ha−1 yr−1 for maintenance (Moxey and Moran 2014, Glenk and Martin-Ortega 2018). For a sensitivity analysis we use the following sets of one-time (USD ha−1) and recurring costs (USD ha−1 yr−1) for restoration, which cover the broad range from the literature: low = 875/25, medium = 7000/200, high = 14 000/400. For the decision-making, the one-time restoration costs are converted into an average annual value by applying an annuity factor which depends on the regional interest rate. Hence, at the point of decision-making the model compares the benefit of peatland rewetting (i.e. lower cost for GHG emissions) with the costs for implementation, which consist of agricultural production costs (labour, capital, fertilizer, technological change, intraregional transport, land conversion and GHG emissions; figure S2) besides the direct costs for peatland restoration.
2.5. Scenario setup
We explore three main scenarios: RCP2.6 (no peatland policy), RCP2.6 + PeatProt (peatland protection policy) and RCP2.6 + PeatRestor (peatland protection and restoration policy). These main scenarios are based on the shared socio-economic pathway 2 (SSP2) (Popp et al 2017), which is a middle of the road scenario for future socio-economic developments, i.e. the main scenarios have the same assumptions for key parameters like future population, income, food demand, environmental protection and trade. However, how such key parameters develop in the future is uncertain—with potential impacts on peatland degradation or restoration. To assess this uncertainty, we run our main scenarios with alternative socio-economic assumptions (SSP1-5) (figures S5-S6). Also, all scenarios share the same assumptions for land-based mitigation including large-scale production of 2nd generation bioenergy and CO2 price path (figures S7-S8), which are both taken from an existing RCP2.6 (likely 2 °C in 2100) mitigation pathway available in the SSP database (IIASA 2018). We here use data from the 'REMIND-MAgPIE—SSP2-26' pathway, which is not the so-called marker representation of SSP2-26. However, alternative representations of SSP2-26 are equally valuable and using the REMIND-MAgPIE (MAgPIE version 3) representation of SSP2-26 is the most consistent setup for this study since we here use a follow-up version of MAgPIE (version 4.2.1). In this study, bioenergy demand is an exogenous input to the model. Hence, the model accounts for emissions from land-use change (e.g. from deforestation) but does not account for CO2 benefits resulting from the use of bioenergy. In all scenarios, the GHG price is applied on CO2 emissions from the conversion of unmanaged land (forest and non-forest natural vegetation), as well as on CH4 and N2O emission from agricultural production (converted using GWP factors of 28 for CH4 and 265 for N2O). The pricing of land-related GHG emissions creates an economic incentive in the model to reduce these emissions, e.g. by less conversion of unmanaged to managed land or by investments in emission-friendly technologies (implemented via marginal abatement cost curves) (Popp et al 2010). In the RCP2.6 scenario, GHG emissions from the conversion of intact peatlands and historically degraded peatlands are not priced, i.e. these emissions are not considered in the decision-making process. However, GHG emissions from degraded peatlands are tracked by the model. In the RCP2.6 + PeatProt scenario, the GHG price is applied on GHG emissions from degraded peatlands, which provides an incentive to stop further degradation of intact peatlands. In the RCP2.6 + PeatRestor scenario, GHG emission from degraded peatlands are priced as in RCP2.6 + PeatProt, and in addition the rewetting of degraded peatlands, which reduces GHG emissions compared to the drained state (table S1), is rewarded based on the GHG price.
3. Results
3.1. General land dynamics
The results for our three main scenarios are similar in terms of global dynamics for cropland, pasture and forest throughout the 21st century (figure 1). All scenarios show a strong increase of cropland for bioenergy production (412–447 Mha globally until 2100), and a smaller increase of forest area due to afforestation (134–149 Mha globally until 2100). These land expansions mainly come at the cost of other natural land and cropland for food production. Since demand for food, due to growing population and income, as well as demand for bioenergy, due to climate policy, are increasing throughout the 21st century (figures S5-S7), reduction of cropland for food production is only possible under continued yield increases (figure S12). Also, the results in terms of CO2 emissions from changes in vegetation (e.g. from loss of natural land and afforestation) are similar for all scenarios (figure 3). CO2 emissions from changes in vegetation are positive until around 2030 due to land conversion. After 2030, the CO2 price applied on these emissions starts to increase rapidly (figure S8), which alters land conversion patterns such that associated CO2 emissions are strongly reduced. Moreover, global CO2 emissions from changes in vegetation turn net-negative after 2030 due to afforestation based on existing national policies. In the RCP2.6 + PeatRestor scenario, reduced conversion of other natural land results in more negative CO2 emissions due to ongoing regrowth of vegetation (figures 1 and 3).
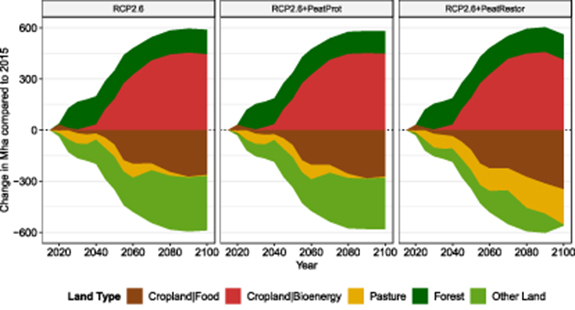
Figure 1. Global change of major land use types (indicated by colour) over time until 2100 compared to 2015 for three scenarios (left, middle, right). Global land cover in 2015 amounts to 1511 Mha for cropland (food and bioenergy), 3260 Mha for pasture, 3989 Mha for forest and 4039 Mha for other land including urban areas (12 805 Mha in total).
Download figure:
Standard image High-resolution image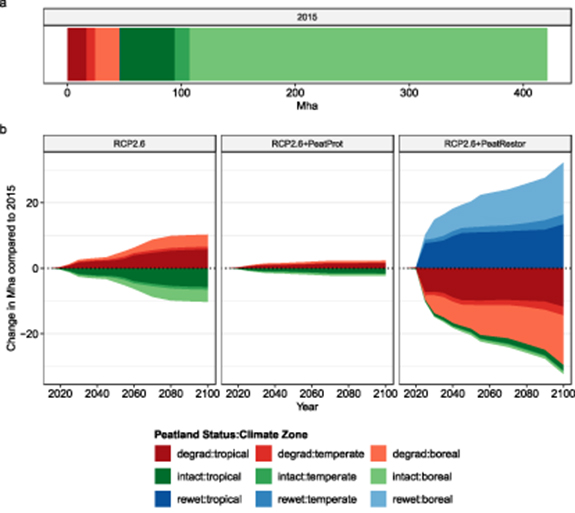
Figure 2. Peatland area in tropical, temperate and boreal climate zones. Panel a shows the status of degraded and intact peatlands in 2015. Panel b shows changes of peatland area over time until 2100 compared to 2015 for three scenarios (left, middle, right). The status of peatlands is indicated by colour, climate zones are indicated by corresponding colour gradients.
Download figure:
Standard image High-resolution image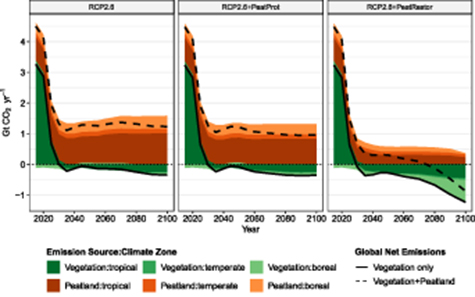
Figure 3. Land-related CO2 emissions between 2015 and 2100 for three scenarios (left, middle, right) in tropical, temperate and boreal climate zones from two sources: change of vegetation carbon stocks (e.g. due to deforestation or afforestation) and peatland-related emissions (decomposition of peat in degraded/drained peatlands, accumulation of peat in rewetted peatlands). Please note that the CO2 emissions shown here include only direct human effects. Indirect effects (e.g. due to climate change) are not accounted for. Emission sources are indicated by colour, climate zones are indicated by corresponding colour gradients.
Download figure:
Standard image High-resolution image3.2. No peatland policy
With respect to peatland area, all scenarios start in 2015 with degraded peatland area of 45.8 Mha and intact peatland area of 375.2 Mha globally (table 1(a), figure 2). 36% of all degraded peatlands are located in the tropics (mainly Southeast Asia) and 47% are located in the boreal climate zone (mainly Europe and Russia) (figures S4 and S14). In 2015, annual GHG emissions from degraded peatlands (CO2, CH4 and N2O) including off-site CO2 emissions from DOC amount to 1.50 Gt CO2eq yr−1 of which 82% (1.24 Gt CO2 yr−1) come from peat oxidation (table 1(b), figure 4).
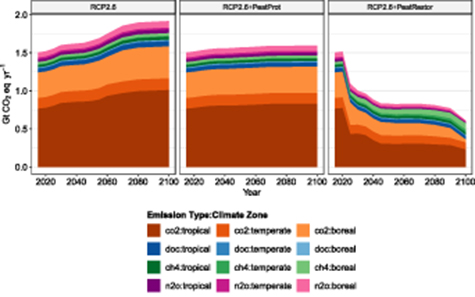
Figure 4. Annual GHG emissions (CO2, CH4 and N2O) and off-site CO2 emissions (DOC) from degraded and rewetted peatlands between 2015 and 2100 for three scenarios (left, middle, right) in tropical, temperate and boreal climate zones. Emission types are indicated by colour, climate zones are indicated by corresponding colour gradients.
Download figure:
Standard image High-resolution imageTable 1. Comparison of degraded peatland area and associated GHG emissions with other studies. For each study, the year for which the data is representative is provided in italic font. a) degraded peatland area in Mha. (b) annual GHG emissions from degraded peatlands in Gt CO2 yr−1 or CO2eq yr−1 (depending on data availability).
| (a) Degraded peatland area (Mha) | ||||||
|---|---|---|---|---|---|---|
| This study | (Leifeld and Menichetti 2018) | (Leifeld et al 2019) | (Joosten 2010) | |||
| 2015 | 2015 | 2015 | 2008 | |||
| tropical | 16.7 | 24.2 | 20.3 | |||
| temperate | 7.6 | 10.6 | 26.7 | |||
| boreal | 21.6 | 16.2 | ||||
| global | 45.8 | 50.9 | 47.0 | 42.6 | ||
| (b) Annual GHG emissions from degraded peatlands (Gt CO2eq yr−1) | ||||||
| CO2 | CO2eq | CO2eq | CO2eq | CO2 | ||
| tropical | 0.76 | 0.88 | 1.48 | 1.26 | ||
| temperate | 0.14 | 0.18 | 0.16 | 0.27 | ||
| boreal | 0.33 | 0.44 | 0.26 | |||
| global | 1.24 | 1.50 | 1.91 | 1.53 | 1.30 | |
In the scenario without peatland policies (RCP2.6), global degraded peatland area increases between 2015 and 2100 by 10.3 Mha at the cost of intact peatlands, which corresponds to a relative increase of 22% compared to 2015 (figure 2(b)). The strongest increase takes place in the tropics (5.7 Mha by 2100). The pace of peatland degradation throughout the 21st century partly coincides with the strong expansion of cropland for bioenergy production from about 2040 onwards (figure 1). In consequence, annual global CO2 emissions from degraded peatlands increase to 1.58 Gt CO2 yr−1 in 2100, which is about 25% higher compared to 1.24 Gt CO2 yr−1 in 2015 (figure 3). In addition, also other emissions from degraded peatlands (DOC, CH4 and N2O) increase by about 25% globally between 2015 and 2100, resulting in total emission from degraded peatlands of 1.92 Gt CO2eq yr−1 in 2100 (figure 4). Due to the CO2 emissions from degraded peatlands, global net CO2 emissions from the land system including a small sink due to afforestation remain net-positive throughout the 21st century (1.23 Gt CO2 yr−1 in 2100) (figure 3).
3.3. Peatland protection policy
The scenario with peatland protection through pricing of GHG emissions from degraded peatlands (RCP2.6 + PeatProt) shows substantially less degradation of intact peatlands throughout the 21st century (figure 2(b)), resulting in lower GHG emission from degraded peatlands (figure 4), despite the same considerable expansion of cropland for bioenergy production (figure 1). By 2100, degraded peatlands increase only by 2.3 Mha globally, compared to 10.3 Mha in the scenario without peatland policy (RCP2.6). About 50% of the degradation happens until 2030, which coincides with the strong rise of the CO2 price from 2030 onwards (figure S8). In our price path, the global CO2 price in 2030 is 39 USD tCO2−1. In consequence, emissions from degraded peatlands increase only slightly until 2030, and remain rather constant later on (1.59 Gt CO2eq yr−1 in 2100, figure 4). Notably, most of the peatland emissions in this scenario originate from historic peatland degradation. The global net CO2 emissions from the land system are 0.96 Gt CO2 yr−1 in 2100 (figure 3), which is lower compared to 1.23 Gt CO2 yr−1 in the scenario without peatland policy. However, even in the case of peatland protection, the land system remains a net source of CO2 throughout the 21st century, owing to the legacy of historic peatland conversion.
3.4. Peatland protection and restoration policy
Finally, the scenario with peatland protection and restoration policies (RCP2.6 + PeatRestor) shows substantial rewetting of historically degraded peatlands next to the protection of intact peatlands in the future (figure 2(b)) despite strong expansion of cropland for bioenergy production (figure 1). Between 2015 and 2100 global degraded peatland area shrinks by 29.4 Mha due to rewetting, which corresponds to a relative reduction of about 60% compared to 2015. Notably, about 50% of the global peatland restoration (rewetting) occurs between 2025 and 2035 (figure 2(b)), which indicates that peatland restoration is a cost-efficient mitigation measure at relatively low CO2 prices (22 USD tCO2−1 in 2025, figure S8). About half of the peatland rewetting takes place in the tropical (Southeast Asia) and the boreal climate zone (Europe and Russia), respectively (figure S14). In consequence, CO2 emissions from degraded peatlands decrease considerably from 2025 onwards to 0.36 Gt CO2 yr−1 in 2100 (figure 4). At the same time, CH4 emissions more than double between 2015 and 2100 due to considerable rewetting of degraded peatlands. However, the net effect is a reduction of emissions from peatlands to 0.61 Gt CO2eq yr−1 in 2100, which is qualitatively in line with Günther et al (2020). Because of the much lower CO2 emissions from peatlands, together with the slightly higher carbon sink due to vegetation regrowth, the land system turns into a global net carbon sink by 2075 in this scenario (figure 3).
3.5. Socio-economic impacts and uncertainty
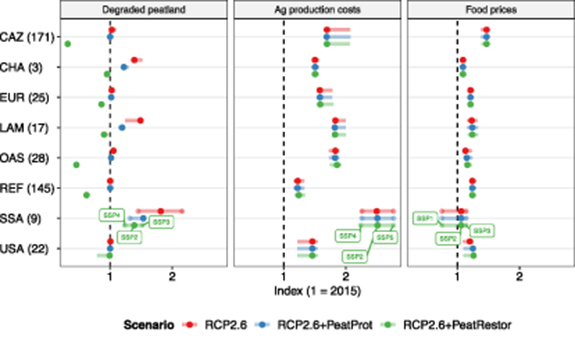
Future peatland degradation and restoration is small in terms of area compared to overall land-use change, in particular compared to land expansion for bioenergy production (e.g. 32 Mha restored peatland vs. > 400 Mha bioenergy area globally in 2100 in RCP2.6 + PeatRestor, figures 1 and 2). However, despite the relatively small area changes, peatland protection and restoration measures could have economic impacts because they imply that expansion of managed land is to some extent constrained, which could increase the overall costs of agricultural production. In our peatland protection and restoration scenario (RCP2.6 + PeatRestor), about 50% of the global peatland restoration happens until 2035 (figure 2(b)). As proxy for the near-term costs of peatland protection and restoration measures, we compare the change of total agricultural production costs by 2035 (index relative to 2015) between our scenarios. Total agricultural production costs include the direct costs for peatland restoration as well as costs for labour, capital, fertilizer, technological change, intraregional transport, land conversion and GHG emissions. Our results show that peatland protection and restoration measures (RCP2.6 + PeatProt, RCP2.6 + PeatRestor) hardly increase the whole system costs on top of costs for agricultural production including climate policy (RCP2.6) at the level of geopolitical world regions (figure 5). As proxy for near-term food security we use a food price index (Paasche price index). The food prices used for calculating the food price index are shadow prices, which reflect the marginal costs of one additional unit of production (Humpenöder et al 2018). Similar to the agricultural production costs, food prices in 2035 show almost no reaction to peatland protection and restoration polices on top of climate policy for all world regions. This result holds true also for the longer-term projection of global food prices until 2100 (figure S10). Moreover, food availability, which is the outcome of a price-elastic food demand response function, is identical across all three scenarios at global level (figure S11). In addition, trade-patterns between the regions are not altered by peatland protection and restoration policies (figure S13).
Figure 5. Comparison of changes in degraded peatland area (left), agricultural production costs (middle) and food prices (right) for 8 geopolitical regions with at least 1 Mha of peatland (total peatland area in brackets; JPN, MEA and IND excluded) across three scenarios (indicted by color) for the year 2035. Changes are shown as index relative to 2015. Full color points indicate the results for the three SSP2-based main scenarios. Colored transparent bars show the corresponding robustness of these results under alternative socio-economic assumptions (SSP 1–5). For Sub-Saharan Africa (SSA) we illustratively label the minimum and maximum values of the uncertainty range. See figure S3 for the definition of regions.
Download figure:
Standard image High-resolution image
In our SSP2-based main scenarios, peatland protection and restoration measures substantially reduce degraded peatland without major increases in production costs and food prices. Qualitatively, this finding is robust under alternative socio-economic assumptions (SSP1-5). Under all SSPs, peatland protection and restoration measures reduce degraded peatland, while agricultural production costs and food prices remain rather unchanged (figure 5). However, there is some uncertainty regarding the level of peatland degradation and associated costs, depending on the underlying socio-economic assumptions (e.g. in Sub-Saharan Africa). For peatland restoration, we additionally tested the robustness of or results against lower and higher restoration costs compared to our default assumptions (see methods). Overall, the sensitivity is small (figure S9). A noticeable difference in restoration area occurs in the boreal climate zone around 2060 (8.2, 10.1 and 12.0 Mha for high, medium and low restoration costs, respectively).
4. Discussion
4.1. Estimates of peatland area and GHG emissions
Our estimate for global present-day degraded peatland area and associated GHG emissions is comparable to other studies (table 1). However, there are differences at the level of climate zones, which are only reported by two of these studies (Leifeld and Menichetti 2018, Leifeld et al 2019). Our estimate for GHG emissions in the tropical climate zone is lower, which is consistent with the smaller degraded peatland area in our data set. Moreover, we disregard emissions from peat extraction, which further explains why our estimate for GHG emissions in the tropical zone is lower. On the other hand, our estimate for GHG emissions in the temperate and boreal climate zone is higher, while the corresponding degraded area is similar. This indicates that distribution of degraded peatland to cropland, pasture and forestry, which partly have diverging emission factors (table S1), is different. Although we use similar rules for the distribution of degraded peatland to managed land as Leifeld and Menichetti (2018), different land-use data sets have been used for this allocation.
According to our scenario results, protection of intact peatlands and restoration of degraded peatlands considerably reduce CO2 emissions from peat degradation at low costs. This finding is in line with case studies from Indonesia (Jaenicke et al 2010) and Ireland (Wilson et al 2013). Moreover, peatland restoration has developed over the last 25 years from small-scale to landscape level restoration (Chimner et al 2017), which underpins the plausibility of our scenario results. However, the success of peatland restoration depends on several factors including the time elapsed since the end of peatland use, the starting conditions and the restoration techniques (Höper et al 2008). In line with previous studies, our restoration scenario shows higher CH4 emissions due to anaerobic conditions caused by rewetting (Abdalla et al 2016). Finally, we find that the net effect of substantially lower CO2 emissions and slightly higher CH4 emissions, in terms of GWP, is a net reduction of GHG emissions from peatlands following restoration, which is supported by a recently published study (Günther et al 2020).
4.2. Modelling peatland dynamics
For estimating future peatland degradation and rewetting, we multiply changes in managed land with a peatland scaling factor (proportion of total peatland area over total land area). With this approach we implicitly assume that intact peatlands are distributed equally within a cell. We acknowledge that this is a simplification, which might result in under- or overestimation of future peatland degradation. However, in the absence of better data on the spatial distribution of intact peatlands, we consider our approach as appropriate since it is plausible (equal distribution) and allows to compare quantitatively various scenarios of future peatland dynamics in a meaningful way. Given our assumptions, all intact peatland in a cell will be degraded if all available land in this cell is used for production. In the contrary case, when all managed land in a cell is abandoned for peatland restoration, all degraded peatland will be rewetted. These two boundary cases define the range of possible future peatland dynamics within our approach.
In line with IPCC guidelines, we assume the same GHG emission factors for all degraded peatlands, irrespective of the point in time when the peat oxidation started. For deep peat deposits, the process of complete peat oxidation may indeed take centuries (Leifeld and Menichetti 2018), but shallow peat layers (and more so in case of fires) may be close to depletion already after 5 years (Hooijer et al 2012). In any case where the peat deposit is close to depletion emission rates would gradually slow down (following kinetics more similar to mineral soils) rapidly approaching zero net emissions. Therefore, our results might overestimate GHG emissions from degraded peatlands to some extent. On the other hand, we here (a) do not account for impacts of climate change (e.g. changes in temperature and precipitation), which might reduce the carbon storage potential of peatlands in the future (Leng et al 2019), and (b) disregard GHG emissions related to peat extraction.
4.3. Limitations of our global model-based scenario projections
Our scenario projections until 2100 must not be interpreted as exact predictions. Instead, our land-use projections including peatland dynamics reflect plausible future trajectories given the underlying socio-economic and climate policy assumptions. The numerical modelling makes these trajectories comparable with each other. The scope of our spatially-explicit approach is modelling future land-use change including peatland dynamics driven by demand for food and land-based mitigation with global coverage. Since peatlands cover only about 3% of the total land area, also projected changes of peatland area are small compared to changes in major land-use types such cropland or pasture (see figures 1 and 2). Due to the small-scale nature of peatland dynamics and because demand for food and bioenergy is defined at the level of 12 geopolitical regions there is considerable flexibility within each region for adjustment of production patterns in the case of peatland protection and/or restoration policies. In our results, peatland protection and restoration policies have almost no economic impact in terms of implementation costs and food security at regional level (figure 5). In reality, however, agriculture on drained peatlands may in some local contexts play an important role for food security due to prevailing subsistence agriculture, e.g. in low income countries in Sub-Saharan Africa. Our approach is not capable of capturing such local effects due to its global scale scope.
5. Conclusion
Our results indicate that a climate policy with land-based mitigation but without peatland protection and restoration measures could result in degradation of presently intact peatlands, associated with an increase of GHG emissions from degraded peatlands in the future. Moreover, even in the case of peatland protection, there are still considerable GHG emissions from degraded peatlands, mostly owing to the historic conversion of intact peatlands. Due to the emissions from degraded peatlands, the land system remains a considerable net source of CO2 throughout the 21st century globally in both cases (RCP2.6 and RCP2.6 + PeatProt), despite negative emissions from afforestation. This result is in contrast to the outcome of current mitigation pathways with land-based mitigation measures, of which most do not include emissions from degraded peatlands, and therefore report declining global CO2 emissions from the land system throughout the 21st century, resulting in net-negative CO2 emissions by 2100 in most scenarios (Huppmann et al 2018) (figure S15). Therefore, by omitting peatland emissions current mitigation pathways likely overestimate the mitigation potential of the land system. However, in line with other studies (Leifeld et al 2019), our results indicate that it is possible to reconcile land use and GHG emissions in mitigation pathways through a peatland protection and restoration policy (RCP2.6 + PeatRestor). Our results suggest that the land system would turn into a global net carbon sink by 2100, as projected by current mitigation pathways, if about 60% of present-day degraded peatlands, mainly in the tropical and boreal climate zone, would be rewetted in the coming decades, next to the protection of intact peatlands. Therefore, peatland protection and restoration are key for climate change mitigation. At the same time, our results indicate that the implementation costs of peatland protection and restoration measures are low, and that there are almost no impacts on regional food security.
Acknowledgments
This work received funding from the NAVIGATE and the ENGAGE project of the European Union's Horizon 2020 research and innovation program under grant agreements 821124 and 821471, respectively. The work of Kristine Karstens was funded by the DFG Priority Program 'Climate Engineering: Risks, Challenges, Opportunities?' (SPP 1689) and specifically the CEMICS2 project (Grant Nos. ED78/3-2).
The data linked in the data availability statement below includes the source code (as developed on https://github.com/magpiemodel) and input data for MAgPIE 4.2.1. The model documentation can be found at https://rse.pik-potsdam.de/doc/magpie/4.2.1/. The source code for compiling a spatially explicit map of intact and degraded peatlands, and the source code for the figure plotting are available as supplementary data. The figures were created with ggplot2 (Wickham 2016).
Data availability statement
The data that support the findings of this study are openly available at the following URL/DOI: 10.5281/zenodo.1418752.
Author contributions statement
F.H. expanded the MAgPIE modelling framework by a peatland module and applied it for this study. F.H. designed the scenario setup, analysed the results, prepared all figures and tables, and wrote the main manuscript text with important contributions from A.P and H.L.C. K.K. contributed to the peatland module development. J.L, L.M. and A.B. provided input data on extent and the state of peatlands. All authors reviewed the manuscript.