


Abstract
MYCN is a master regulator controlling many processes necessary for tumor cell survival. Here, we unravel a microRNA network that causes tumor suppressive effects in MYCN-amplified neuroblastoma cells. In profiling studies, histone deacetylase (HDAC) inhibitor treatment most strongly induced miR-183. Enforced miR-183 expression triggered apoptosis, and inhibited anchorage-independent colony formation in vitro and xenograft growth in mice. Furthermore, the mechanism of miR-183 induction was found to contribute to the cell death phenotype induced by HDAC inhibitors. Experiments to identify the HDAC(s) involved in miR-183 transcriptional regulation showed that HDAC2 depletion induced miR-183. HDAC2 overexpression reduced miR-183 levels and counteracted the induction caused by HDAC2 depletion or HDAC inhibitor treatment. MYCN was found to recruit HDAC2 in the same complexes to the miR-183 promoter, and HDAC2 depletion enhanced promoter-associated histone H4 pan-acetylation, suggesting epigenetic changes preceded transcriptional activation. These data reveal miR-183 tumor suppressive properties in neuroblastoma that are jointly repressed by MYCN and HDAC2, and suggest a novel way to bypass MYCN function.
INTRODUCTION
Neuroblastoma is a tumor originating from neuroectodermal progenitor cells, and is the most frequent extracranial solid tumor in childhood (1). A characteristic feature of neuroblastoma is its heterogeneity, ranging from spontaneous regression to fatal outcome (2). Amplification of the MYCN proto-oncogene is detected in 20–30% of neuroblastomas, and predicts a poor survival (3). MYCN regulates the transcriptional activation and repression of numerous target genes and microRNAs (miRNAs) by recruiting co-factors or co-repressors to create an open or repressed chromatin state, respectively, (4).
MicroRNAs are small non-protein-coding RNA molecules encoded in the genome that are important for diverse cellular processes, including development, differentiation, cell cycle regulation and apoptosis (5). MicroRNAs mainly control gene expression by regulating mRNA translation or stability (6). Because of these regulatory functions, miRNAs can act as oncogenes or tumor suppressors, and aberrant miRNA expression profiles are involved in the initiation and progression of cancer (7,8). Differential miRNA expression profiles were identified in neuroblastomas (9,10), and a miRNA-based classifier has been shown to predict outcome of neuroblastoma patients (11). A genome-wide study for MYCN binding sites in promoters revealed that MYCN regulates the expression of oncogenic and tumor suppressive miRNAs (12). Hence, elucidating mechanisms regulating the expression of individual miRNAs and the mechanisms they control is important to understand neuroblastoma biology. Previous studies have reported that histone deacetylase inhibitors (HDACi) influence miRNA expression levels in cancer cells (13).
Histone deacetylases (HDACs) are enzymes that remove acetyl groups from lysine residues of histones and non-histone proteins (14). The HDAC family consists of the Zn2+-dependent classical members of class I (HDAC1, 2, 3, 8), class IIa (HDAC4, 5, 7, 9), class IIb (HDAC6, 10) and class IV (HDAC11) and the NAD+-dependent members of class III (SIRT1-7) (14,15). HDACs are involved in regulating gene expression via their enzymatic function or as structural components of multiprotein complexes. Aberrant HDAC recruitment and expression and deregulated histone H4 acetylation has been described for tumor cells (16–18). HDACi exert anti-tumoral effects against diverse tumor entities, including neuroblastoma (16,19,20). Nevertheless, the underlying molecular mechanisms are largely unknown.
Here we present miR-183 as a tumor suppressor in highly malignant MYCN-amplified neuroblastoma cells and unravel the mechanism of regulation behind this functionality. The repression of miR-183 by MYCN and HDAC2 indicates HDAC inhibition as a potential novel strategy to activate miR-183 tumor suppressive functions.
MATERIALS AND METHODS
Cell culture
The BE(2)-C, Kelly, SH-SY5Y, SH-EP and IMR-32 neuroblastoma cell lines were cultured in RPMI 1640 or DMEM with 10% fetal calf serum (FCS; Sigma-Aldrich, Munich, Germany) and 1% non-essential amino acids (NEAA; Invitrogen, Darmstadt, Germany) at 37°C, 5% CO2. MYCN-amplified NB8 tumor spheres were established from a short-term culture (NB-S-124) of highly infiltrated bone marrow aspirate kindly provided by co-author F.W., and were grown in Neurobasal A (Invitrogen) with 2% B27 (Invitrogen), 20 ng/ml bFGF (Promocell, Heidelberg, Germany) and 20 ng/ml EGF (Promocell) at 37°C, 5% CO2. BE(2)-C cells stably transfected with an inducible miR-183 or miR negative control expression system were cultured in DMEM supplemented with 10% FCS, 1% NEAA, 1.5 mg/ml G418 (Calbiochem, Darmstadt, Germany) and 7.5 µg/ml blasticidin (Sigma-Aldrich). To induce miR expression, cells were treated with 100 ng/ml doxycycline (Sigma-Aldrich). IMR-32 cells stably transfected with a tetracycline-inducible MYCN shRNA expression system (IMR32-6TR-MYCNsh) were cultured in DMEM with 10% FCS and 1% NEAA supplemented with 250 µg/ml Zeocin (Invitrogen) and 5 µg/ml blasticidin. Cells were treated with 1 µg/ml tetracycline (AppliChem, Darmstadt, Germany) to induce shMYCN expression. All cell lines were regularly monitored for mycoplasma, Acholeplasma laidlawii and squirrel monkey retrovirus (SMRV) infections by high-throughput multiplex cell contamination testing (McCT) (21).
HDACi
Stock solutions of Panobinostat (1 mM; Selleck Chemicals, Houston, TX, USA), PCI-24781 (10 mM; Pharmacyclics, Sunnyvale, CA, USA), Vorinostat (1 mM; Chemos, Regenstauf, Germany), Entinostat (1 mM; Calbiochem), Tubacin (100 mM; provided by Christian Hildmann (Ilmenau, Germany)), Compound 2 (250 mM; provided by Scott M. Ulrich (Ithaca, NY, USA)) and Trichostatin A (100 µM; Calbiochem) were prepared in dimethyl sulfoxide (DMSO). HC-toxin (0.1 mM; Sigma-Aldrich) was dissolved in methanol.
Pre-miR miRNA Precursor miRNAs, Anti-miR miRNA Inhibitors, siRNAs, plasmid DNAs and transfection
Pre-miR miRNA Precursor for hsa-miR-183 (Applied Biosystems) was transfected at a concentration of 30 nM using HiPerFect (Qiagen) according to the manufacturer’s instructions. Pre-miR miRNA Precursor Molecules Negative Control #1 and #2 were used as controls. Anti-miR miRNA Inhibitor for hsa-miR-183 and the control Anti-miR miRNA Inhibitors Negative Control #1 (Applied Biosystems) were transfected at a concentration of 200 nM using HiPerFect. Small interfering RNAs (siRNAs) or non-silencing negative control siRNAs (AllStars Negative Control siRNA, Qiagen; siGenome RISC-free control siRNA, Thermo Fisher Scientific, Schwerte, Germany) were transfected using HiPerFect in a concentration of 25 nM. All siRNAs used are summarized in Supplementary Table S4. For plasmid transfection, 1–4 µg DNA were used together with Lipofectamine (Invitrogen). The expression plasmid containing the full-length human HDAC2 cDNA sequence with a His-tag (HS_HDAC2_IM_2 QIAgenes Expression Kit Insect/Mammalia) and the corresponding empty vector pQE-TriSystem-6 were obtained by Qiagen. For rescue experiments, combining HDAC2 knockdown and enforced HDAC2 expression, the HDAC2 siRNA#2 (Qiagen) was used. The HDAC2 expression plasmid contains an optimized human protein-coding sequence. Silent mutations were introduced in the sequence to optimize codon usage and mRNA stability, while the amino acid sequence of the HDAC2 protein remained unaltered (QIAgenes Insect/Mammalia Handbook, July 2009). Plasmid sequence and HDAC2 siRNA#2 target sequence differ in 5 nt, and the plasmid sequence is therefore, other than the endogenous HDAC2 mRNA sequence, not effectively targeted by this siRNA.
RNA isolation and quantitative RT-PCR
Total RNA was isolated from cell cultures or snap-frozen tissue using the miRNeasy Mini Kit (Qiagen, Hilden, Germany). M-MLV reverse transcriptase (Invitrogen) and random hexamer primers (Invitrogen) were used to transcribe cDNAs. Gene expression was measured by qRT-PCR using SYBR Green Dye (Eurogentec, Cologne, Germany) on an ABI Prism 7700 thermal cycler (Perkin-Elmer Applied Biosystems, Weiterstadt, Germany) as previously described (19), and normalized to the averaged SDHA and HPRT1 expression, genes which are consistently expressed in stage 4 and 4S neuroblastomas (22). All primers used are summarized in the Supplementary Material (Supplementary Table S2).
Quantification of mature miRNAs was performed using TaqMan MicroRNA Assays (Applied Biosystems, Darmstadt, Germany). Detection of mature miR-183 was confirmed by sequencing. A Custom TaqMan Small RNA Assay (Applied Biosystems) was used for detection of miR negative control expression (miR-neg ctrl; sequence: 5′-AAAUGUACUGCGCGUGGAGAC-3′). RNU6B and RNU48 were used for normalization. Relative miR-183 expression in xenografts was calculated using a standard curve. Relative expression levels in different cell lines were calculated using the mean expression of all samples as a calibrator. All expression analyses were performed using Applied Biosystems Prism software and the ΔΔCT method.
Western blot analysis
Cells were lysed for western blotting in buffer containing 20 mM Tris-HCl, 7 M urea, 0.01% Triton X-100, 100 mM dithiothreitol (DTT), 40 mM MgCl2 and Complete protease inhibitor cocktail (Roche, Mannheim, Germany). For the detection of histone H3 acetylation levels, cells were lysed in SDS lysis buffer (62.5 mM Tris-HCl, 2% SDS, 10% (v/v) glycerol, 1 mM DTT and Complete protease inhibitor cocktail). The following antibodies were used: anti-HDAC2 (3F3, sc-81599, Santa Cruz, Heidelberg, Germany), anti-MYCN (B8.4.B, sc-53993, Santa Cruz), anti-Penta-His antibody (Qiagen), anti-Ezrin (3C12, sc-58758, Santa Cruz), anti-acetyl-Histone H3 (Lys14) (06-911, Millipore, Schwalbach, Germany), anti-Histone H3 (#9715, Cell Signaling Technology, Danvers, MA, USA), anti-GAPDH (clone 6C5, Millipore) and anti-ß-actin (clone AC-15, Sigma-Aldrich).
ChIP, Re-ChIP, ChIP-Seq and ChIP-on-chip
Cells were lysed for ChIP in buffer containing 50 mM Tris-HCl, pH 8.1, 1% SDS, 10 mM EDTA and Complete protease inhibitor cocktail (Roche), then sonified to obtain 200–1000 bp DNA fragments. ChIP was performed according to the ChIP Assay Kit (Millipore) protocol. The following antibodies were used: anti-acetyl-Histone H4, anti-MYCN (B8.4.B, sc-53993, Santa Cruz), anti-HDAC2 (3F3, sc-81599, Santa Cruz), anti-HDAC1 (ab7028, Abcam, Cambridge, UK), normal mouse IgG (sc-2025, Santa Cruz) and normal rabbit IgG (sc-2027, Santa Cruz). Primers for specific qRT-PCR amplification of the miR-183 promoter region were: forward: 5′-CGTAGGGCCACTGGACGA-3′, reverse: 5′-TTGTCCCCATTCCAGCCCTG-3′. For Re-ChIP analysis, chromatin precipitated by the first ChIP round was eluted with 10 mM DTT in TE buffer for 30 min at 37°C. Eluates were diluted 1:20 in ChIP dilution buffer (ChIP Assay Kit, Millipore), then used in second round of ChIP. For ChIP-Seq, ChIP samples were prepared and run on a Genome Analyzer II (Illumina) according to the manufacturer's guidelines. Read data were processed in a Perl-based analysis pipeline using the following packages: Bowtie for read mapping to the human GRCh37 assembly (reference genome), SAMtools and Picard for sequence manipulation, and MACS for peak calling (23–25). R scripting was used to assess read quality. Results were visualized with the UCSC genome browser (GRCh37/hg19 assembly, February 2009). ChIP-on-chip was performed as described previously (26–28) using 10 μg of either anti-MYCN, anti-histone H3 K4me3 (ab8580, Abcam), anti-histone H3 K36me3 (ab9050, Abcam), anti-histone H3 K27me3 (07-449, Millipore), or normal mouse IgG antibody. The Human Promoter ChIP-chip Set 244 K microarray (Agilent) spans regions roughly −5.5 kb to +2.5 kb (∼25 probes per gene with a spacing of ∼195 nt) from the transcriptional start sites of ∼17 000 human transcripts chosen as being the best-defined by RefSeq. ChIP-on-chip data were normalized using the limma quantile algorithm. Results were visualized with the Integrative Genomics Viewer v1.5.52 from the BROAD Institute (29).
Animal experiments
Animal experiments were approved by the German Cancer Research Center institutional animal care and use committee and the Regierungspräsidium Karlsruhe. All experiments conform to the relevant regulatory standards. CB17-SCID mice were purchased from Charles River Laboratories (Sulzfeld, Germany) and held under standard animal care conditions in the DKFZ animal facility. For Panobinostat studies, 1 × 10⁶ BE(2)-C cells were subcutaneously implanted into mice. Animals were treated with 15 mg/kg/d Panobinostat or solvent (5% dextrose in water) by intraperitoneal injection 5 d/week (30) starting 24 h after implantation (n = 12 per study group). Animals were sacrificed on day 14 of treatment, and miR-183 expression in the xenograft was analysed by qRT-PCR. For miR-183 overexpression studies, BE(2)-C cells were transiently transfected with the Pre-miR miRNA precursor for hsa-miR-183 or Negative Control #1 (Applied Biosystems). Cells (1 × 10⁶) were subcutaneously injected into CB17-SCID mice (n = 11 per study group) 48 h after transfection. Tumor size was measured daily using a caliper. Tumor volume was calculated by π/6(w1 × w2 × w2), where w1 was the largest tumor diameter and w2 was the smallest tumor diameter.
Statistical analysis
In vitro experiments included three independent replicates, and results were compared using unpaired or paired t-tests. In vivo effects on tumor growth by miR-183 overexpression were analysed using the non-parametric Mann–Whitney U test (GraphPad Prism version 5.01). For analysis of miR-183 induction by HC-toxin in MYCN-amplified versus non-amplified cell lines in time-course, a linear mixed model was used to evaluate the AUC of the log-transformed measurements with a random effect for the cell line. For statistical analysis of miR-183 induction by HDACi at a single treatment time, miR-183 expression was log-transformed. A mixed linear model was used with fixed factor (MYCN-amplified/MYCN single copy) and random intercept for each ID. Statistical analysis of the number of viable and dead cells after miR-183 overexpression compared miR-183 transfectants to both negative controls. For comparison of treatment, a mixed linear model was used with fixed factor treatment and random intercept for each ID. For the comparison of miR-183 expression between both negative controls and both HDAC-specific siRNAs, a mixed linear model was used with fixed factor treatment and random intercept for each siRNA. For statistical analysis of endogenous miR-183 expression levels in cell lines, miR-183 expression was log-transformed and a mixed linear model was used to compare MYCN-amplified and non-amplified cell lines with random intercept for each cell line. All mixed linear model analyses were performed using SAS PROC MIXED, SAS Version 9.2 (SAS Institute Inc., Cary, NC, USA). P-values below 0.05 were considered significant.
RESULTS
miR-183 is the strongest HDACi-responsive microRNA in neuroblastoma cells
We used miRNA array profiling to identify miRNAs causally involved in inducing apoptosis or differentiation or inhibiting proliferation of neuroblastoma cells after HDACi treatment. BE(2)-C cells were treated with the pan-HDACi, HC-toxin or solvent control for 24 h before miRNA expression profiling. HC-toxin treatment resulted in significant differential expression of 40 miRNAs (Figure 1A, left panel), of which miR-183 was most strongly up-regulated, with a 13-fold induction (Figure 1A, right panel). MicroRNAs organized in the same miRNA cluster, miR-182 (11.7-fold) and miR-96 (2.6-fold), were also up-regulated. Quantitative reverse-transcriptase PCR (qRT-PCR) analysis validated miR-183 as being the miRNA that was most dramatically up-regulated (51.3-fold), and confirmed the ∼10-fold induction of miR-182 and miR-96 (Figure 1B). We analysed the kinetics of miR-183 expression after HC-toxin treatment of the MYCN-amplified cell lines, BE(2)-C and Kelly and the non-amplified cell lines, SH-SY5Y and SH-EP. HC-toxin-induced miR-183 expression, which remained up-regulated up to 72 h of continuous treatment, in all four cell lines (Figure 1C). Induction of miR-183 peaked at 80-fold in MYCN-amplified cell lines and at 10-fold in cell lines without MYCN amplification (Figure 1C). We next tested the influence of the clinically more advanced pan-HDAC inhibitors, Panobinostat, PCI-24781 and Vorinostat (31), on miR-183 expression in these four cell lines after 24 h of continuous treatment. All three inhibitors significantly induced miR-183 up to 95-fold (Figure 1D and Supplementary Table S1). Similar to HC-toxin, all three inhibitors induced stronger miR-183 up-regulation in MYCN-amplified cell lines. Collectively, these data suggest miR-183 induction by pan-HDAC inhibition to be a common event in neuroblastoma cell lines in vitro. To test the influence of HDACi treatment on miR-183 expression in an in vivo neuroblastoma model, BE(2)-C cells were subcutaneously injected into CB17-SCID mice, followed by intraperitoneal injection of Panobinostat or solvent for 5 d/week up to 14 days. High miR-183 expression correlated with small tumor volumes caused by Panobinostat treatment (Figure 1E). In summary, miR-183 was strongly induced in neuroblastoma cells by pan-HDACi in both in vitro and in vivo models, and cells with a MYCN amplification were more strongly affected.
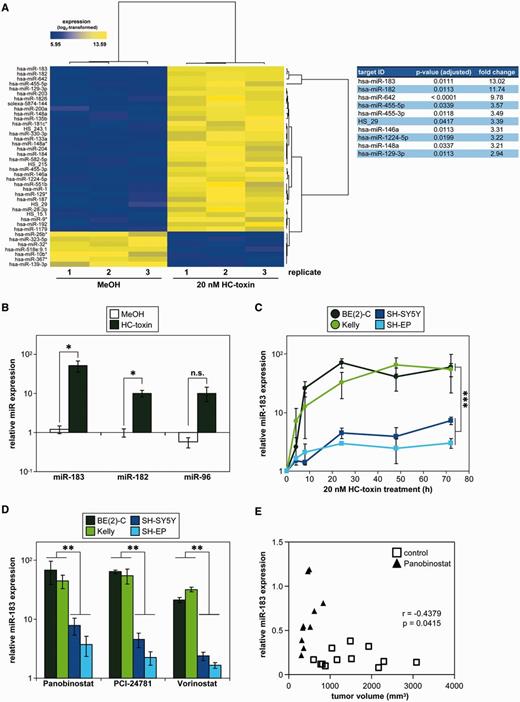
pan-HDACi strongly induce miR-183 in neuroblastoma cell lines and xenografts in mice. (A) Heat map representation of miRNA profiling (left panel) indicates significantly (P < 0.05) up- (yellow) or down-regulated (blue) miRNAs in BE(2)-C cells treated for 24 h with HC-toxin or solvent control (methanol; MeOH). The miRNAs most strongly up-regulated are indicated together with the fold-change expression over the solvent control and adjusted P-values (right panel). (B) Validation of strongest miR-183 induction and miR-182/miR-96 induction by HC-toxin. BE(2)-C cells were treated as described in (A). Expression was measured by qRT-PCR and is shown relative to untreated controls (mean ± SD) on a log scale. (C) HC-toxin induced and maintained miR-183 expression over 72 h of treatment in four neuroblastoma cell lines. Expression was measured by qRT-PCR, and is shown at several time points relative to the respective solvent-treated control cells (as mean ± SD) on a log scale. miR-183 induction compared to solvent control was significant for all cell lines (P < 0.05). Statistical analysis further compared MYCN-amplified cell lines (green-tone lines) with cell lines having a single MYCN copy (blue-tone lines). (D) Cell lines were treated for 24 h with different clinically relevant pan-HDACi (20 nM Panobinostat, 0.25 µM PCI-24781 or 1 µM Vorinostat), and miR-183 induction was measured by qRT-PCR. Expression relative to solvent-treated controls (mean ± SD) is shown on a log scale. Statistical analysis compared MYCN-amplified (green-tone bars) with single-copy (blue-tone bars) cell lines for each pan-HDACi. (E) CB17-SCID mice carrying subcutaneous BE(2)-C cell xenografts were treated with 15 mg/kg/d Panobinostat or solvent (control) injected daily intraperitoneally for 5 d/week for 2 weeks. Significant correlation of miR-183 expression relative to solvent-treated xenograft tumors and xenograft tumor volumes are shown from treatment day 14. Pearson’s correlation coefficient (r) and P-value are indicated. Relative miR-183 expression in xenografts was calculated using a standard curve. *P ≤ 0.05; **P ≤ 0.001; ***P ≤ 0.0001; n.s., not significant.
Enforced expression of miR-183 induces cell death in neuroblastoma cells
To test the phenotypic consequences of elevated miR-183 in MYCN-amplified neuroblastoma cells, miR-183 was transiently overexpressed in three MYCN-amplified neuroblastoma cell lines and a MYCN-amplified neuroblastoma tumor sphere culture (NB8) growing under stem cell promoting conditions. The BE(2)-C and Kelly cell lines both carry TP53 mutations (32,33), and the IMR-32 cell line and NB8 tumor sphere culture both have wildtype TP53 ((33); data not shown). Transfection efficacy was validated by assessing expression of miR-183 by qRT-PCR (Figure 2A) and of the Ezrin protein, a known direct miR-183 target (Supplementary Figure S1; (34)). Independent of TP53 status, enforced miR-183 expression reduced the number of viable cells up to 73% (Figure 2B) and increased the number of trypan blue-positive, dead cells by up to 7.5-fold compared to negative control-transfected cells (Figure 2C). To dissect the cell death mechanisms involved, we investigated caspase-3-like activity in BE(2)-C and Kelly cells upon enforced miR-183 expression, and measured a 3.9- to 5.5-fold induction of caspase-3-like activity (Figure 2D). Flow cytometric analysis revealed a 2.5- to 2.7-fold increase in the number of BE(2)-C and Kelly cells with DNA fragmentation (Figure 2E). To distinguish the extent of cell death triggered by miR-183 induction from various other signaling cascades modulated by HDAC inhibitors, we transiently transfected BE(2)-C cells with an anti-miR-183 inhibitor followed by treatment with Panobinostat. Panobinostat treatment alone induced a 3.8-fold increase in dead cells over control, and the anti-miR-183 inhibitor reduced this increase by 8% to 3.5-fold (Figure 2F), indicating that HDACi treatment triggers pro-apoptotic mechanisms, among several others, through miR-183 induction. Together, the results demonstrate that enforced miR-183 expression in MYCN-amplified neuroblastoma cells induces cell death, and that the mechanism of miR-183 induction contributes to the cell death phenotype induced by pan-HDAC inhibitors in neuroblastoma cells.
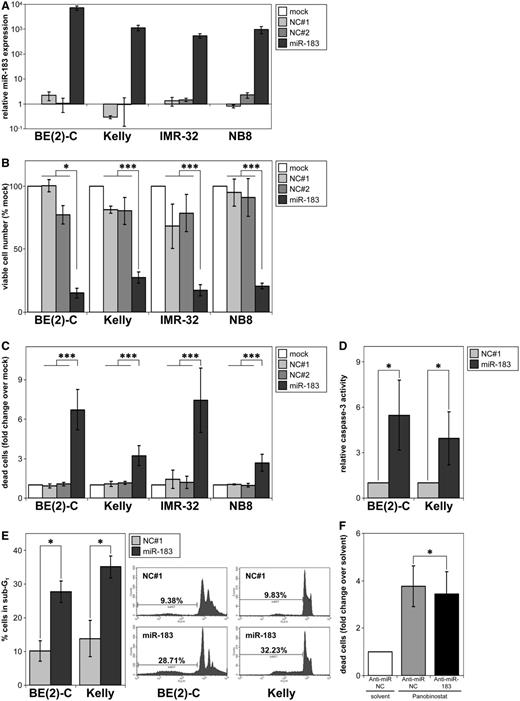
miR-183 induces cell death in vitro. (A) Cell lines or NB8 spheres were transiently transfected with miR-183 or negative controls (NC#1 and #2), and miR-183 expression was measured using qRT-PCR 96 h after transfection. Expression relative to mock-transfected control cultures (mean ± SD) is shown on a log scale. (B) Cell lines or NB8 spheres were transiently transfected as described in (A), and viable cells were counted using trypan blue staining and automated cell counting. The mean ± SD of viable cells (not stained with trypan blue) counted relative to the number of viable cells in mock-transfected control cultures (=100%) are shown. (C) Mean numbers (±SD) of trypan blue-positive cells from cultures described in (B) relative to mock-transfected cells (=1). (D) Cell lines were transiently transfected with miR-183 or negative control (NC#1), and analysed for caspase-3-like activity 72 h after transfection. Mean ± SD caspase-3-like activity is displayed relative to that of the negative control. (E) Cells were stained with propidium iodide 72 h after transfection with miR-183 or negative control (NC#1). The percentage of cells in the sub-G1 phase is shown. (F) BE(2)-C cells were transiently transfected with anti-miR-183 inhibitor or anti-miR negative control (Anti-miR-NC). About 18 h after transfection, cells were treated with 20 nM Panobinostat or solvent for 72 h. Number of dead cells were counted using trypan blue staining and automated cell counting (mean numbers of trypan blue-positive cells relative to Anti-miR-NC-transfected and solvent-treated cells ± SD). *P ≤ 0.05; ***P ≤ 0.0001.
Induction of miR-183 decreases colony formation in soft agar and inhibits neuroblastoma xenograft growth in mice
To investigate whether inducing miR-183 expression influences anchorage-independent colony formation, BE(2)-C cells stably transfected with an inducible miR-183 construct or a miR negative control expression system were analysed in soft agar assays. Induction of miR-183 decreased colony formation to ∼50% (Figure 3A, lower panels). In contrast, induction of the miR negative control (miR-neg ctrl) in a similar range as miR-183 produced no significant difference in colony formation upon induction (Figure 3A, upper panel). BE(2)-C cells transiently transfected with miR-183 or negative control were subcutaneously implanted into CB17-SCID mice and grown as xenografts to examine potential anti-tumoral effects of enforced miR-183 expression in vivo. Enforced miR-183 expression inhibited neuroblastoma xenograft growth, and resulted in ∼47% decrease in xenograft size (Figure 3B). Taken together, miR-183 exerts tumor suppressive functions in both a long-term in vitro assay and a xenograft mouse model of neuroblastoma.
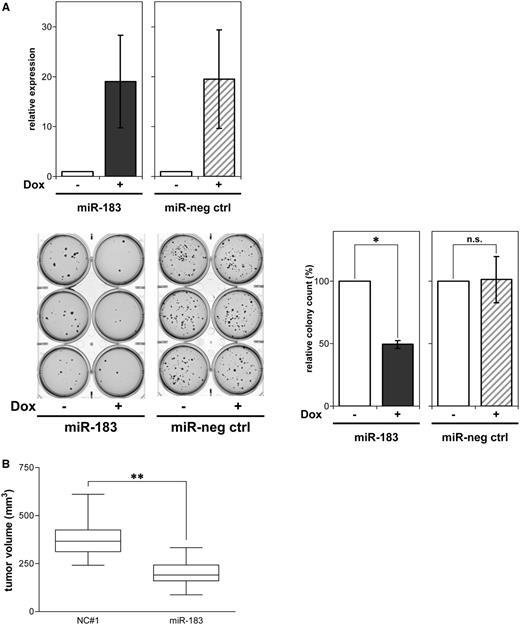
miR-183 inhibits colony formation in soft agar and suppresses neuroblastoma xenograft growth in mice. (A) The BE(2)-C cell line was stably transfected with doxycycline-inducible expression constructs for miR-183 or a miR negative control (miR-neg ctrl). miR-183 or miR-neg ctrl expression upon treatment with or without doxycycline (Dox) for 24 h was measured by qRT-PCR (mean ± SD) (upper panel). Colony growth in soft agar under continuous treatment with or without doxycycline (Dox) is shown for representative cultures after staining with crystal violet (lower-left panel). The results of the soft agar assays are presented as bar graphs of the mean number of colonies (±SD) forming in doxycycline-treated cultures relative to solvent-treated cultures (set to 100%) (lower-right panel). (B) BE(2)-C cells were transiently transfected with miR-183 or negative control (NC#1), and subcutaneously injected into CB17-SCID mice 48 h after transfection. Xenograft tumor volumes after 8 days are presented as box plots, and were compared using the Mann–Whitney U test. *P ≤ 0.05; **P ≤ 0.001; n.s., not significant.
HDAC2 negatively regulates miR-183 expression
To narrow down the HDACs involved in miR-183 repression, we treated neuroblastoma cells with HDACi that selectively block specific HDACs. Applying Entinostat at a concentration that inhibits HDAC1-3 and 9 (35) caused a 2.7- to 46.5-fold miR-183 induction in all cell lines analysed (Figure 4A and Supplementary Table S1), resembling the 2.9- to 50.8-fold induction by pan-HDACi Trichostatin A (Figure 4A and Supplementary Table S1) and by all other pan-HDACi previously analysed (Figure 1C and D). Similarly to pan-HDACi induction of miR-183, induction was stronger in the MYCN-amplified cells. In contrast, the HDAC6-selective inhibitor, Tubacin, and the HDAC8-selective inhibitor, Compound 2 (36), did not induce miR-183 (Figure 4A and Supplementary Table S1). These results suggest only single HDACs play a role in miR-183 regulation. To identify the HDACs causally involved, all eleven classical HDAC family members were singly depleted in BE(2)-C cells by siRNA-mediated knockdown using two different siRNAs (Supplementary Tables S3 and Supplementary Data). Class III HDACs were not analysed since they are not affected by the pan-HDACi used in our study (37). Only HDAC2 depletion induced miR-183 expression, resulting in a 10.4- to 11.4-fold induction (Figure 4B, Supplementary Table S3 and Supplementary Figure S2A). Depletion of HDACs 5, 7, 8 and 9 did not affect miR-183 expression (Figure 4B). Depletion of HDACs 1, 3, 4, 6, 10 and 11 decreased miR-183 levels (Figure 4B), suggesting that these HDAC family members may counteract the influence of HDAC2 on miR-183 expression. In line with the induction of miR-183 by HDACi in several neuroblastoma cell lines (Figure 1C and D), HDAC2 depletion induced miR-183 in three other neuroblastoma cell lines (Figure 4C and Supplementary Figure S2B). Enforced HDAC2 expression reduced endogenous miR-183 expression (Figure 4D and Supplementary Figure S2C) and counteracted the siRNA-mediated induction of miR-183 by HDAC2 depletion (Figure 4E). To test if HDAC2 enforced expression counteracts in part the induction of miR-183 by treatment with HDAC inhibitors, BE(2)-C cells were transiently transfected with HDAC2 followed by treatment with Entinostat. Enforced HDAC2 expression decreased the miR-183 induction triggered by Entinostat by ∼30% (Figure 4F). In conclusion, our data show that HDAC2 represses miR-183 levels.
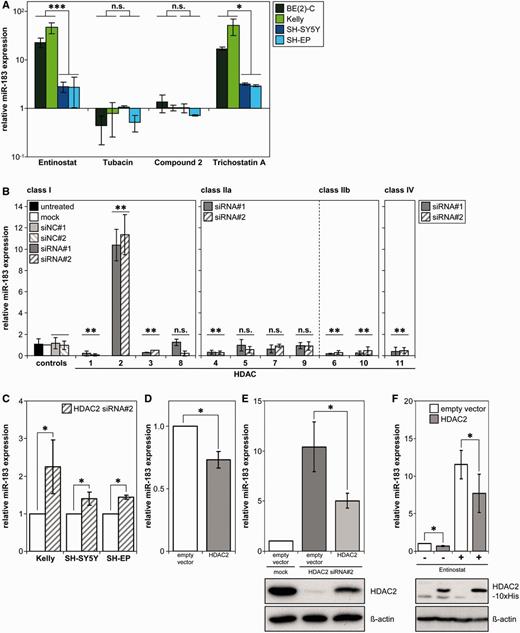
HDAC2 negatively regulates miR-183 expression. (A) Cell lines were treated 24 h with 1 µM Entinostat, 5 µM Tubacin, 40 µM Compound 2 or 75 nM Trichostatin A, then miR-183 expression was measured using qRT-PCR. Relative expression to expression in solvent control is shown as mean ± SD on a log scale. Statistical analysis compared MYCN-amplified (green-tone bars) with MYCN-single-copy (blue-tone bars) cell lines treated with each HDACi. (B) BE(2)-C cells were transiently transfected with 2 siRNAs (siRNA#1, #2) to specifically silence each HDAC (x-axis) or negative control siRNAs (siNC#1, siNC#2), and miR-183 expression was analysed using qRT-PCR 96 h after transfection. Relative expression to mock-transfected cells is presented as mean ± SD, and statistics compared siRNA-transfected pairs with negative control-transfected pairs for each HDAC. (C) Neuroblastoma cell lines were transiently transfected with siRNA#2 targeting HDAC2. Following HDAC2 knockdown (96 h post-transfection), miR-183 expression was analysed via qRT-PCR. Mean expression relative to mock-transfected cells is presented (±SD). (D) HDAC2 expression was enforced in BE(2)-C cells via transient transfection with a HDAC2 expression construct, and miR-183 expression was analysed by qRT-PCR 72 h after transfection. Mean expression relative to empty vector-transfected cells ± SD is shown. (E) Enforced HDAC2 expression counteracted induction of miR-183 by HDAC2 knockdown. BE(2)-C cells were transiently transfected with siRNA#2 against HDAC2, and 24 h later with the HDAC2 expression construct. Cells were harvested 120 h after siRNA and 96 h after plasmid transfection and qRT-PCR performed for miR-183 expression (mean expression relative to empty vector- and mock-transfected cells ± SD). Western blot for HDAC2 expression 72 h after siRNA and 48 h after plasmid transfection with the ß-actin loading control are shown below. (F) Enforced HDAC2 expression counteracted miR-183 induction upon HDACi treatment. BE(2)-C cells were transiently transfected with the HDAC2 expression construct followed by treatment with 1 µM Entinostat or solvent control. RNA was extracted 72 h after transfection and 24 h after HDACi treatment and qRT-PCR performed for miR-183 expression (mean expression relative to empty vector- and solvent-treated cells ± SD). Western blot for His-tagged HDAC2 using an anti-Penta-His antibody with the ß-actin loading control are shown below. *P ≤ 0.05; **P ≤ 0.001; ***P ≤ 0.0001; n.s., not significant.
MYCN and HDAC2 are recruited to the miR-183 promoter region
Since the strongest miR-183 induction by HDACi occurred in MYCN-amplified cells, we assessed endogenous miR-183 expression in neuroblastoma cell lines with different MYCN genomic backgrounds. The MYCN-amplified cell lines, BE(2)-C and Kelly, expressed distinctly lower miR-183 levels than SH-SY5Y and SH-EP cells, which maintain a single MYCN copy (Figure 5A). We hypothesized that HDAC2 and MYCN may interact to suppress miR-183 transcription, as was previously shown for the CCNG2 gene in BE(2)-C cells (38). Indeed, miR-183 levels were higher in cells with low HDAC2 expression (Figure 5A), supporting this hypothesis. Next, we aimed to decipher events occurring at the miR-183 promoter region. The miR-183 cluster is located on chromosome 7 between the two protein-coding genes, NRF1 and UBE2H (Figure 5B). Bioinformatic analysis predicted a putative transcription start site (TSS) ∼5 kb upstream of miR-183 (39). The TSS was predicted to be 139 bp upstream of the site described by Ozsolak and colleagues using a second independent bioinformatic approach (40). We analysed chromatin immunoprecipitation sequencing (ChIP-Seq) experiments of Kelly cell lysates using an antibody against MYCN to determine whether MYCN is associated with the promoter region. MYCN was significantly enriched in a region ∼100–240 bp upstream of the putative TSS (Figure 5C), demonstrating an association of MYCN to the miR-183 promoter region. Genome-wide ChIP-on-chip assays using BE(2)-C, Kelly, SH-SY5Y and SH-EP neuroblastoma cell lines also revealed that the epigenetic marker for repressed chromatin, H3K27me3 (histone 3 lysine 27 tri-methylation), was enriched at the miR-183 promoter region in MYCN-amplified cell lines in comparison to single-copy cell lines (Figure 5D). This is in line with the lower endogenous miR-183 expression detected in MYCN-amplified neuroblastoma cells (Figure 5A). Marks for activated chromatin, H3K4me3 (histone 3 lysine 4 tri-methylation), and elongation, H3K36me3 (histone 3 lysine 36 tri-methylation), were not prominently enriched at the genomic location of the miR-183 cluster. In contrast, both neighboring protein-coding genes, NRF1 and UBE2H, were in a transcriptionally activated state, characterized by both a strong enrichment for H3K4me3 and H3K36m3 and a reduced H3K27me3 association, indicating that events at the miR-183 TSS were specific and not a consequence of events in the surrounding genomic area (data not shown). To confirm MYCN recruitment to the miR-183 promoter region, we performed ChIP experiments with the same anti-MYCN antibody used for ChIP-Seq analysis. We detected a 2.8-fold enrichment for miR-183 promoter-specific DNA with the anti-MYCN antibody over IgG in BE(2)-C cells (Figure 5E). The enriched region was located ∼430–570 bp upstream of the putative TSS, thus, validating the ChIP-Seq data (Figure 5C). We next conducted ChIP with an antibody against HDAC2 to assess whether HDAC2 is recruited to the miR-183 promoter region, and detected a 2.9-fold enrichment above IgG (Figure 5F). These results suggest that both MYCN and HDAC2 are recruited to the miR-183 promoter region. Since HDACs 1 and 2 have been found together as components of transcriptional repressor complexes (15,41), we tested again by ChIP whether HDAC1 is also recruited to the miR-183 promoter region and found no enrichment above IgG (Figure 5F). Because HDAC2 depletion increased miR-183 expression and HDAC2 was recruited to the miR-183 promoter region, we next investigated the pan-acetylation of histone H4 associated with the miR-183 promoter region. ChIP utilizing an antibody against pan-acetyl-histone H4 revealed that HDAC2 depletion caused an increase in histone H4 pan-acetylation associated with the miR-183 promoter region (Figure 5G). The increase in H4 pan-acetylation indicates that epigenetic changes precede the transcriptional activation of miR-183 expression in neuroblastoma cells. We performed ChIP and Re-ChIP experiments to test whether MYCN and HDAC2 are recruited in the same complexes to the miR-183 promoter region. Chromatin precipitated in the first round of ChIP with the HDAC2-specific antibody was subjected to a second round of ChIP (Re-ChIP) using a MYCN-specific antibody. Re-ChIP was compared against a Re-ChIP using the HDAC2-specific antibody also in the second round as a control. ChIP/Re-ChIP experiments demonstrated a 6.8-fold enrichment for HDAC2 and a 10.8-fold enrichment for MYCN above IgG (Figure 5H). We conclude that MYCN and HDAC2 are recruited in the same protein complexes to the miR-183 promoter region to suppress miR-183 transcription.
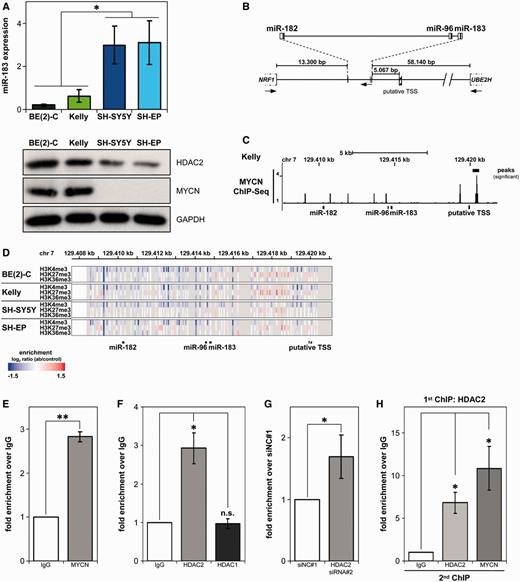
MYCN and HDAC2 are recruited to the miR-183 promoter region in the same complexes. (A) qRT-PCR analysis of endogenous miR-183 expression levels in neuroblastoma cell lines. Western blots for HDAC2 and MYCN expression with the GAPDH loading control are shown below each cell line. Statistical analysis compared cell lines with (green-tone bars) and without (blue-tone bars) MYCN amplifications. (B) Schematic representation of genomic localization and organization of the miR-183 cluster (based on the UCSC genome browser, GRCh37/hg19 assembly, February 2009) with distances to neighboring protein-coding genes. TSS, region of predicted putative transcription start site; arrows, direction of transcription. (C) ChIP-Seq analysis from Kelly cell lysates using an antibody detecting MYCN showing MYCN association in the promoter region of miR-183 cluster (black bars) superimposed on the miR-183 cluster genomic organization. (D) Enrichment of H3K27 tri-methylation at the miR-183 promoter region in MYCN-amplified cell lines. Heat map representing ChIP-on-chip data for the H3K4me3, H3K27me3 and H3K36me3 epigenetic marks at the miR-183 cluster in neuroblastoma cell lines superimposed on the genomic probe localization. Enrichment was calculated as the log2 ratio of antibody (ab) to control, and is shown as graded color bars ranging from no binding (blue) to strong binding (red). (E, F) ChIP analysis in BE(2)-C cell lysates showing MYCN (E) and HDAC2 (F) recruitment to the miR-183 promoter region and no recruitment of HDAC1 (F). Bars represent mean relative enrichment above the IgG control (±SD), detected by qRT-PCR of the miR-183 promoter region. (G) ChIP showing increased histone H4 acetylation at the miR-183 promoter region after HDAC2 knockdown. BE(2)-C cells were transiently transfected with siRNA against HDAC2 (siRNA#2) or negative control (siNC#1), and ChIP analysis with a pan-acetyl-histone H4 antibody was performed 96 h after transfection. Bars show mean fold enrichment above siNC#1 control (±SD) measured by miR-183 promoter region qRT-PCR. (H) Re-ChIP showing recruitment of MYCN and HDAC2 in the same complexes. First ChIP conducted on BE(2)-C cell lysates with an anti-HDAC2 antibody. Chromatin precipitates used in the second ChIP with the indicated antibodies (x-axis). Bars represent mean enrichment above the Re-ChIP IgG control (±SD) detected by qRT-PCR of the miR-183 promoter region. *P ≤ 0.05; **P ≤ 0.001; n.s., not significant.
MYCN and HDAC2 are required to repress miR-183
MYCN and HDAC2 recruitment to the miR-183 promoter region suggests that both are involved in suppressing miR-183 expression. We examined miR-183 regulation in a neuroblastoma cell line stably transfected with a tetracycline-inducible MYCN shRNA expression system. shRNA-mediated MYCN knockdown decreased MYCN expression without influencing the total HDAC2 protein level (Figure 6A). Consistent with the increase in miR-183 expression after HDAC2 depletion (Figure 4B, Supplementary Table S3 and Supplementary Figure S2A), MYCN knockdown also increased miR-183 expression (Figure 6B). ChIP experiments using these cells revealed a reduced recruitment of HDAC2 to the miR-183 promoter region upon MYCN knockdown (Figure 6C). To define the influence of HDAC inhibition on the extent of MYCN recruitment to the miR-183 promoter region, we performed anti-MYCN ChIPs followed by miR-183 promoter-specific PCRs after Panobinostat treatment of BE(2)-C cells for two different treatment periods, 2 h or 24 h. Inhibition of HDAC activity by Panobinostat treatment for 24 h significantly reduced the recruitment of MYCN to the miR-183 promoter site by ∼20%, whereas inhibition of HDAC activity for 2 h had no major effects (Figure 6D, upper panel). Inhibition of HDAC activity was confirmed by the detection of increased H3 pan-acetylation levels at both time points (Figure 6D, lower panels). In parallel, overall MYCN expression levels upon pan-HDAC inhibition were measured by western blot analysis. While Panobinostat treatment for 2 h had no major effects on MYCN protein levels, treatment for 24 h strongly reduced MYCN protein levels (Figure 6D, lower panels). In conclusion, at early time points (2 h) HDAC inhibition did not change recruitment of MYCN to the miR-183 promoter region. It remains to be elucidated whether the reduced recruitment of MYCN to the miR-183 promoter site at 24 h of Panobinostat treatment is caused by the longer inhibition of HDAC activity compared to the 2 h time point, by the reduction in overall MYCN expression or by both mechanisms. Taken together, these data demonstrate that MYCN and HDAC2 are both required for the suppression of miR-183 expression in neuroblastoma cells (model in Figure 7).
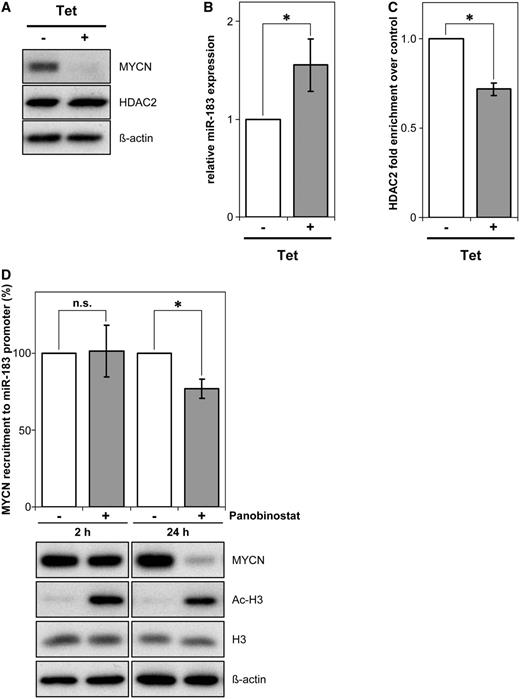
miR-183 repression requires MYCN and HDAC2. (A) MYCN and HDAC2 expression in the IMR-32 cell line, harboring a tetracycline-inducible MYCN shRNA expression construct, is shown after 48 h of treatment with or without tetracycline (Tet). ß-actin served as a loading control. (B) miR-183 expression was analysed by qRT-PCR in the same neuroblastoma cell model after MYCN shRNA induction. Bars show mean miR-183 expression relative to solvent-treated cells ± SD. (C) ChIP analysis with a HDAC2-specific antibody revealed less HDAC2 recruitment (gray bar) to the miR-183 promoter region in lysates of cells treated as in (A) after MYCN depletion. Mean enrichment detected by miR-183 promoter qRT-PCR relative to solvent-treated cells (±SD) is shown. (D) ChIP analysis investigating MYCN recruitment to the miR-183 promoter region upon Panobinostat treatment. BE(2)-C cells were treated with Panobinostat or solvent for 2 h or 24 h. Bars represent mean MYCN recruitment to the miR-183 promoter region (±SD) relative to solvent-treated cells at each time point (=100%) measured by miR-183 promoter region qRT-PCR. Western blot for MYCN expression and histone H3 pan-acetylation with the H3 and ß-actin loading controls are shown below. *P ≤ 0.05; n.s., not significant.
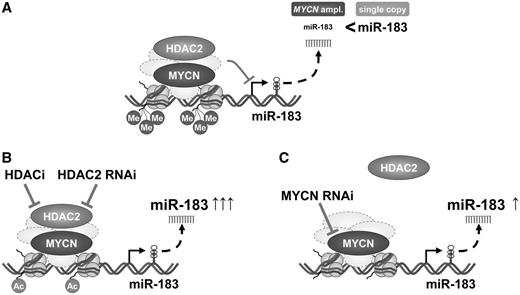
Schematic model of MYCN/HDAC2-mediated miR-183 repression in neuroblastoma. (A) MYCN and HDAC2 are recruited in the same complexes to the miR-183 promoter region and repress miR-183 expression. The repressive epigenetic mark, tri-methylation of H3K27, is more enriched in neuroblastoma cells harboring MYCN amplifications, and miR-183 expression is lower. (B) HDAC2 causes transcriptional repression of miR-183. HDAC2 inhibition or depletion results in miR-183 induction. Increased histone H4 pan-acetylation in the miR-183 promoter region in response to HDAC2 knockdown indicates epigenetic changes and transcriptional activation of miR-183. (C) MYCN is important for HDAC2 recruitment to the miR-183 promoter region, since MYCN depletion reduces HDAC2 recruitment to the promoter and increases miR-183 expression.
DISCUSSION
Here we identified miR-183 as the strongest pan-HDACi-responsive miRNA in highly malignant MYCN-amplified neuroblastoma cells, and unraveled the distinct tumor suppressive properties of miR-183 in this childhood malignancy. A review of the literature indicates that miR-183 expression is dysregulated in different human cancer entities. It has been described that miR-183 is up-regulated in colorectal cancer (42,43), prostate cancer (44) and hepatocellular carcinomas (45) compared to matched adjacent normal tissues. In contrast, miR-183 expression has been found to be down-regulated in ovarian cancer (46), breast cancer stem cells (47) and osteosarcomas (48) compared to control cells/tissues. Beyond these expression studies, miR-183 was identified in functional studies as a potential inhibitor of metastatic invasion in both lung cancer and osteosarcoma cell lines (34,48). These findings suggest that miR-183 can act as an oncogene or a tumor suppressor, depending on the cellular context.
In the literature, several direct targets of miR-183 are described. For example, integrin beta 1 (ITGB1) is targeted by miR-183 in HeLa cells (49), and it has been shown in a previous study, that an antisense oligonucleotide to ITGB1 or an antibody against ITGB1 blocking integrin-mediated cell adhesion induces apoptosis in neuroblastoma cells (50). Another reported miR-183 target is the polycomb group family member BMI-1 in pancreatic cancer cell lines (51). BMI-1 is highly expressed in neuroblastoma cell lines and primary tumor samples (52), has been shown to inhibit the apoptotic activity of MYCN in neuroblastoma cells, and siRNA-mediated down-regulation of BMI-1 resulted in decreased colony growth in soft agar assays and impaired xenograft growth in mice (52). Thus, down-regulation of ITGB1 and BMI-1 expression by miR-183 could potentially contribute to the induction of cell death, decrease in colony formation in soft agar and inhibition of neuroblastoma xenograft growth mediated by miR-183 enforced expression. Furthermore, isocitrate dehydrogenase 2 (IDH2) was recently identified as a direct miR-183 target in glioma cells (53) and it has been reported that overexpression of IDH2 resulted in increased resistance to staurosporine-induced oxidative stress by inhibition of mitochondrial production of reactive oxygen species (ROS) after cytochrome c release in neuroblastoma cells (54). Beyond these targets, it has been described that miR-183 directly regulates Ezrin in lung and osteosarcoma cell lines (34,48), and our data indicate that miR-183 down-regulates Ezrin expression also in neuroblastoma cells. It remains to be elucidated whether the potential regulation of all those proteins by miR-183 in neuroblastoma cells contributes to the phenotype described in our study.
Identification of actions consistent with a tumor suppressive function of high miR-183 expression levels in different preclinical neuroblastoma models prompted us to decipher the transcriptional regulation of miR-183, which can be distinctly induced by diverse small molecule pan-HDACi independent of their chemical structure. We conducted a RNAi-mediated screen of the 11 classical HDACs categorized into classes I, IIa, IIb and IV, and found that only HDAC2 depletion caused an increase in miR-183 expression. This could be mimicked by treating a panel of neuroblastoma cell lines with small molecules inhibiting HDAC2 enzymatic activity. In contrast, HDAC6- and HDAC8-specific small molecule inhibitors did not induce miR-183 expression, supporting the results of our RNAi screen. HDAC2 depletion increased histone H4 pan-acetylation associated with the miR-183 promoter region, indicating increased transcriptional activation. Furthermore, our RNAi-mediated HDAC screen showed an opposing effect of class I HDACs, 1 and 3, compared to HDAC2 on miR-183 expression. Both HDAC1 and HDAC3 depletion triggered miR-183 repression, indicating non-redundant functions of class I HDAC family members in neuroblastoma. This also applies for the fourth HDAC I family member, HDAC8. We have previously shown that targeting of HDAC8 in neuroblastoma cells by small molecule inhibitors or RNAi inhibits proliferation and induces differentiation (55). However, neither selective small molecule inhibition of HDAC8 nor HDAC8 depletion affected miR-183 expression, indicating that miR-183 is not targeted by HDAC8, neither directly nor indirectly, in neuroblastoma cells. In line with these findings, the phenotype caused by enforced miR-183 expression clearly mimicked the HDAC2-depletion phenotype, namely, both induced apoptosis, but not the HDAC8-depletion phenotype, which was characterized by the initiation of differentiation (55). In addition to the class I HDACs, HDAC4 (class IIa), HDACs 6 and 10 (class IIb) as well as the sole class IV family member, HDAC11, were shown to either directly or indirectly influence miR-183 expression in the opposite direction to HDAC2. Together, these data indicate that the strong and permanent induction of miR-183 by pan-HDACi treatment is caused by the enzymatic blockage of HDAC2, and that HDAC2 blockage overrides the miR-183 repression triggered by the inhibition of the other HDACs. Further, we demonstrate that MYCN is an important player in recruiting HDAC2 to the miR-183 promoter region. Previous studies in neuroblastoma cells have shown that MYCN recruits HDACs to promoter sites of target genes to silence their expression. A co-recruitment of HDAC2 and MYCN to the CCNG2 gene promoter has been described, and siRNA-mediated HDAC2 or MYCN knockdown or HDACi treatment reversed CCNG2 transcriptional repression (38), in line with our results for miR-183. A MYCN autoregulatory circuit has also been shown to involve recruitment of HDAC2 to the MYCN promoter region (56). These findings suggest that recruiting HDAC2 may be a common mechanism by which MYCN exerts its oncogenic properties in neuroblastoma cells. A similar regulatory mechanism exerted by MYCN has been shown for another HDAC as well. MYCN has been reported to recruit HDAC1 to the TG2, TRKA and p75NTR promoters in neuroblastoma cells (57,58).
Treatment with pan-HDACi not only blocks HDAC2 activity but also reduces MYCN protein levels (19), thereby decreasing HDAC2 recruitment to the miR-183 promoter and resulting in an additive induction of miR-183. Total induction is significantly higher in MYCN-amplified cell lines than in cell lines without MYCN amplifications, reflecting the inverse endogenous expression levels of MYCN and miR-183 and the transcriptional suppression mediated by HDAC2 and MYCN co-recruitment.
The quantitative discrepancies in miR-183 induction observed between HDAC inhibition by drugs and HDAC2 or MYCN knockdown are most likely due to the dual effects of HDAC inhibitors in neuroblastoma cells on both, HDAC activity and overall MYCN expression levels. They simultaneously inhibit the enzymatic activity of HDAC2 and suppress MYCN expression levels and thereby trigger miR-183 expression in parallel via the different regulatory mechanisms unravelled in this study. The HDAC2 and MYCN knockdown studies specifically target the individual protein levels without immediately affecting other regulatory mechanisms, although secondary effects, e.g. the reduced recruitment of HDAC2 to the miR-183 promoter site upon MYCN knockdown occur over time. Taken together, the quantitative discrepancies in miR-183 induction between small molecule HDAC inhibitors and HDAC2 or MYCN knockdown are most likely due to the broader spectrum of changes triggered by HDAC inhibitor treatment.
This study identifies miR-183 as a tumor suppressive miRNA in neuroblastoma cells, and unravels its transcriptional regulation by HDAC2 and MYCN. The understanding of the molecular mechanisms of this regulation supports the further development of targeted therapeutic intervention based upon HDAC inhibition in neuroblastoma patients, especially those with MYCN-amplified tumors. This approach would re-activate miR-183 expression in the tumor, triggering the cell intrinsic tumor suppressive properties.
ACCESSION NUMBERS
MicroRNA profiling data are available at the Gene Expression Omnibus (GEO) under the accession number GSE44538.
FUNDING
Bundesministerium für Bildung und Forschung (BMBF) (through NGFNplus to H.E.D., O.W., J.H.S. and F.W., the MYC-NET, CancerSys to F.W.); the European Union (FP7): ASSET (to F.W. and C.S.); the Research Foundation—Flanders (FWO) and German Cancer Research Center (DKFZ) (to F.P.); the University of Heidelberg (through the FRONTIER and OLYMPIA MORATA programs to H.E.D.); the Wilhelm Sander Foundation (to T.M. and I.O.); the Federal Ministry of Economics and Technology, Central Innovation Programme SME (ZIM) (to I.O.). Funding for open access charge: BMBF.
Conflict of interest statement. None declared.
ACKNOWLEDGEMENTS
We thank M. Sohn and J. Wünschel for excellent technical support, and Kathy Astrahantseff for comments on and editing of the manuscript. We thank the laboratory of Stefan Pfister (Division of Pediatric Neurooncology (B062), German Cancer Research Center (DKFZ), Heidelberg, Germany) for sequencing TP53 in Kelly cells and NB8 tumor spheres. We thank the microarray unit of the DKFZ Genomics and Proteomics Core Facility for their services.

Comments