


Abstract
MicroRNAs (miRNAs) are key regulators of cell-fate decisions in development and disease with a vast array of target interactions that can be investigated using computational approaches. For this study, we developed metaMIR, a combinatorial approach to identify miRNAs that co-regulate identified subsets of genes from a user-supplied list. We based metaMIR predictions on an improved dataset of human miRNA–target interactions, compiled using a machine-learning-based meta-analysis of established algorithms. Simultaneously, the inverse dataset of negative interactions not likely to occur was extracted to increase classifier performance, as measured using an expansive set of experimentally validated interactions from a variety of sources. In a second differential mode, candidate miRNAs are predicted by indicating genes to be targeted and others to be avoided to potentially increase specificity of results. As an example, we investigate the neural crest, a transient structure in vertebrate development where miRNAs play a pivotal role. Patterns of metaMIR-predicted miRNA regulation alone partially recapitulated functional relationships among genes, and separate differential analysis revealed miRNA candidates that would downregulate components implicated in cancer progression while not targeting tumour suppressors. Such an approach could aid in therapeutic application of miRNAs to reduce unintended effects. The utility is available at http://rna.informatik.uni-freiburg.de/metaMIR/.
INTRODUCTION
MicroRNAs (miRNAs) are evolutionarily conserved, short (∼22 nucleotide), non-coding segments of RNA involved in the regulation of mRNA transcript levels in the cell. To guide the experimental investigation of their complex networks in biology and biomedicine, numerous algorithms have been developed to predict interactions that may explain biological observations, or to identify candidates for study. These algorithms can include different principles for prediction, such as evolutionary conservation (1), free energy changes on RNA binding (2), and machine learning from high throughput experiments (3). Individual algorithm performance can be assessed by comparison of predictions to experimental data, for example correlation with gene expression fold changes (1), proteomics data (4), or crosslinking and immunoprecipitation (CLIP) with RNA binding proteins (3). These methods focus on 1:1 miRNA:target gene interactions. While most algorithms focus on predicting targets in the 3′ untranslated region of a transcript, functional target sites have also been identified in protein coding regions (5,6).
To improve miRNA–target prediction, previous studies have incorporated results from multiple algorithms, including miRecords (7), mirDIP (8), starBase (9), miRror 2.0 (10). miRWalk 2.0 (11) and ComiRNet (12). Some are portals for visualisation of results from individual algorithms, with the user choosing which algorithms to incorporate. Given disparities in performance of the algorithms, such an unguided approach may lead to inappropriate or incomplete conclusions. Alternatively, as in the case of ensemble methods, the application of integrated algorithms (combination by weighted averaging or machine learning) can supersede the merits of the individual constituents (10,13). Beyond single targets, multiple target analyses are possible, for example with Diana miRPath (14) whereby miRNA involvement in defined biological pathways can be investigated. Another, ComiRNet (12), provides flexible target input, however is based on machine learning integration of multiple algorithms spanning a wide number of years, and uses a single source of validated positive interactions (a publication mining utility, miRTarBase (15)).
Current tools have focused only on identification and use of positive miRNA:mRNA target interactions. While these are of primary interest, information regarding biological processes is also to be found in transcripts not targeted by a given miRNA. Such an application would allow the guided refinement of predictions from the hundreds of mRNAs that may be returned for a single miRNA, or to investigate functional specificity, where a miRNA may be involved in regulation of groups of genes in one tissue region while not in another. The negative predictive data are discernible from interactions not predicted by multiple algorithms; however, a condition is that the datasets be derived from comparable sources. For example, if comparing datasets compiled across a decade, absence of an interaction in an older set may not be meaningful of non-prediction by that algorithm's hypotheses, but only that a miRNA had not yet been reported.
In the present analysis, we developed metaMIR to provide an alternative tool to make greater use of the existence of multiple established prediction algorithms, by using explicitly the negative prediction data. By restricting the time frame of algorithms under consideration, in conjunction with experimentally-validated positive and negative miRNA:target interactions from a range of sources, we generate a new set of 1:1 prediction data, used in a combinatorial analysis of all possible subsets of arbitrary sets of human genes. Moreover, metaMIR enables an even more detailed investigation by identifying miRNAs that target one group while not targeting another group of user-defined genes. To exemplify the benefit of our approach in the research of miRNA co-regulation, we performed a focused study on targets relevant to the neural crest.
The neural crest represents a transient stage in vertebrate neural development that sees the generation of a multipotent, highly migratory cell population that will ultimately give rise to such diverse structures as peripheral nerves, melanocytes, cartilage, and bone (16). An intricate network of transcription factors is involved in progression of neural crest development through stages of neural plate border (NPB) formation, neural crest specification (NCS), epithelial to mesenchymal transition (EMT), and emergence of migratory neural crest (MNC) populations, reviewed for example in (17–19). The Hippo/YAP signalling pathway is a separate kinase cascade that has been implicated in regulation of neural crest progression (20–22). The normal process of EMT in the neural crest parallels that which can occur during tumour progression, utilizing the same molecular mechanisms, demonstrating the relevance of understanding of this tissue to human systems. Transforming growth factor beta (TGFβ) (23) and Wnt (24) signalling are examples of two pathways involved in the normal development of neural crest, which give rise to cancers when inappropriately activated.
A critical role of miRNAs in the neural crest was demonstrated through tissue-specific repression of Dicer, a key miRNA-processing protein (25), knockdown of which disrupts expression of most miRNAs. Also, given their concomitant perturbation of mRNA activity during the development of human pathologies, miRNAs have also been explored as therapeutic targets (26–28), although RNA-based applications (short interfering- or miRNA) still suffer from complications due to off-target or unintended effects. As an example case, then, the present analysis was applied to investigate potential miRNA-mediated links in a tissue system not readily accessible in complete human models, between signalling pathways (Hippo/YAP) and neural crest development, and the targeting of neural crest genes with pathways (TGFβ and Wnt) implicated in tumor progression.
For the first time, we provide a computational solution to the aforementioned problems. We applied multiple machine-learning approaches to combine prediction results from several state-of-the-art miRNA:target prediction algorithms into a single reference set of interactions to improve targeting information, and in training of the model, we use experimentally validated miRNA interactions from multiple sources. We then established a method to assess all potential combinations and subset combinations of a given gene list, and we include negative data, interactions to permit refinement of results to exclude candidates that would simultaneously have undesired targets. The resulting bioinformatics tool, metaMIR, is presented for broad usability as a webserver and for developers as a standalone, command-line tool, and the code is made available on a public, source-code distribution platform. To highlight the application of metaMIR, we investigated the impact of miRNA regulation in signalling and neural development pathways. In particular, we identified candidate miRNAs co-regulating Hippo/YAP and neural crest development and malignancies resulting from disruption of neural crest-related TGFβ signals.
MATERIALS AND METHODS
Data from established miRNA–target prediction algorithms
Available datasets of human miRNA:target gene interactions, as computed by established miRNA–target prediction algorithms, published or otherwise updated between January 2013 and March 2016, were downloaded as flat files from their respective webhosts. These were: Diana microT-CDS (September 2013 release) (29), miRmap (version 201301) (2), MIRZA-G (with seed and no-seed requirement) (30), miRTarget3 (August 2014, via miRDB v5.0 server) (3), PACCMIT-CDS (31) and TargetScan v7.0 (with conserved, and non-conserved targets) (1). As reported, PACCMIT-CDS was applied to only the coding sequences, Diana microT-CDS was applied to both coding sequences and 3′-UTRs, and the remainder were applied only to 3′-UTR regions of mRNAs. For comparison with our result, an alternative integrated ensemble database of interactions from ComiRNet (12) was downloaded for performance analysis.
Experimentally validated miRNA–gene interactions
The following classes of experimentally validated miRNA–gene interactions in human systems, most from high-throughput experimental protocols, were used to score and train the model that we subsequently applied to the union set of all miRNA–gene pairs in the input datasets to generate our comprehensive reference set of interactions. Given the variety of experimental data, the model is designed to classify whether a miRNA targets a gene or not, rather than to predict the magnitude of fold changes upon interaction. Although exceptions are known to exist, this classification task is based on the assumption that miRNA targeting of genes will lead to fold-change decreases in gene/protein expression. Thus in the experimentally-validated interaction datasets, fold-change decreases in expression are taken to indicate direct miRNA targeting and fold-change increases in target expression are taken as an indication of indirect or negative targeting by the miRNA in the corresponding experiment. Fold changes in expression of zero were not used as a measure of negative interaction due to uncertainty as to the reason behind lack of observed change, such as probe design or endogenously low expression in the system that was used.
Aggregate databases
miRTarBase v6.1 (15 September 2015 release) (15) and Tarbase v6.0 (32) were downloaded and merged into a single set. MirTarBase data were limited to ‘strong’ evidence (reporter assay, western blot, qPCR) for positive interactions (miRNA–gene pairs with evidence for an interaction) and all negative interactions (miRNA–gene pairs with evidence for no interaction) were retained. Conflicting miRNA–gene pairs were removed. Tarbase data were similarly treated, with positive interactions restricted to strong evidence (by MirTarBase definition), inclusion of all negative interactions, and conflicts were removed. In cases of conflict between the two databases, MirTarBase data were used, as its data were more recently updated. The result was 5,028 positive and 647 negative interactions.
Gene-expression data
the standard references of gene-expression analysis by microarray performed by Linsley (33) and Grimson (34) were processed from the normalised data of the corresponding GEO series files, retrieved using GEOquery (35) and processed using limma (36) from the R Bioconductor package, retaining only probes with expression levels above the median level. For classification, gene-expression decreases of 1.5 were labeled positive and expression increases of 1.5-fold or greater labelled as negative for the miRNA-overexpression studies (see Supplemental Data, MS Excel file worksheet 1 for sample IDs). We obtained 5,289 positive and 4,000 negative interactions.
Proteomics data
data from experiments of miRNA overexpression were collected from 10 studies covering 13 miRNAs (see Supplemental Data, MS Excel file worksheet 2 for source references). Gene names were derived from supplied information or gene/transcript IDs when provided. All data were included with the only filtering for false-discovery-rate–corrected P values (<0.05) when data were available. For classification, a relaxed threshold of fold-change decreases and increases >25% for the miRNA overexpression experiments was used to label interactions as positive and negative, respectively. This resulted in 1,994 positive and 1,585 negative interactions.
Dual-miRNA modulation
GEO data from experiments in which miRNAs were overexpressed and knocked down in the same study were obtained and the normalized data processed as for the regular gene-expression data (37–40). Genes above median expression were assessed for directionality of change of gene expression; genes simultaneously showing an expression decrease of at least 25% on overexpression and 25% increase upon miRNA knockdown were classified as positive. Negative classified genes were those opposite (increase gene expression upon miRNA overexpression, decrease on miRNA knockdown). From these data, we derived 2,362 positive and 1,556 negative interactions.
CLIP*
crosslinking and immunoprecipitation data were restricted to experiments in which there was unambiguous identification of the miRNA involved in binding. Data from CLASH (crosslinking ligation and sequencing of hybrids) (41), target identification from reanalysis of previous CLIP data for hybrids and chemically modified miRNAs (42) and Ago (miR-CLIP) (43) were downloaded and gene identifiers unified. Interactions detected in the hybrid experiments were classed positive, and negative interactions were inferred by random combination of detected transcripts and miRNAs. In the chemically-modified miR-CLIP data, only interactions with >200 reads for experimental and control samples were assessed. Among these, fold-change increases >1.8 in detected reads were classified as positive, while those in the range of 0.9 and 1.1 were classified as negative. All CLIP datasets were obtained from the supplementary files of the corresponding publications and the described processing resulted in 17,564 positive and 18,566 negative interactions.
Unification of identifiers from various sources
Gene symbols, Ensembl IDs and Refseq IDs were converted to Ensembl associated gene names using conversion tables derived from Ensembl BioMart downloads (Ensembl Genes 83, GRCh38.p5) (44), and UniProt Knowledge Base (www.uniprot.org) (45). GeneIDs (Entrez) were converted using data downloaded from the HUGO Gene Name Consortium (HGNC, http://www.genenames.org) (46). For miRNA data, miRBase v20 was used, obtained from http://mirbase.org (47). Gene and miRNA IDs that had been deprecated or could otherwise not be unambiguously mapped were removed from consideration.
Generating a reference set of complete human miRNA–gene interactions
The identification of regulating miRNA for an arbitrary set of human genes requires miRNA targeting information that is complete, that is, involves all annotated human miRNAs and other genes. For this reason, we cannot use the set of experimentally validated interactions but require predictions for the full set of genes. Analysis of established algorithms showed that their ability to identify accurately miRNA:target pairs depended on the source of experimental data used for validation. To avoid selecting a single algorithm and to create a more comprehensive set of interaction data, we integrated all prediction results into a single reference table using a machine-learning–based approach.
Setting up the classification task
To combine results from all prediction algorithms, we first had to train a model to learn the probability of interaction from all raw scores given by each algorithm. Only miRNA–gene pairs with experimental evidence for an interaction were used to train and test models where the experimental evidence was used to label each interaction as positive or negative. Here, the raw scores for all selected prediction algorithms are used as the features, i.e. predictors. We performed a comparison of the input algorithms to assess their degree of information overlap. Of these inputs, TargetScan and MIRZA have different variants, which were considered separately. Since the MIRZA variants (seed and no-seed) showed considerable overlap of content, their data were merged into a single feature, while the less-correlated TargetScan variants (conserved and non-conserved) were kept as separate features. For all algorithms, when predictions were missing, values were set to below their respective ‘worst’ score to represent a non-prediction. The table resulting from the merging of all feature data with available experimentally validated interaction data contains 20 350 positive and 12 970 negative miRNA–gene interaction pairs.
Building the predictive model
To address the class imbalance (significantly more positive interaction data are available than negative), and to prevent over-representation of single data sources (for example the CLIP dataset contributing many more data points for training than the proteomics set), a combination of over- and undersampling was employed (see Supplemental Data). For each of the five classes of experimental validation, overrepresented types (positive) were undersampled and underrepresented types were oversampled to achieve an equivalent proportion. These data were split 70/30 into training and test sets. Multiple, machine-learning algorithms were assessed for training of the model (see Supplemental Data, Figure S3). Based on their performance measured using the test-set data (unseen during training) the two best models (gradient boosting machine and k-nearest neighbours models), indistinguishable in terms of performance, were selected and combined to create a single final classification model by averaging classification probabilities (see Supplemental Data for further details).
Generation of the reference set of miRNA–gene interactions
The above model was applied to the union set of all miRNA–gene combinations contained in the established algorithms to predict class probabilities (positive or negative). We assigned miRNA–gene interactions into positive (positive class probability > 0.75) and negative (positive class probability < 0.30) labels. These data define the reference table used in the subsequent analyses.
MetaMIR: identifying miRNAs that co-regulate sets of arbitrary input genes
Given a set of genes, we developed an approach to identify individual miRNAs that co-regulate a subset of the input genes. In the following, we describe the combinatorial approach applied to the identification of high-scoring subsets of target genes.
Combinatorial analysis to predict miRNA co-regulation
To identify subsets of co-regulated genes, we set up the following scoring system for the targeting of each subset of genes (subsequently referred to as ‘gene cluster’) by every miRNA in our dataset. The top-scoring, miRNA–gene-cluster pairs are reported.
First, we computed the raw score Sraw, which is the geometric mean of each miRNA–gene score from the reference table. Random sampling of combinations of genes from the reference table described in this study revealed some dependency of the distribution of Sraw on the identity of the miRNA and on the number of genes comprising a target cluster under consideration (see Supplemental Data, Figure S4).
Fitting was performed using the maximum-likelihood estimation in the fitdist function from the R fitdistrplus package.
Limiting the number of analysed gene sets
MetaMIR generates rankings of predicted miRNA interactions with clusters of genes through analysis of all possible combinations of a given list. The limit of 25 genes for a single analysis—which can be further reduced as an input parameter if required—was empirically chosen for two reasons. First, the computational expense of gene lists increases exponentially ((2N – 1) × 2,578 miRNAs, where N is the number of genes); therefore, the number of genes was limited to 25 to permit general use of the script without need for excessive resources. Second, it was chosen as a reasonable compromise to reduce noise since longer lists will generate many highly-scoring, small target clusters, while still yielding combinations of potential interest.
In-silico evaluation of metaMIR performance
Simulations were used to assess the performance of metaMIR, as experimental validation data are based on 1:1 miRNA:gene-target interactions, rather than miRNA:gene-clusters. The analysis compared results between gene sets drawn at random from the complete set of genes in the reference table, and simulated random sets of genes where a common experimentally-validated miRNA interaction has been reported.
To achieve the latter goal of generating sets of pseudo ‘positive’ miRNA:gene-clusters, the set of experimentally-validated interactions was used. A miRNA from the collation of all data across all sources was drawn at random and the list of genes demonstrated to be targets of that miRNA was compiled. Genes were then drawn at random from this pool at varying analysis sizes and final adjusted scores compared to accordingly-sized random analyses as well as assessing the ability of the analysis to recover the original miRNA used to generate the set.
Usage of metaMIR
Depending on the investigation, metaMIR can be run in a positive (default) or a differential mode of operation. Both modes require a list of gene names in HUGO Gene Nomenclature Committee (HGNC) format. Additional parameters that can be set are maxclust (the maximum cluster size, or maximum number of genes to be analysed simultaneously), mincomb (the minimum cluster size to return in the analysis), and Zthreshold (only miRNA–gene clusters with scores greater than this threshold are returned). The positive mode (default) takes a list of genes and returns a list of miRNAs, ranked according to the Sadj score (Equation 4) with the corresponding gene cluster the miRNA is predicted to target. Input genes can be prefixed with an asterisk to mark those of particular interest, such that miRNAs will be removed whose best combination does not contain at least one. In the differential mode, gene names can be prefixed with a minus sign to indicate those specifically not to be targeted by the returned miRNA. This input list requires both positive (no prefix) and negative (prefixed by a minus sign) gene targets. In this case (differential), the analysis on the minus-sign-prefixed genes is performed as for the normal analysis, but the prediction scores are drawn from the negative score table, rather than the positive-prediction score table. The final adjusted score returned for any miRNA is the sum of the positive (miRNA predicted to target genes from the list where targeting is sought) and negative scores (the same miRNA is predicted not to target genes in the minus-sign-prefixed list). For both modes of operation, if the input gene list is longer than the maximum cluster size (the default of 25 or a user-specified value, maxclust) and thus requires partitioning into analysable chunks, the nearest-neighbour clustering results are also written to a text file, in a format suitable for network import to Cytoscape (49). For developers, metaMIR is written in the R programming environment (v3.2), running in the RStudio IDE (v0.99) available from http://www.rstudio.com.
RESULTS AND DISCUSSION
The benefit of integrating several miRNA–target prediction algorithms
As the first stage of the development of metaMIR, we sought to more fully exploit the potential of integrating multiple prediction algorithms into a single set by extracting both the positive and negative interaction predictions. Previous methods miRNA prediction relying on analysis of established algorithms have included the direct presentation of prediction results of other methods in a panel (7,11) or integration of these results by directed (10) or heuristic approaches (50,51). To avoid potential bias of a pre-defined combination or weighting, we adopted an empirical heuristic approach with supervised learning to determine a suitable combination of the established algorithms.
We first assessed the degree of pairwise correlation overlap among the established miRNA prediction algorithms to confirm that they contribute different data to the integrated ensemble (Supplementary Figure S1) and that they demonstrate different performance depending on the source of validated experimental data against which they are compared (Supplementary Figure S2). Following the machine-learning approach described in the methods (detailed results in Supplementary Figure S3), we combined the predictions of the separate input algorithms into a single prediction to generate our reference set of miRNA–gene interactions. A hallmark of our method is that the final prediction scores are trained on both positive and negative interactions derived from five different sources of experimental verification: high-throughput, genome-wide experiments and the public databases, Tarbase and miRTarBase. This means that the final scores can be separated into positive and negative predictions to denote interactions predicted to occur or not occur, respectively (Supplementary Figure S4). We empirically determined a parametric model (beta distribution) to characterise the random score distributions (Supplementary Figures S5, and S6).
We compared our resulting reference set of positive and negative interactions with the individual target-prediction algorithms separately across the different sources of experimentally validated miRNA–gene interaction data (Figure 1). In the first comparison, we analysed the positive reference dataset (those interactions predicted to occur) against the datasets computed by the original algorithms using only data unseen by our model during training (Figure 1A). Generally, some improvement was observed for the sensitivity (or true positive rate) and the specificity (or true negative rate). Calculation of an aggregate metric, here the Youden Index, which simultaneously incorporates sensitivity and specificity considerations, reveals a marked increase in the performance of our integrated reference set over the original miRNA–target prediction tools. The alternative ensemble method, ComiRNet, displayed higher sensitivity, but lower specificity, also reflected in lower values of Youden's index. These results are further illustrated by the receiver operating characteristic curve plot (Figure 1B) where only classification from the unseen publication databases were used. As expected, for the intended task of classification, the positive reference set outperforms the input datasets, as well as the other ComiRNet ensemble dataset, as indicated by the increased area under its ROC. The negative dataset demonstrates similarly high performance quality (red curve, Figure 1B) in its lower ROC AUC and separation from the diagonal line of random prediction. Summary statistics of the input and resulting data tables are provided in Table 1, which illustrate the similarity of miRNA and target-gene coverage among the various prediction tools and our resulting positive and negative reference set.
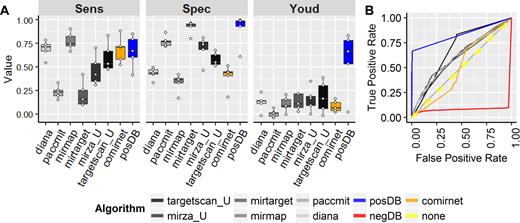
The combined miRNA–target reference dataset demonstrates performance improvements in classification over input prediction algorithms. (A) The sensitivity, specificity, and Youden index (simultaneous consideration of sensitivity and specificity) were compared for the reference miRNA–target dataset against individual input algorithms using only data unseen during training. Points overlaid on boxplots indicate the individual values for each of the five separate validation sources (aggregate publication, expression, proteomics, dual modulation, and CLIP) . (B) Plotting of the receiver operating characteristic curves for the unseen publication database validated targets reveals the improved classification of the positive (blue) and negative (red) predictions of the new method compared to the individual, and alternative integrated (ComiRNet) predictions.
Summary statistics of counts for input and generated data tables
| Data table | Genes | miRNAs | Interactions |
|---|---|---|---|
| targetscan_U | 18 463 | 2546 | 9 562 756 |
| mirza_U | 16 709 | 2571 | 5 713 454 |
| mirtarget | 17 266 | 2562 | 922 161 |
| mirmap | 18 283 | 2038 | 9 982 472 |
| paccmit | 15 641 | 1914 | 3 571 572 |
| diana | 18 348 | 1916 | 7 077 345 |
| posDB | 19 344 | 2578 | 6 554 296 |
| negDB | 19 316 | 2578 | 5 433 925 |
MetaMIR identifies miRNA–gene-cluster interactions above random selection in silico
The aim of the study is the identification of putative miRNA candidates that will simultaneously target multiple genes. The metaMIR module analyses all possible subset combinations of a provided gene list to yield a score per gene cluster, where the miRNA is predicted to interact with all members of the subset. We exploited the improved classification performance of our reference set of miRNA–gene interactions to serve as the basis for identifying and scoring probable miRNA–gene-cluster co-regulation. In the absence of a database of experimentally validated miRNA–gene-cluster interactions the performance of the combinatorial analysis was assessed in silico by applying the established approach of comparing against randomised results. The results of metaMIR for simulated gene clusters or sets where a miRNA is known to interact with all member genes (see Methods for further details) were compared to those obtained from purely random selections (Figure 2).
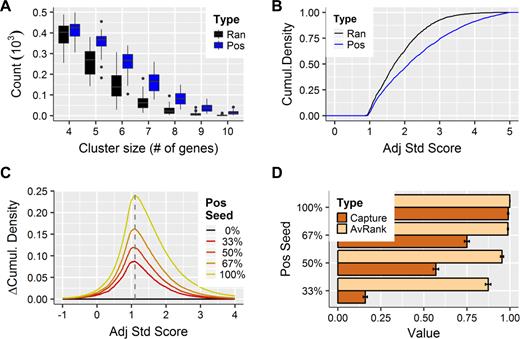
The combinatorial metaMIR analysis extracts miRNA candidates above random levels. Genes were selected randomly from the entire pool of genes in the miRNA–target reference set (Ran) or from the experimentally validated data (Pos), where, in the latter case, it is expected that a miRNA should co-regulate the random selection of genes. (A) A difference is observed in the count of miRNA–gene-cluster sets returned in the Pos versus the Ran analyses. At smaller cluster sizes, the counts are similar, but with increasing set sizes, many fewer co-regulated clusters are found in the random data. (B) Cumulative distribution plots of the final adjusted standardised scores (Sadj, Equation 4) illustrate the increase in performance above random gene selections, with higher scores returned for the positive, over the random analysis. (C) The analysis was repeated using mixed lists, where only a percentage of the gene list (Pos Seed) was derived from the Pos set and the rest were random selections. Even at 33%, scores can be distinguished from those of the purely random and the maximum difference occurs at a score threshold of 1.1. (D) MetaMIR is blinded to the miRNA used in the generation of the random sets. In each analysis, the source miRNA was recovered in the results; its mean rank (AvRank) decreased slightly as the proportion of the seed decreased. Capture of this miRNA among the top 10 candidates returned is poor at lower seeding, as its score may be overtaken by clusters of a size similar to the seed (five genes) found at random.
The first analysis was to determine the number of co-regulated miRNA–gene-clusters predicted by the metaMIR algorithm for randomly selected gene sets in comparison to positive gene sets (co-regulating miRNA should exist according to our experimental benchmark data, Figure 2A). Across 900 such analyses (450 each positive and random), a considerable difference in the count of non-zero–scoring miRNAs was observed, with many more in the positive relative to the random set. The counts are more similar for smaller gene clusters, illustrating the increased likelihood of randomly identifying small gene sets (here four or five) for which any common miRNA can be predicted. However, as the number of genes of the cluster increases, the number of clusters identified at random decreases relative to those where a miRNA is known to co-regulate the cluster members. This result suggests that for analyses of longer gene lists, the frequency of finding smaller cluster subsets completely at random can be comparable to that of a real (positive) miRNA–gene–cluster interaction.
To address this effect, the obtained scores were adjusted according to the probability from the hypergeometric distribution (see Equations 3 and 4 in Methods). Doing so allowed for adjustment of the beta distribution standardized scores by incorporating the number of genes predicted to be targeted by a given miRNA, how many genes were under analysis, and the number of genes occurring in the identified cluster. Cumulative distribution plots of the scores obtained for the positive versus the random analyses show a clear distinction using this adjustment (Figure 2B). Adjusted scores across all cluster sizes tend to be higher for the positive set.
As a more comprehensive investigation of the algorithm performance, mixed lists of genes were also analysed. In this case, a list was comprised of a seed of genes known to be targeted (as in the positive gene sets) ranging from 0 to 100% with the remaining genes padded from random sampling. Differences in the cumulative distribution of the adjusted standard scores are observed as low as 33% of positive seed with the maximum difference observed at a Z-threshold of 1.1 (Figure 2C). There is a clear separation in score from purely random selections for all categories of positive seeds. This distinction from random sampling indicates that metaMIR is robust to input lists that contain genes not targeted by miRNAs.
During the generation of the mixed lists, the miRNA used to generate the positive seed of genes was tracked, although metaMIR remained blinded to its identity. The recovery of the seeding miRNA was assessed (Figure 2D). Over the mixed assays, the majority (399 of 400) returned the correct seeding miRNA in the final result table. The mean rank percentiles (AvRank, Figure 2D) of the seeding miRNAs among those returned ranged from a high of 0.999 to a low of 0.873 in the 100% and 33% positive seed analyses respectively. Performance decreased more significantly with the proportion of known miRNA (seed) targeting the analysed gene set when counting the percentage of the seeding miRNA captured among the top 10 miRNAs returned over all analysed gene sets (Capture, Figure 2D): ranging from 91% in the 100% seed analysis to 11% in the 33% seed. It is noteworthy that at the lowest seed category (33% of a gene-set size of 15), the number of known gene targets is on par with the modal gene-cluster size that returns the most abundant random results (Figure 2A), suggesting that other random clusters of the same size may have overwhelmed the detection of the source miRNA.
Clustering genes according to miRNA targeting partially recovers functional associations
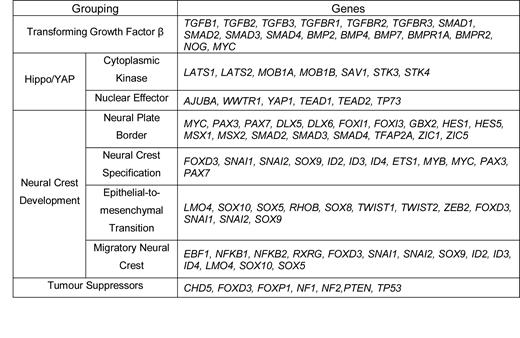
When processing long input gene lists, metaMIR divides the set into smaller subsets for analysis using a gene distance we introduced in Equation 5 (see Methods) that considers all (predicted) miRNA interactors of both genes. Here we determine the suitability of our proposed gene-distance measure by investigating potential co-regulation between the Hippo/YAP signalling pathway and neural crest development. Both pathways have small, well-defined sets of genes to decrease potential noise from larger analyses; genes used in the analysis are indicated in Table 2. The genes in the Hippo/YAP pathway were separated into cytoplasmic kinases and nuclear effectors (Figure 3A) and each group was clustered together with genes from the four different stages of neural crest development based on the pairwise gene distance that solely considers common miRNA targeting. Results show that the two gene groups of the Hippo/YAP signalling pathway roughly cluster together (Figure 3B and C). Among the cytoplasmic kinases, the key STK3/4 genes are separated from the bulk of the remaining elements, suggesting miRNA-based co-regulation with differing stages of neural crest development. In the group of nuclear effectors, all genes are more tightly clustered. A more expansive investigation of other neural development signalling pathways and molecules demonstrated a similar partial recapitulation of functional protein networks solely from the use of miRNA prediction data as in this study (Supplementary Figure S7).
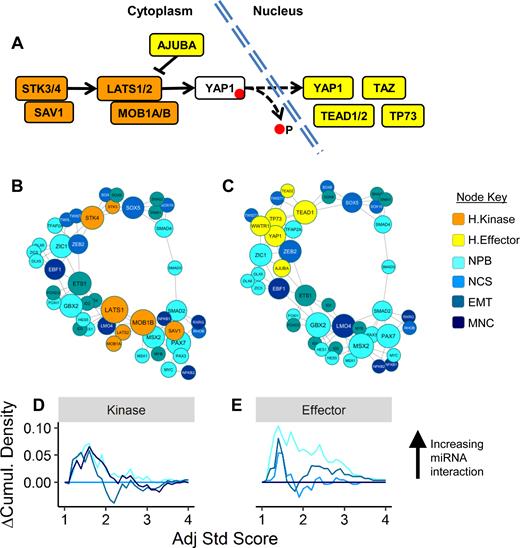
Hippo effector YAP reveals clustering with pre-migratory stages of neural crest development. Analysis of Hippo signalling pathway components, divided into cytoplasmic kinases and nuclear effectors (A) was performed via metaMIR with stages of neural crest development. Grouping of the kinase components (B) is less compact than that of the effectors (C). The resulting scores show less discrimination among the neural crest stages with the Hippo kinases (D), but show a clear trend towards higher scores between effectors including YAP and the neural plate border (NPB) and epithelial-to-mesenchymal transition (EMT) genes (E). Neural crest specifiers (NCS) and genes associated with migratory neural crest (MNC) produced the lowest results.
Groupings of genes used for analysis. Note that WWTR1 of the Hippo/YAP nuclear effectors is a synonym for TAZ
 |
|
|
|
Comparisons of the cumulative distribution plots of the resulting metaMIR scores for the kinase analysis showed moderate collective increased association with NPB, NCS and MNC (relative to the weakest scores for EMT). In contrast, the effectors demonstrated a much clearer link first to NPB, followed by EMT and NCS relative to MNC. See Table 2 for the full names of the neural crest development stages. The results of the metaMIR analysis are presented in Table 3.
Top 10 miRNAs returned from analyses of Hippo effectors with neural crest gene sets
| Hippo effectors plus neural plate border | |||
| miRNA | Group | Score | Combination |
| hsa-miR-8085 | 10 | 4.613 | AJUBA, DLX6, MSX2, SMAD2, SMAD3, TEAD1, TFAP2A, TP73, WWTR1, ZIC1 |
| hsa-miR-550a-5p | 10 | 4.079 | AJUBA, FOXI1, MSX2, PAX3, SMAD2, SMAD3, SMAD4, TP73, WWTR1, YAP1 |
| hsa-miR-6760–5p | 9 | 3.745 | AJUBA, DLX6, MSX2, SMAD3, TEAD1, TFAP2A, TP73, YAP1, ZIC1 |
| hsa-miR-7113–5p | 8 | 3.481 | MSX2, PAX7, SMAD3, SMAD4, TEAD1, TEAD2, TFAP2A, YAP1 |
| hsa-miR-3183 | 10 | 3.430 | AJUBA, MSX1, MSX2, PAX7, SMAD2, SMAD3, SMAD4, TEAD1, TP73, ZIC1 |
| hsa-miR-550a-3–5p | 9 | 3.386 | AJUBA, MSX2, PAX3, SMAD2, SMAD3, SMAD4, TP73, WWTR1, YAP1 |
| hsa-miR-203b-3p | 9 | 3.301 | AJUBA, MSX1, PAX3, SMAD2, SMAD4, TFAP2A, TP73, YAP1, ZIC1 |
| hsa-miR-193a-3p | 9 | 3.300 | AJUBA, HES1, PAX7, SMAD2, SMAD4, TEAD1, WWTR1, YAP1, ZIC5 |
| hsa-miR-193b-3p | 9 | 3.195 | AJUBA, HES1, MSX2,PAX7,SMAD2,SMAD3,WWTR1,YAP1,ZIC5 |
| hsa-miR-4715–5p | 8 | 3.156 | AJUBA,HES1,PAX7,SMAD2,SMAD3,WWTR1,ZIC1,ZIC5 |
| Hippo Effectors plus Epithelial-to-Mesenchymal Transition | |||
| miRNA | Group | Score | Combination |
| hsa-miR-636 | 10 | 4.255 | AJUBA, LMO4, SNAI1, SNAI2, SOX5, SOX9, TEAD1, TWIST1, TWIST2, YAP1 |
| hsa-miR-4660 | 11 | 3.611 | FOXD3, LMO4, SNAI2, SOX10, SOX5, SOX8, SOX9, TEAD1, TP73, YAP1, ZEB2 |
| hsa-miR-4313 | 9 | 3.469 | SNAI1, SOX10, SOX8, TEAD1, TP73, TWIST1, TWIST2, YAP1, ZEB2 |
| hsa-miR-548aq-3p | 11 | 3.386 | LMO4, RHOB, SNAI2, SOX10, SOX5, TEAD1, TP73, TWIST1, WWTR1, YAP1, ZEB2 |
| hsa-miR-1273h-5p | 9 | 3.168 | AJUBA, LMO4, RHOB, SOX10, SOX5, SOX9, TEAD1, TP73, ZEB2 |
| hsa-miR-138–5p | 10 | 2.949 | AJUBA, FOXD3, SOX5, SOX8, SOX9, TEAD1, TEAD2, TP73, YAP1, ZEB2 |
| hsa-miR-6797–5p | 9 | 2.940 | AJUBA, RHOB, SNAI1, SOX10, SOX5, SOX8, SOX9,TEAD2, TP73 |
| hsa-miR-141–3p | 9 | 2.926 | LMO4, SOX5, SOX9, TEAD1, TP73, TWIST2, WWTR1, YAP1, ZEB2 |
| hsa-miR-6738–5p | 7 | 2.779 | RHOB, SNAI1, SOX10, SOX8, TEAD1, TEAD2, TP73 |
| hsa-miR-361–3p | 9 | 2.766 | AJUBA, FOXD3, LMO4, RHOB, SNAI1, SOX8, TEAD2, TP73, YAP1 |
Although gene distance measures or clustering were not primary aims of the study, these analyses were performed to explore the potential information available from miRNA prediction. The Hippo/YAP signalling pathway and its role in development of neural crest was examined remain an active domain of research (21,52,53). The clustering results suggestive of miRNA-mediated co-regulation, are consistent with experimental observations that the effector side of the pathway, related to nuclear localisation and thus transcriptional co-activity of YAP and TAZ (also known as WWTR1), are closely associated with early stages of neural crest development as demonstrated in model organisms (20,52) and human embryonic stem cell-derived systems (21). The observation in this example is of particular note, given that many of the elements of the pathways investigated are kinases, whose regulation operates on a much faster time scale than that of transcript-expression (or post-transcriptional) regulation.
The miRNAs returned in this example case have not been extensively studied, as evinced by a lack of published data. Inferences regarding further validity of the candidates returned in the analysis are thus not possible. Of those which have been studied, miRs –203 (54,55), –193 (56) and –636 (57) have described tumor suppressor functions, consistent with the metaMIR-predicted targeting of the oncogene YAP. Another prominent candidate returned in the metaMIR analysis, miR-550a, however, is typically upregulated in cancers (58), which could point to differing mechanisms of action, independently of the genes used in the present study.
Use case: metaMIR analysis recovers miRNAs involved in cancer
To simulate a possible use case of metaMIR, we applied it to components of the TGFβ signalling pathway, which is also in the domain of neural/neural crest development. The list of molecules selected for analysis was restricted to those with some connection to neural crest (see Table 2 for the full list). Here we demonstrate the full power of the differential mode where the input gene list contains genes for which targeting miRNAs are sought, and those not to be targeted by the same candidate. In a hypothetical application to mitigation of TGFβ upregulation, as occurs in some cancers (23,59,60), the analysis was performed first to target members of the pathway while avoiding related tumor suppressors, and then in reverse, targeting the suppressors while avoiding the pathway. In both instances, metaMIR was run with the input parameters of max. cluster size 20 and a Z threshold 1.1 and the results are summarised in Figure 4. In the former case, hsa-miR-302a-5p was returned as the top-scoring hit (of 17 miRNAs found), predicted to target 7 members of the TGFβ and BMP signalling pathways, while not targeting the NF1 and TP53 tumour suppressors. In the reverse case, only a single candidate, hsa-miR-130a-3p, was returned, which is predicted to target the majority (6 of 7) tumour suppressors included, while not targeting key mediators (ligands and receptors) of TGFβ and BMP signalling. The results are consistent with experimental observations of miR-302 (61) inhibition of progression of some cancers, and higher expression of miR-130 (62) in cancerous states.
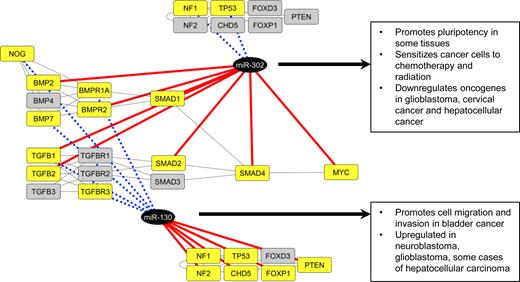
Differential metaMIR analysis recovers miRNAs involved in cancer. The TGFβ signalling pathway exerts both tumour-suppressive effects during early stages of tumorigenesis and increased activity at later stages of development and progression, for example in neuroblastoma. A potential therapeutic approach addressing this later-stage upregulation of activity based on miRNAs would see the targeting of pathway components, while avoiding the targeting of tumor suppressors. In this positive analysis, hsa-miR-302a-5p is returned as the top-scoring candidate, predicted to target multiple members of the pathway from ligands to effectors, while not targeting the tumor suppressors NF1 and TP53. In contrast, the negative search to downregulate the suppressors while not targeting TGFβ returned hsa-miR-130a-3p as the sole candidate to fit within the targeting constraints. Targeted or non-targeted genes are highlighted in yellow, with targeting interactions depicted by red lines, non-targeting by dotted blue lines.
The study of mechanisms of cancer development and miRNA involvement is complex, and the current study is, of course, not intended to be a comprehensive treatise on the subject. Nevertheless, we present an example investigation of how the unique targeting/non-targeting gene selection mode of metaMIR may be employed to identify candidates for further experimental study. Aside from providing insight into the mechanisms of tumorigenesis and disease progression, miRNAs have also been investigated as potential therapeutic agents, to correct multiple gene irregularities via a single target (27,63). The examination of TGFβ components uncovered a candidate, miR-302, that has been confirmed to reduce tumour effects (61,64). A repeat of the analysis without the exclusion of the tumor suppressors also returns this miRNA, however its rank is outside of the top 20 hits, demonstrating that the specification of tumour suppressors not to be targeted increased its rank. Without consideration for tumour suppressors, the top scorer is hsa-miR-6730-3p, a candidate which targets similar members of TGFβ and BMP signalling (ligands and receptors), but is also predicted to target PTEN with a score of 0.992 in the score range of (0,1). In the other direction, searching for a miRNA that targets tumor suppressors while remaining neutral to TGFβ revealed miR-130, which is upregulated in multiple cancers and promotes cell migration (65), and includes the specific demonstration of its promotion of EMT via TGFβ (66).
As a meta-analysis, an inherent limitation of metaMIR and the miRNA–target reference data table is that they can only predict based on information contained in the constituent input prediction algorithms. Integration of recent well-established miRNA–target prediction sources, however, has managed to encompass to some degree all known miRNAs and most genes (considering a single representative transcript). Missing information from any given dataset is thus a reflection of non-prediction, rather than missing miRNA or gene information, thereby allowing the empirical determination of negative (non-interacting) predictions. In the present study, this additional information further refined the list of miRNA candidates. Further, although most input algorithms are focused on 3′-untranslated information, clearly there is information to be gained, as seen in the analysis here of the proteomics data, where different rankings of performance are observed compared to the genetic data (Supplementary Figure S8). Input algorithms which included CDS prediction data generally performed better at explaining the largest effects on protein expression. It has also been previously noted in CLASH analyses, that a considerable fraction of hybrids returned revealed coding-sequence targeting (41). Taken together, this integrated, combinatorial approach, powered by a more comprehensive integrated set of miRNA–gene target predictions, successfully identifies miRNAs supported by literature evidence for their functional roles in normal and pathogenic development. The adopted approach of analysing for non-prediction also demonstrates success in refining miRNA candidates by clusters of gene targets, by allowing the specification of genes not to be targeted. Such a capability could aid in safety of therapeutic applications, by identifying miRNA candidates on the basis of fewer off-target or undesired effects.
AVAILABILITY
MetaMIR is accessible via an easy-to-use interface on a webserver at http://rna.informatik.uni-freiburg.de/metaMIR/. The software is available for download as a standalone script at http://www.bioinf.uni-freiburg.de/Software/metaMIR/. On this page are links to a GitHub repository where the source code is freely available, as well as the reference table of positive and negative prediction scores calculated in this study. Additionally, the scripts and reference tables (Entrez and miRNA IDs, collections of experimentally-validated miRNA:target gene interactions, training and test sets used during the training) are available via the linked GitHub repository.
SUPPLEMENTARY DATA
Supplementary Data are available at NAR Online.
ACKNOWLEDGEMENTS
The authors wish to thank Jan Pruszak for support of the project.
FUNDING
Deutsche Forschungsgemeinschaft (DFG) project [PR1132/3-1 to J.P.]. Funding for open access charge: Deutsche Forschungsgemeinschaft (DFG) project [SPP1738 to R.B.].
Conflict of interest statement. None declared.
Present address: Jason A. Davis, Coreva Scientific, 198–200 Kaiser-Joseph Str,79104, Freiburg, Germany.

Comments