


Abstract
Embryonal tumor with multilayered rosettes (ETMR) is a rare and aggressive embryonal brain tumor that solely occurs in infants and young children and has only recently been recognized as a separate brain tumor entity in the World Health Organization classification for CNS tumors. Patients have a very dismal prognosis with a median survival of 12 months upon diagnosis despite aggressive treatment. The aim of this study was to develop novel treatment regimens in a preclinical drug screen in order to inform potentially more active clinical trial protocols.
We have carried out an in vitro and in vivo drug screen using the ETMR cell line BT183 and its xenograft model. Furthermore, we have generated the first patient-derived xenograft (PDX) model for ETMR and evaluated our top drug candidates in an in vitro drug screen using this model.
BT183 cells are very sensitive to the topoisomerase inhibitors topotecan and doxorubicin, to the epigenetic agents decitabine and panobinostat, to actinomycin D, and to targeted drugs such as the polo-like kinase 1 (PLK1) inhibitor volasertib, the aurora kinase A inhibitor alisertib, and the mammalian target of rapamycin (mTOR) inhibitor MLN0128. In xenograft mice, monotherapy with topotecan, volasertib, and actinomycin D led to a temporary response in tumor growth and a significant increase in survival. Finally, using multi-agent treatment regimens of topotecan or doxorubicin combined with methotrexate and vincristine, the response in tumor growth and survival was further increased compared with mice receiving single treatments.
We have identified several promising candidates for combination therapies in future clinical trials for ETMR patients.
ETMRs are a tremendous challenge in neuro-oncological treatment because of their aggressive nature, clinical course, resistance to current chemotherapy regimens, young age, and dismal outcome of patients. There is an urgent need for novel treatment strategies and reevaluation of current treatment protocols. We performed a detailed in vitro and in vivo drug screen in 2 ETMR xenograft models to identify potential drug candidates. Most of the conventional chemotherapeutics in our screen had no or little effect on ETMR cells, but they were very sensitive to PLK1 and mTOR inhibition, to actinomycin D, to topoisomerase I inhibition by topotecan, and to epigenetic compounds, such as panobinostat and decitabine. In vivo studies revealed topotecan, volasertib, and actinomycin D as the best candidates to prolong survival of tumor-bearing mice, and we thus propose these 3 drugs as potent candidates for combination chemotherapies in future clinical trials for ETMR.
Embryonal tumor with multilayered rosettes (ETMR) is a rare and aggressive embryonal brain tumor occurring primarily in infants and young children. Formerly described as a variant of CNS primitive neuroectodermal tumors (PNETs), this newly recognized brain tumor entity includes 3 histological variants: embryonal tumors with abundant neuropil and true rosettes, ependymoblastoma, and medulloepithelioma.1,2 These tumors are classified by their distinct histology of multilayered rosettes and neoplastic neuropils interspersed with embryonal regions and differentiated areas. Additional diagnostic markers for ETMRs are the amplification of the miRNA cluster C19MC on chromosome 19 and high expression of LIN28A protein.3,4
ETMR patients face a very aggressive clinical course with poor outcome and a median survival of 12 months after diagnosis.1,8 Current treatment protocols include maximal safe surgery with subsequent chemotherapy, often including high-dose chemotherapy with stem cell rescue and focal or craniospinal radiotherapy, depending on the age of the patient. Conventional chemotherapy often comprises a systemic multi-agent regimen including cyclophosphamide, methotrexate, vincristine, carboplatin, and etoposide.9 Because of the low number of ETMR patients, it is difficult to draw any profound conclusions on different treatment regimens and their effects on patient outcome to date. While conventional high-dose chemotherapy and radiotherapy may give a good initial tumor response, the very aggressive nature of ETMRs is still poorly controlled by the current therapies, leading to a high risk of early relapse with very poor overall survival.9–11
Good preclinical ETMR models are needed to evaluate standard and novel treatment options. The only available preclinical model so far is the human ETMR cell line BT183.7 In the study by Spence et al, an in vitro drug library screen was performed, showing that BT183 cells are sensitive to insulin-like growth factor 1 receptor, phosphatidylinositol-3 kinase, and mammalian target of rapamycin (mTOR) inhibition, as well as cell cycle and DNA damaging compounds.7 However, no in vivo follow-up studies have been conducted since then. Here we have carried out a detailed in vitro and in vivo preclinical drug screen using BT183 cells to investigate current chemotherapeutic treatment regimens for ETMRs and to explore other relevant and novel treatment options in order to improve therapy. Furthermore, we have used human ETMR cells derived from a newly established ETMR patient-derived xenograft (PDX) model to validate and confirm our results obtained with the BT183 cell line.
Materials and methods
Human Patient Samples
For all human patient samples, informed consent was obtained in accordance with research ethics board approval.
450k Methylation Profiling
DNA methylation profiling was performed as described by Sturm et al.16 Cytosine-phosphate-guanine methylation values for the pediatric brain tumor reference samples were used from the public dataset available under the National Center for Biotechnology Information’s (NCBI) Gene Expression Omnibus (GEO) accession number GSE73801. For unsupervised clustering of pediatric brain tumor reference samples, we selected the 5000 most variably methylated probes across the dataset.
Gene Expression Analysis
Gene expression profiling of the BT183 cell line was performed using the GeneChip Human Genome U133 Plus 2.0 Array. Data were compared with primary human ETMRs, other pediatric human brain tumor entities, and normal brain (public datasets GSE3526 and GSE73038) by using the R2 platform for analysis and visualization (http://hgserver1.amc.nl/cgi-bin/r2/main.cgi).
Cell Culture
BT183 cells were derived from a primary, untreated tumor of a 2-year-old ETMR patient and were cultured in low-adhesion cell culture flasks, as described previously.7
In Vitro Drug Screens
BT183 cells were plated in 96-well plates (Sarstedt) and inhibitors were added 16 hours later. NCH3602 cells were obtained after dissection and manual dissociation of tumor cells. They were cultured in NeuroCult NS-A Proliferation medium and drugs were added 2–4 hours after plating. All inhibitors were commercially purchased (Supplementary Table S1). Treatments were performed in triplicates; each plate contained a nontreatment condition and vehicle condition. Seventy-two hours later, cell viability was determined using the CellTiter-Glo reagent (Promega); luminescence was measured with an automated plate reader (Mithras LB 940, Berthold Technologies). Dose-response curves and half-maximal inhibitory concentration (IC50) values were calculated with GraphPad Prism software.
Colony Formation Assay
BT183 cells were plated in collagen-coated wells at a density of 1250 cells/mL. One hour later, inhibitors were added. Colony formation was observed over 8 days. Inhibitors were added again at day 4 to avoid replenishment of inhibitors. On days 3, 5, and 8, the number of colonies was counted per well after staining with 0.1% crystal violet/H2O. For analysis, wells were photo scanned (Epson Perfection V850 Pro) and colonies were counted manually using ImageJ software (https://imagej.nih.gov/ij/).
Caspase-3/-7 Time Course Assay
For time course assessment of caspase-3/-7 activity, BT183 cells were measured every 12 hours from time point of drug application for 72 hours using the Caspase-Glo 3/7 assay (Promega) and an automated plate reader.
Cell Viability Time Course Assay
Cell viability assay was performed with the same experimental procedure as for the caspase-3/-7 time course assay using the CellTiter-Glo assay (Promega).
7-Aminoactinomycin D/Annexin V Fluorescence Activated Cell Sorting Apoptosis Assay
BT183 cells were treated with the respective inhibitors 16 hours after plating. Analysis of apoptosis was done 48 hours later for volasertib, topotecan, doxorubicin, and panobinostat, and 72 hours later for alisertib, MLN0128, and decitabine. The Phycoerythrin Annexin V Apoptosis Detection Kit (BD Biosciences) was used according to the manufacturer's protocol.
Cell Cycle Analysis
Forty-eight hours after drug treatment, cell cycle analysis was performed using a fluorochrome solution of 0.1% Triton X-100/50 μg/mL propidium iodide/0.1% sodium citrate/H2O. Samples were incubated for at least 1 hour at 4°C and then measured with a flow cytometer.
Cell Lysis and Western Blotting
Forty-eight hours after drug treatment, BT183 cells were lysed and protein concentrations were measured. Sodium dodecyl sulfate–polyacrylamide gel electrophoresis was performed according to standard procedures using 4%–12% Bis-Tris gels and afterward transferred to polyvinylidene difluoride western blotting membranes. Membranes were incubated with respective primary antibodies at 4°C overnight (Supplementary Table S1). Secondary antibodies (Supplementary Table S2) were applied for 1 hour at room temperature and membranes were imaged by chemiluminescence (ECL Detection Reagent, GE Healthcare) and blotted on Fuji medical X-ray films (Fujifilm). Quantification was performed by densitometry analysis using ImageJ software.
In Vitro Drug Synergy Analysis
BT183 cells were treated with the respective inhibitors 16 hours after plating. Seventy-two hours later, cell viability was determined using the CellTiter-Glo assay. Drug synergism was defined according to the Chou–Talalay method using CompuSyn software (ComboSyn).17
BT183 Xenograft Mouse Model
BT183 cells were transduced with a lentivirus carrying the pGreenFire1 (pGF1) Reporter Vector (System Biosciences) and were sorted by fluorescence activated cell sorting for green fluorescent protein (GFP)–positive cells. For cranial transplantation, 6- to 8-week-old female nonobese diabetic severe combined immunodeficient gamma (NSG) mice were injected with 100000 pGF1-labeled BT183 cells into the striatum using a stereotactic frame (coordinates: 2.5 mm medial-lateral, −1.0 mm anteroposterior, −3.0 mm dorsoventral to bregma). All animal experiments were performed according to German Laws for Animal Protection and approved by the regional authorities (approval numbers G-64/14 and G-259/14).
In Vivo Bioluminescence Imaging
Tumor growth in BT183 transplanted NSG mice was monitored by weekly bioluminescence imaging. Briefly, mice were given 150 mg/kg VivoGlo luciferin (Promega), anesthetized with 2.0% isoflurane, and imaged using the In Vivo Imaging System (IVIS) Lumina Series III (Caliper Life Sciences). Data were analyzed with LivingImage software (Caliper Life Sciences).
ETMR Patient-Derived Xenograft Mouse Model NCH3602
The biopsy of the primary tumor was cultured in Neurobasal A medium (Gibco) supplemented with epidermal growth factor (20 ng/µL), basic fibroblast growth factor (20 ng/µL), B-27, L-glutamine, heparin (1 µg/mL), and penicillin and streptomycin for 24 hours until intracranial transplantation. Then, 1 × 10⁶ cells were injected into the striatum of 6- to 8-week-old female NSG mice as described above. Tumor growth was monitored by monthly MRI. Animals were euthanized when they showed severe signs of tumor growth or were symptomatic.
In Vivo Drug Treatment
Drug treatment in BT183 xenograft mice was started once the total flux, measured by bioluminescence imaging, reached 1000000 photons/second in each individual animal. Animals were randomized and treated until they displayed signs of morbidity or toxicity (>20% weight loss), whereupon they were euthanized. For monotherapy treatment, animals received topotecan (2.5 mg/kg), doxorubicin (Caelyx, 7 mg/kg), actinomycin D (0.06 mg/kg), volasertib (25 mg/kg), MLN0128 (3 mg/kg), alisertib (30 mg/kg), vincristine (0.5 mg/kg), panobinostat (10 mg/kg), and decitabine (2.5 mg/kg). For treatment with combined chemotherapy, animals received methotrexate (3 mg/kg), vincristine (0.5 mg/kg), doxorubicin (Caelyx, 7 mg/kg), or alternatively topotecan (2.5 mg/kg). Further details of the treatments are listed in Supplementary Tables S1 and S2.
Histology and Immunohistochemistry
Hematoxylin and eosin (H&E) staining and immunohistochemistry were performed on 3–4 µm formalin-fixed paraffin-embedded sections of xenograft tumors using standard protocols. LIN28A immunohistochemistry and fluorescence in situ hybridization analysis for the 19q13.42 locus were performed as previously described.3,18 Imaging of sections was done with the Axioskop 40 microscope (Zeiss) using Axivision Rel. 4.8 software (Zeiss). Tumor sections were classified and evaluated by our local neuropathologist.
Statistical Analyses
Statistical analyses were performed using GraphPad Prism software. All data are presented as means ± SD unless stated otherwise. Comparisons between different groups were made using Student’s test or ANOVA as appropriate. The statistical significance of Kaplan–Meier survival curves was assessed using the log-rank (Mantel–Cox) test. P-values of 0.05 or lower were considered statistically significant for all experiments.
Data and Materials Availability
Gene expression data reported in this paper have been uploaded to NCBI’s GEO (https://www.ncbi.nlm.nih.gov/geo/) under accession number GEO: GSE94985. Cytosine-phosphate-guanine methylation values reported in this paper have been uploaded to GEO under accession number GEO: GSE94987.
Results
Patient-Derived ETMR Models
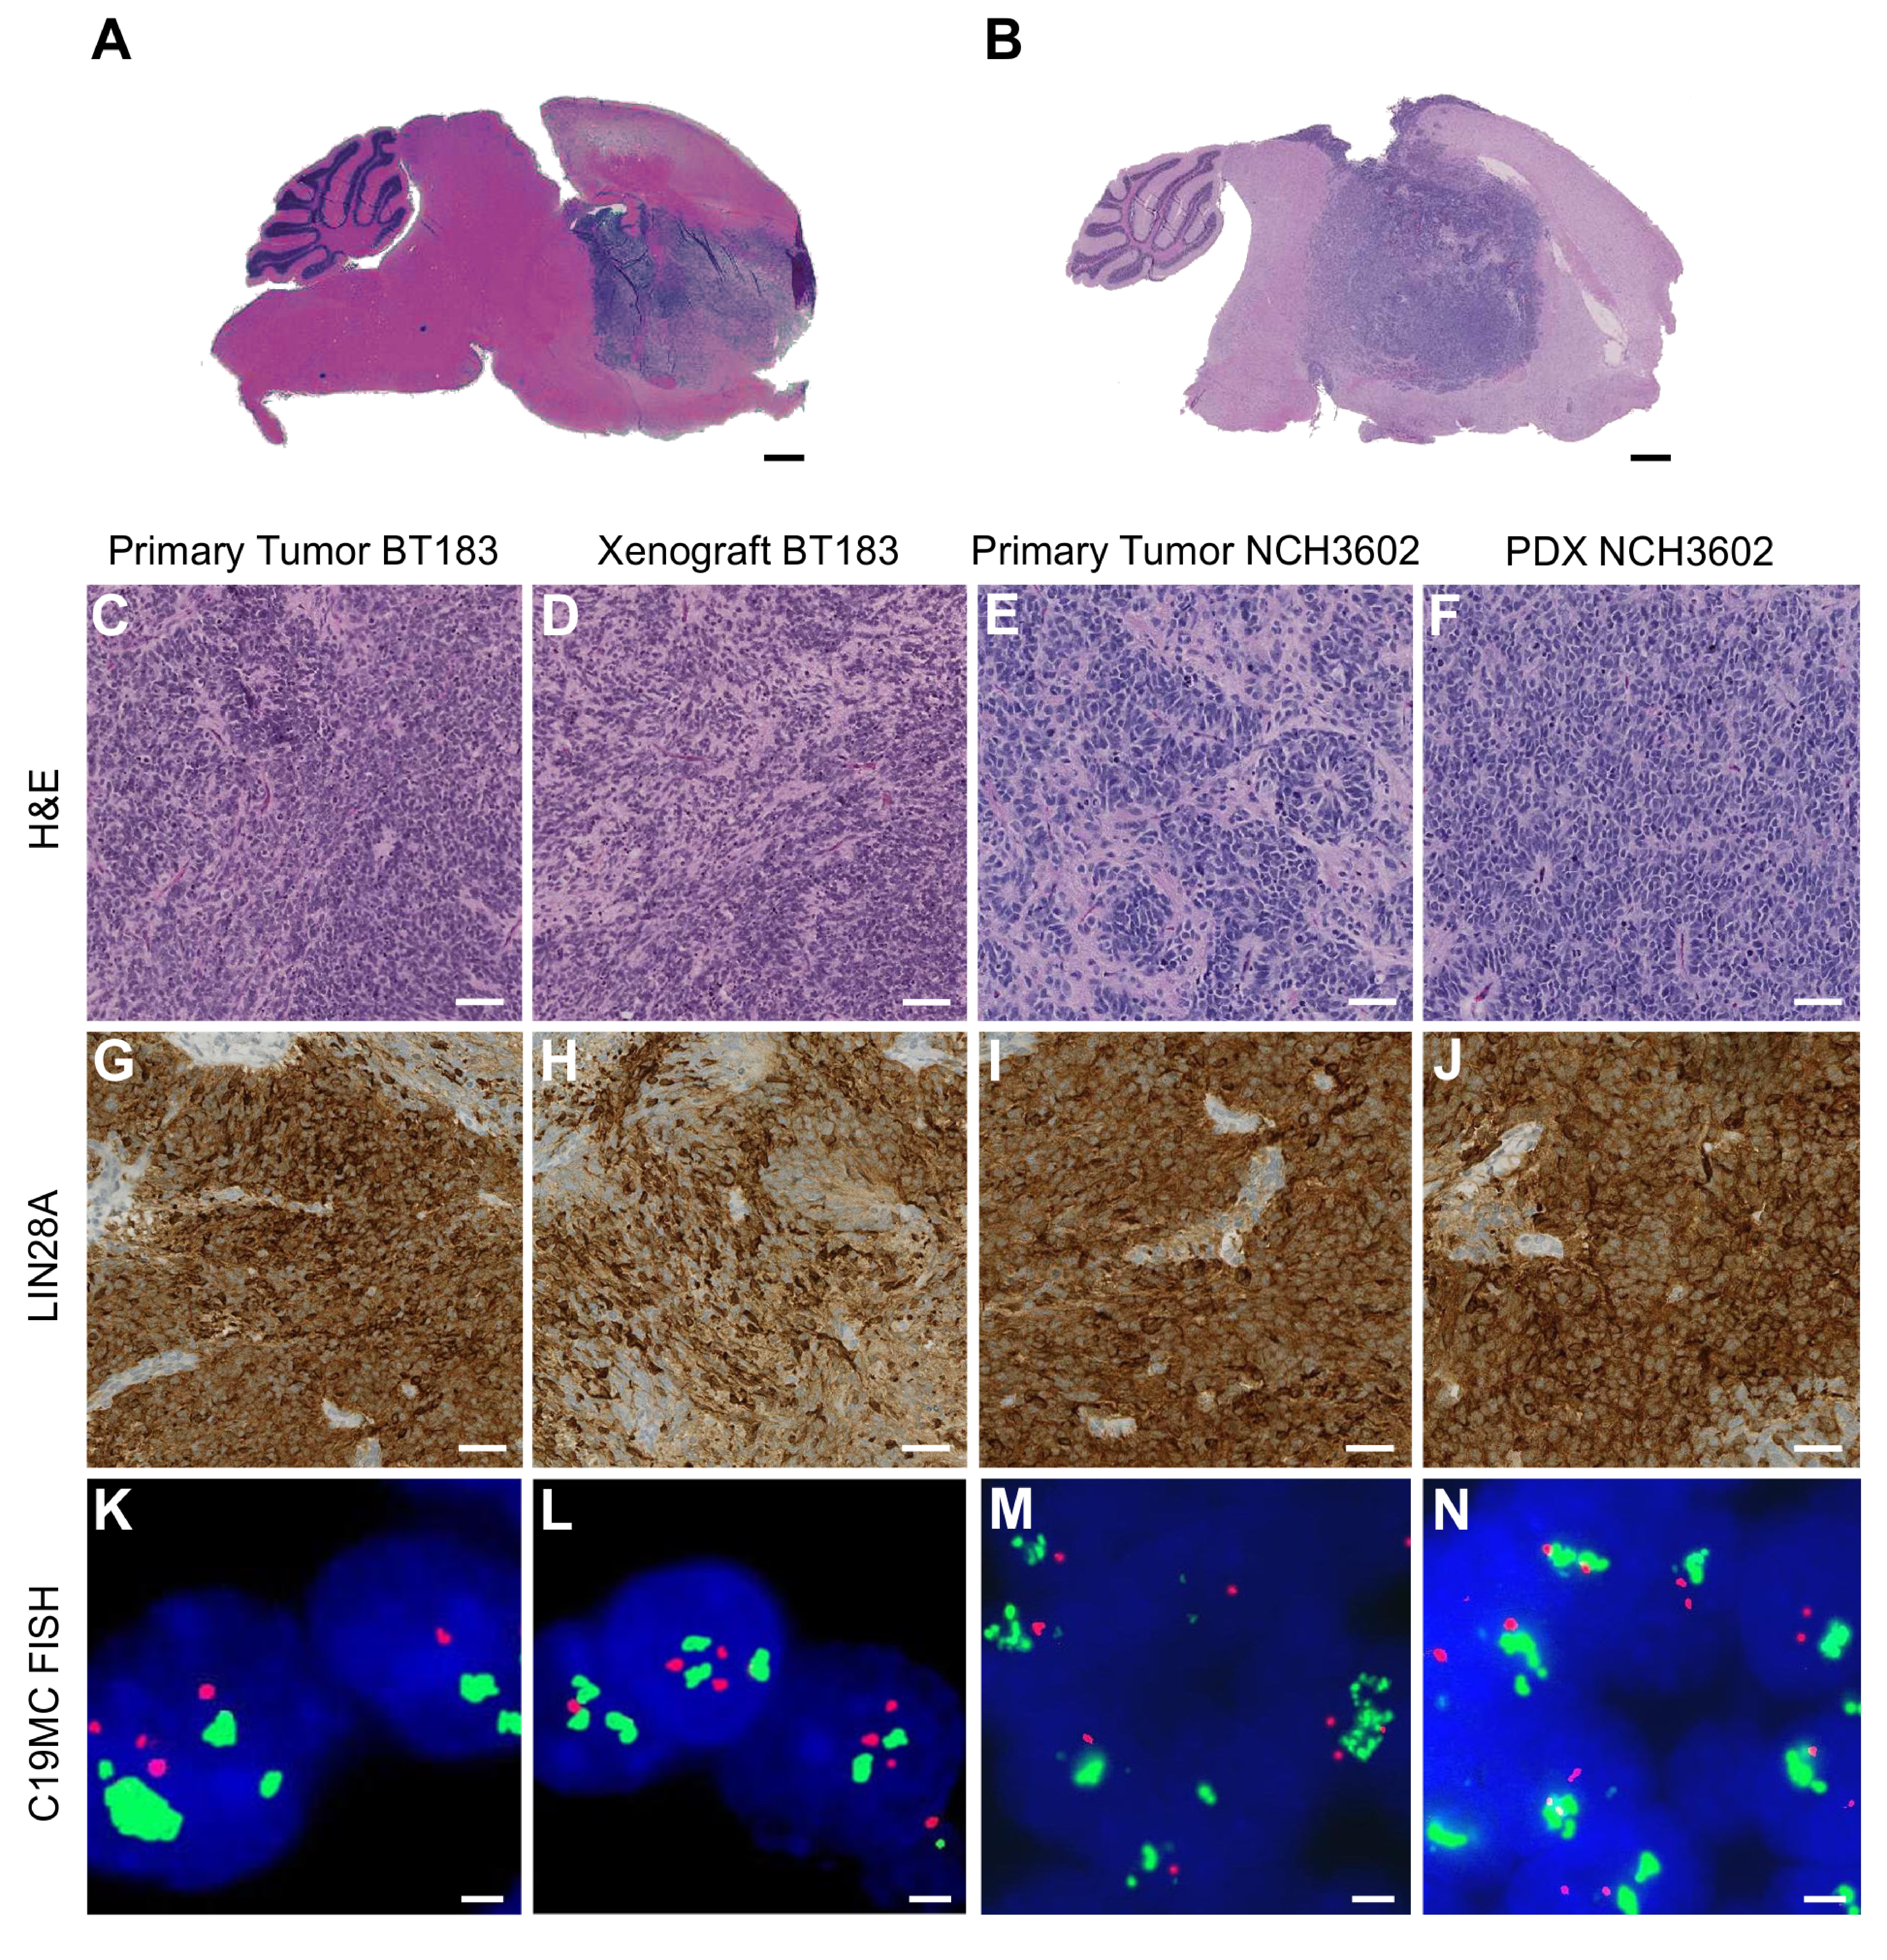
The human ETMR cell line BT183 derived from a 2-year-old ETMR patient grows stably in cell culture and can be transplanted intracranially into immune-deficient NSG mice to form tumors within 2–3 months that recapitulate ETMR biology.7 In addition, we have generated another ETMR PDX model (NCH3602) from a 2-year-old patient with a supratentorial tumor mass in the right hemisphere. Tumor tissue was obtained at the time of initial surgery of the patient, and tumor cells were transplanted into the striatum of 4 NSG mice. Three out of 4 mice developed tumors within 7–11 months after transplantation. To confirm the ETMR origin of our BT183 cell line, BT183 xenografts, and the established NCH3602 PDX model, we performed DNA methylation profiling (including copy number analysis and genotyping) and compared the data with a panel of other ETMRs and various other pediatric brain tumors. ETMR methylation profiles are highly distinct from other brain tumors and the methylation profiles of the BT183 cells (unlabeled cell line [“cell line”] and GFP-luciferase labeled cell line [“labeled cell line”]), the BT183 and NCH3602 xenografts, and their matching primary tumors cluster well within the group of ETMR tumors (Fig. 1A). The C19MC amplification, present in the primary tumors, is retained in both BT183 and NCH3602 xenografts, as well as gain of chromosome 2 (Fig. 1B–E). ETMR histology of the primary tumors and the xenograft tumors for both models was confirmed by H&E staining and high LIN28A expression, and amplification of the C19MC miRNA cluster was revalidated by fluorescence in situ hybridization (Supplementary Figure S1A–N). Our data emphasize that the BT183 cell line can be used as an in vitro and in vivo model to study ETMR biology and to perform preclinical tests. The newly established NCH3602 ETMR PDX model, despite its long tumor latency, can serve as a useful tool for validation.
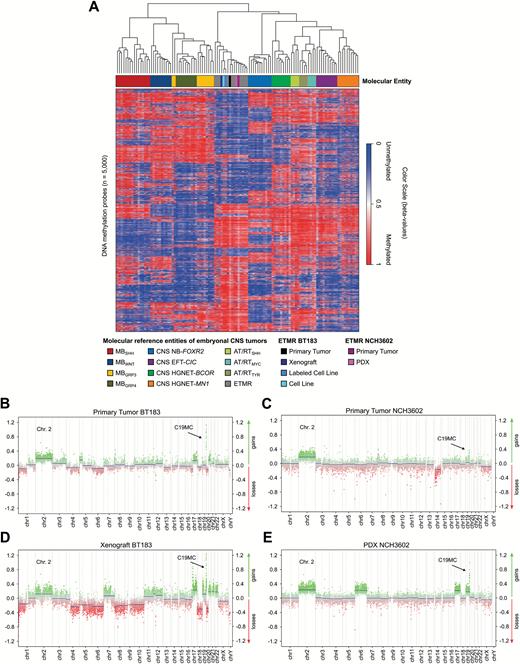
Methylation profiles of the ETMR xenograft model BT183 and the NCH3602 PDX model cluster within ETMR tumors. (A) Heatmap of unsupervised clustering of DNA methylation profiles of the unlabeled and labeled ETMR cell line BT183 (BT183 and pGF1-BT183), its xenograft tumor and primary tumor, the ETMR PDX model NCH3602 and its primary tumor alongside with 108 pediatric brain tumor samples as reference cohort. Brain tumor entities are depicted in different colors (top row), unmethylated regions are highlighted in blue shades, methylated regions in red shades. Copy number plots generated from DNA methylation data for the primary tumor BT183 (B), its xenograft (D), the primary tumor NCH3602 (C) and its xenograft (E). Gains of chromosome 2 are depicted and amplifications of 19q13.42 (C19MC) are highlighted with a black error for all samples. Amplifications and gains are indicated in green, losses in red.
Drug Screen in the ETMR Cell Line BT183
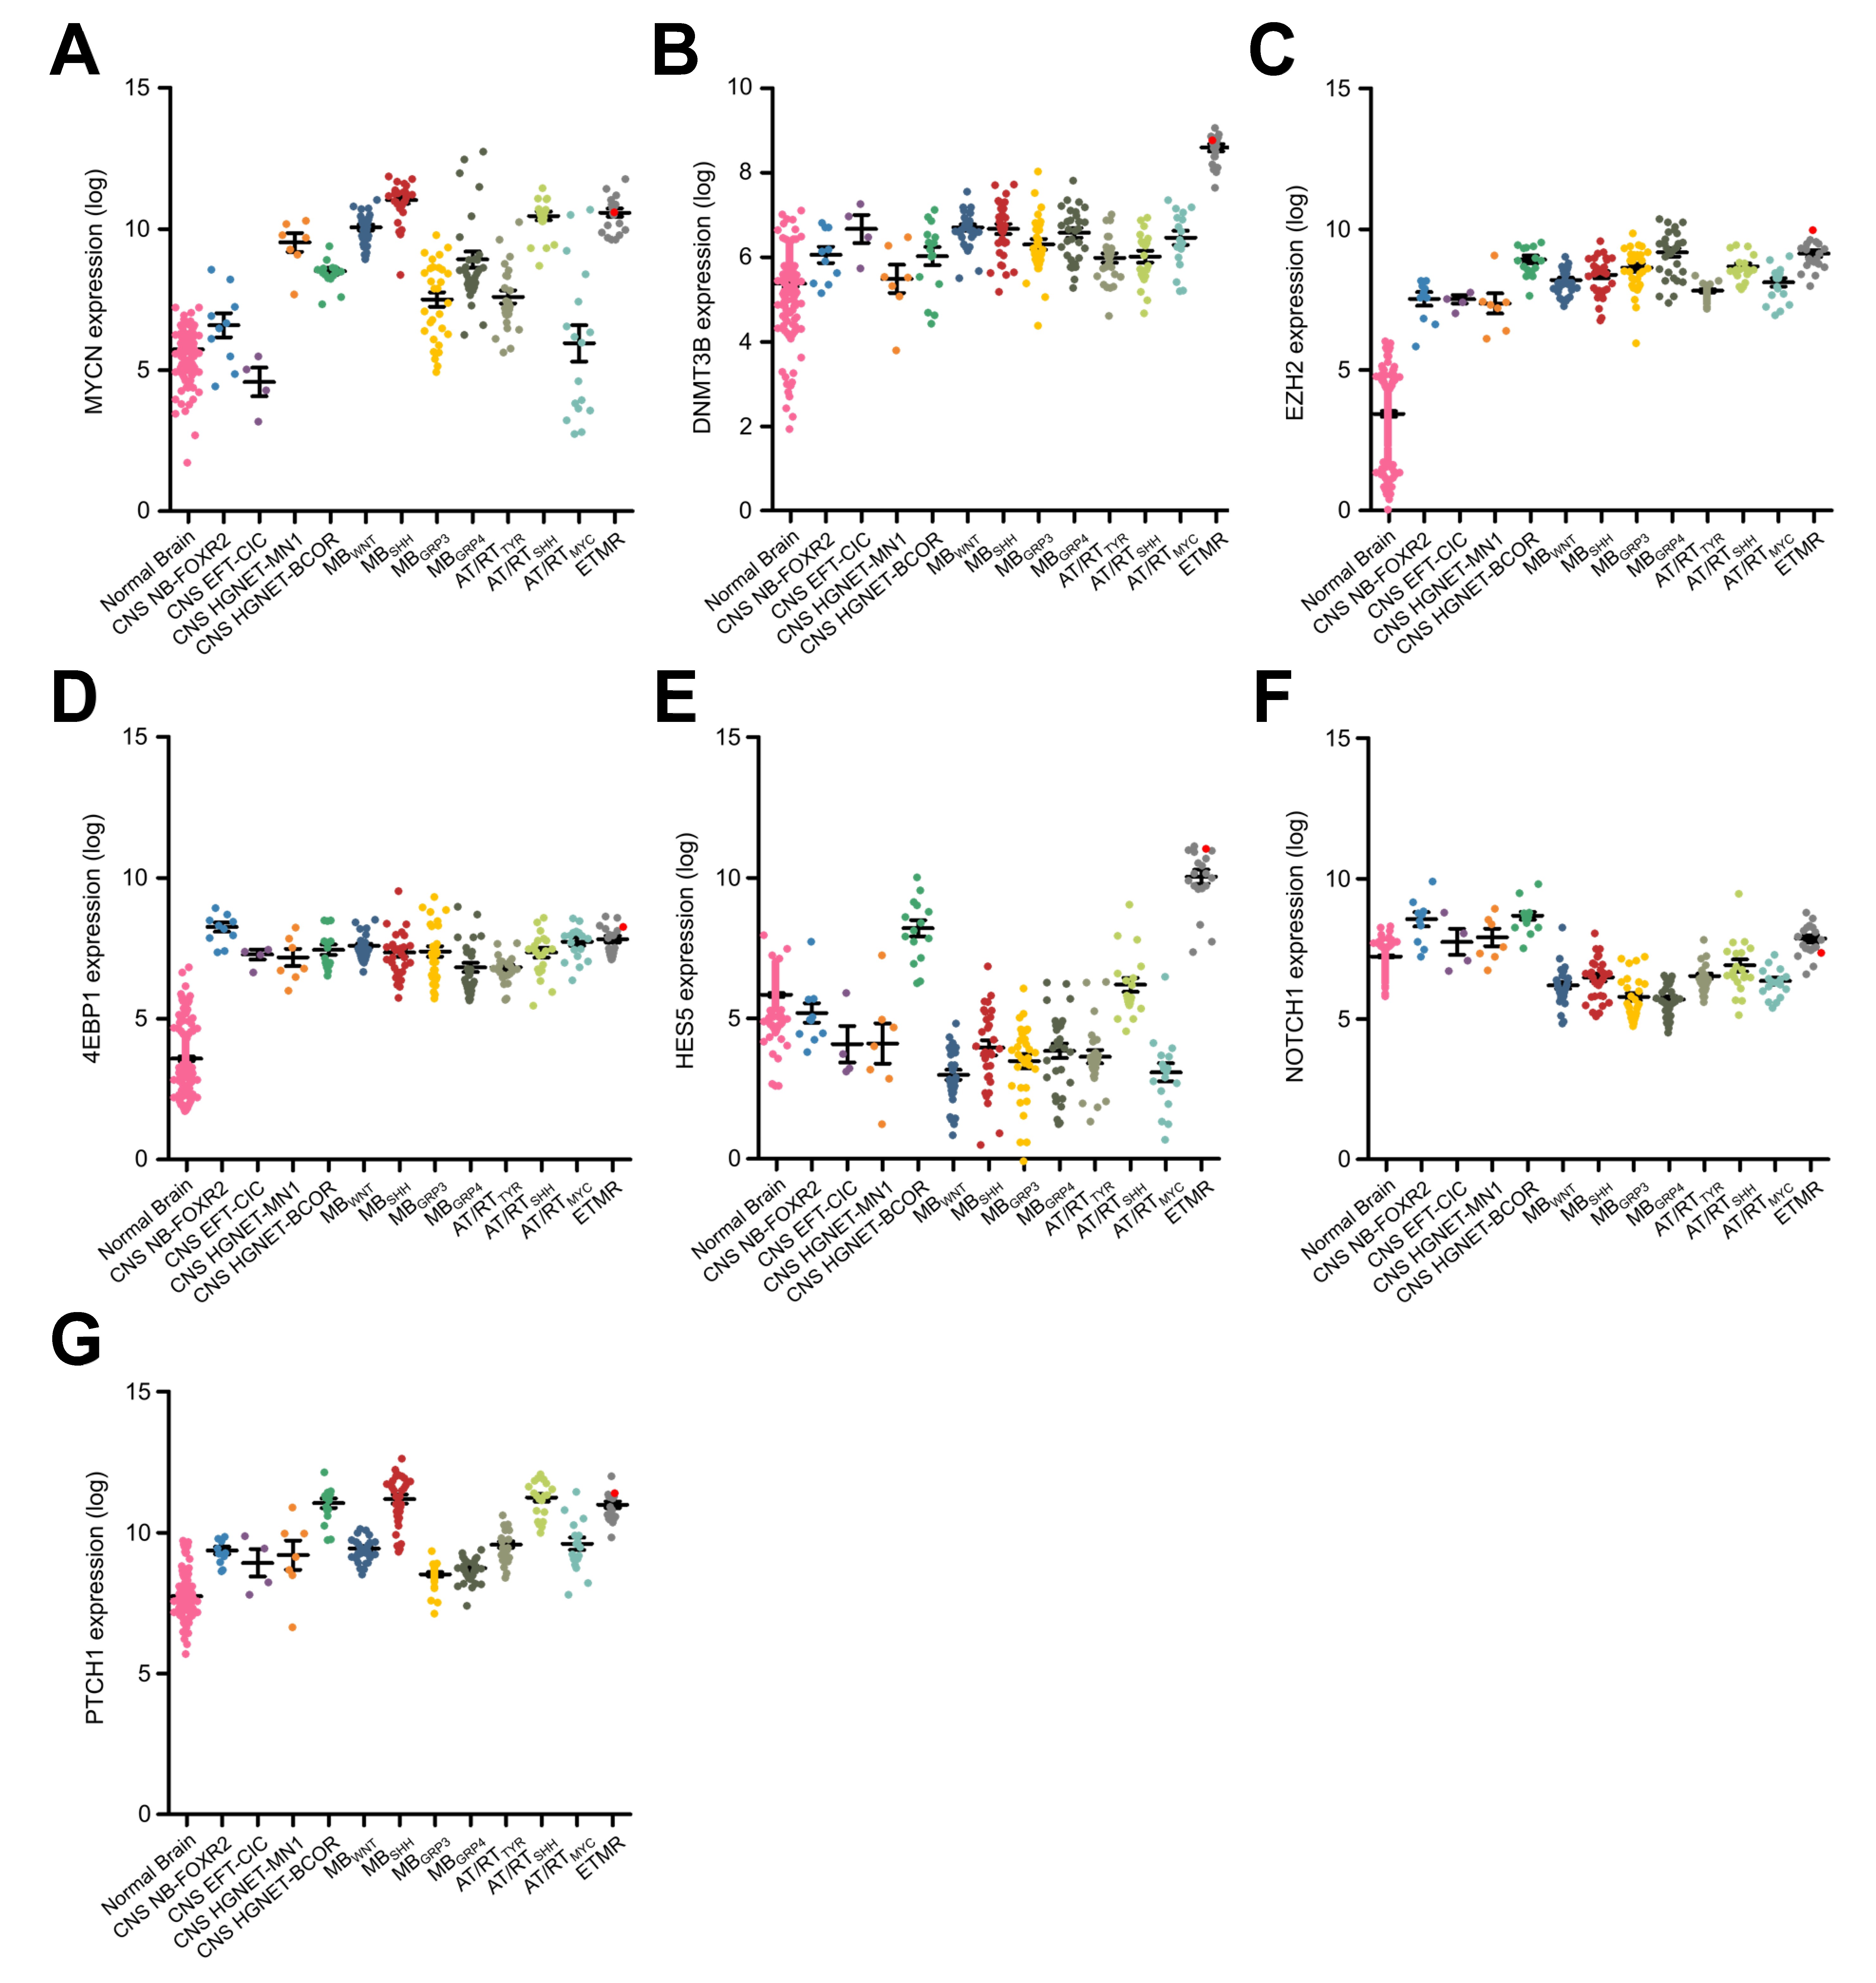
For our drug screen in ETMR cells we selected 35 compounds, including drugs currently used in treatment of ETMR and CNS PNET patients and targeted drugs potentially relevant in ETMR tumors (Supplementary Table S1) based on the following criteria: firstly, gene expression analyses of ETMRs, other pediatric brain tumor entities, and normal brain identifying several pathways and drug targets being deregulated in ETMRs, including the mTOR pathway (eukaryotic initiation factor 4E binding protein [4EBP1]), the sonic hedgehog pathway (Patched1), the Notch pathway (hairy and enhancer of split-5, Notch1), Myc neuroblastoma (MYCN), DNA methyltransferase 3B (DNMT3B), enhancer of zeste homolog 2, and topoisomerase inhibitors (Supplementary Figure S2).4,5,7 Secondly, preclinical and clinical status of potential compounds targeting these pathways and proteins was considered, including efficacy for treatment in humans, preferentially in children with CNS malignancies, and approval in pediatrics or ongoing clinical studies. Thirdly, the efficacy of crossing the blood–brain barrier was taken into account.
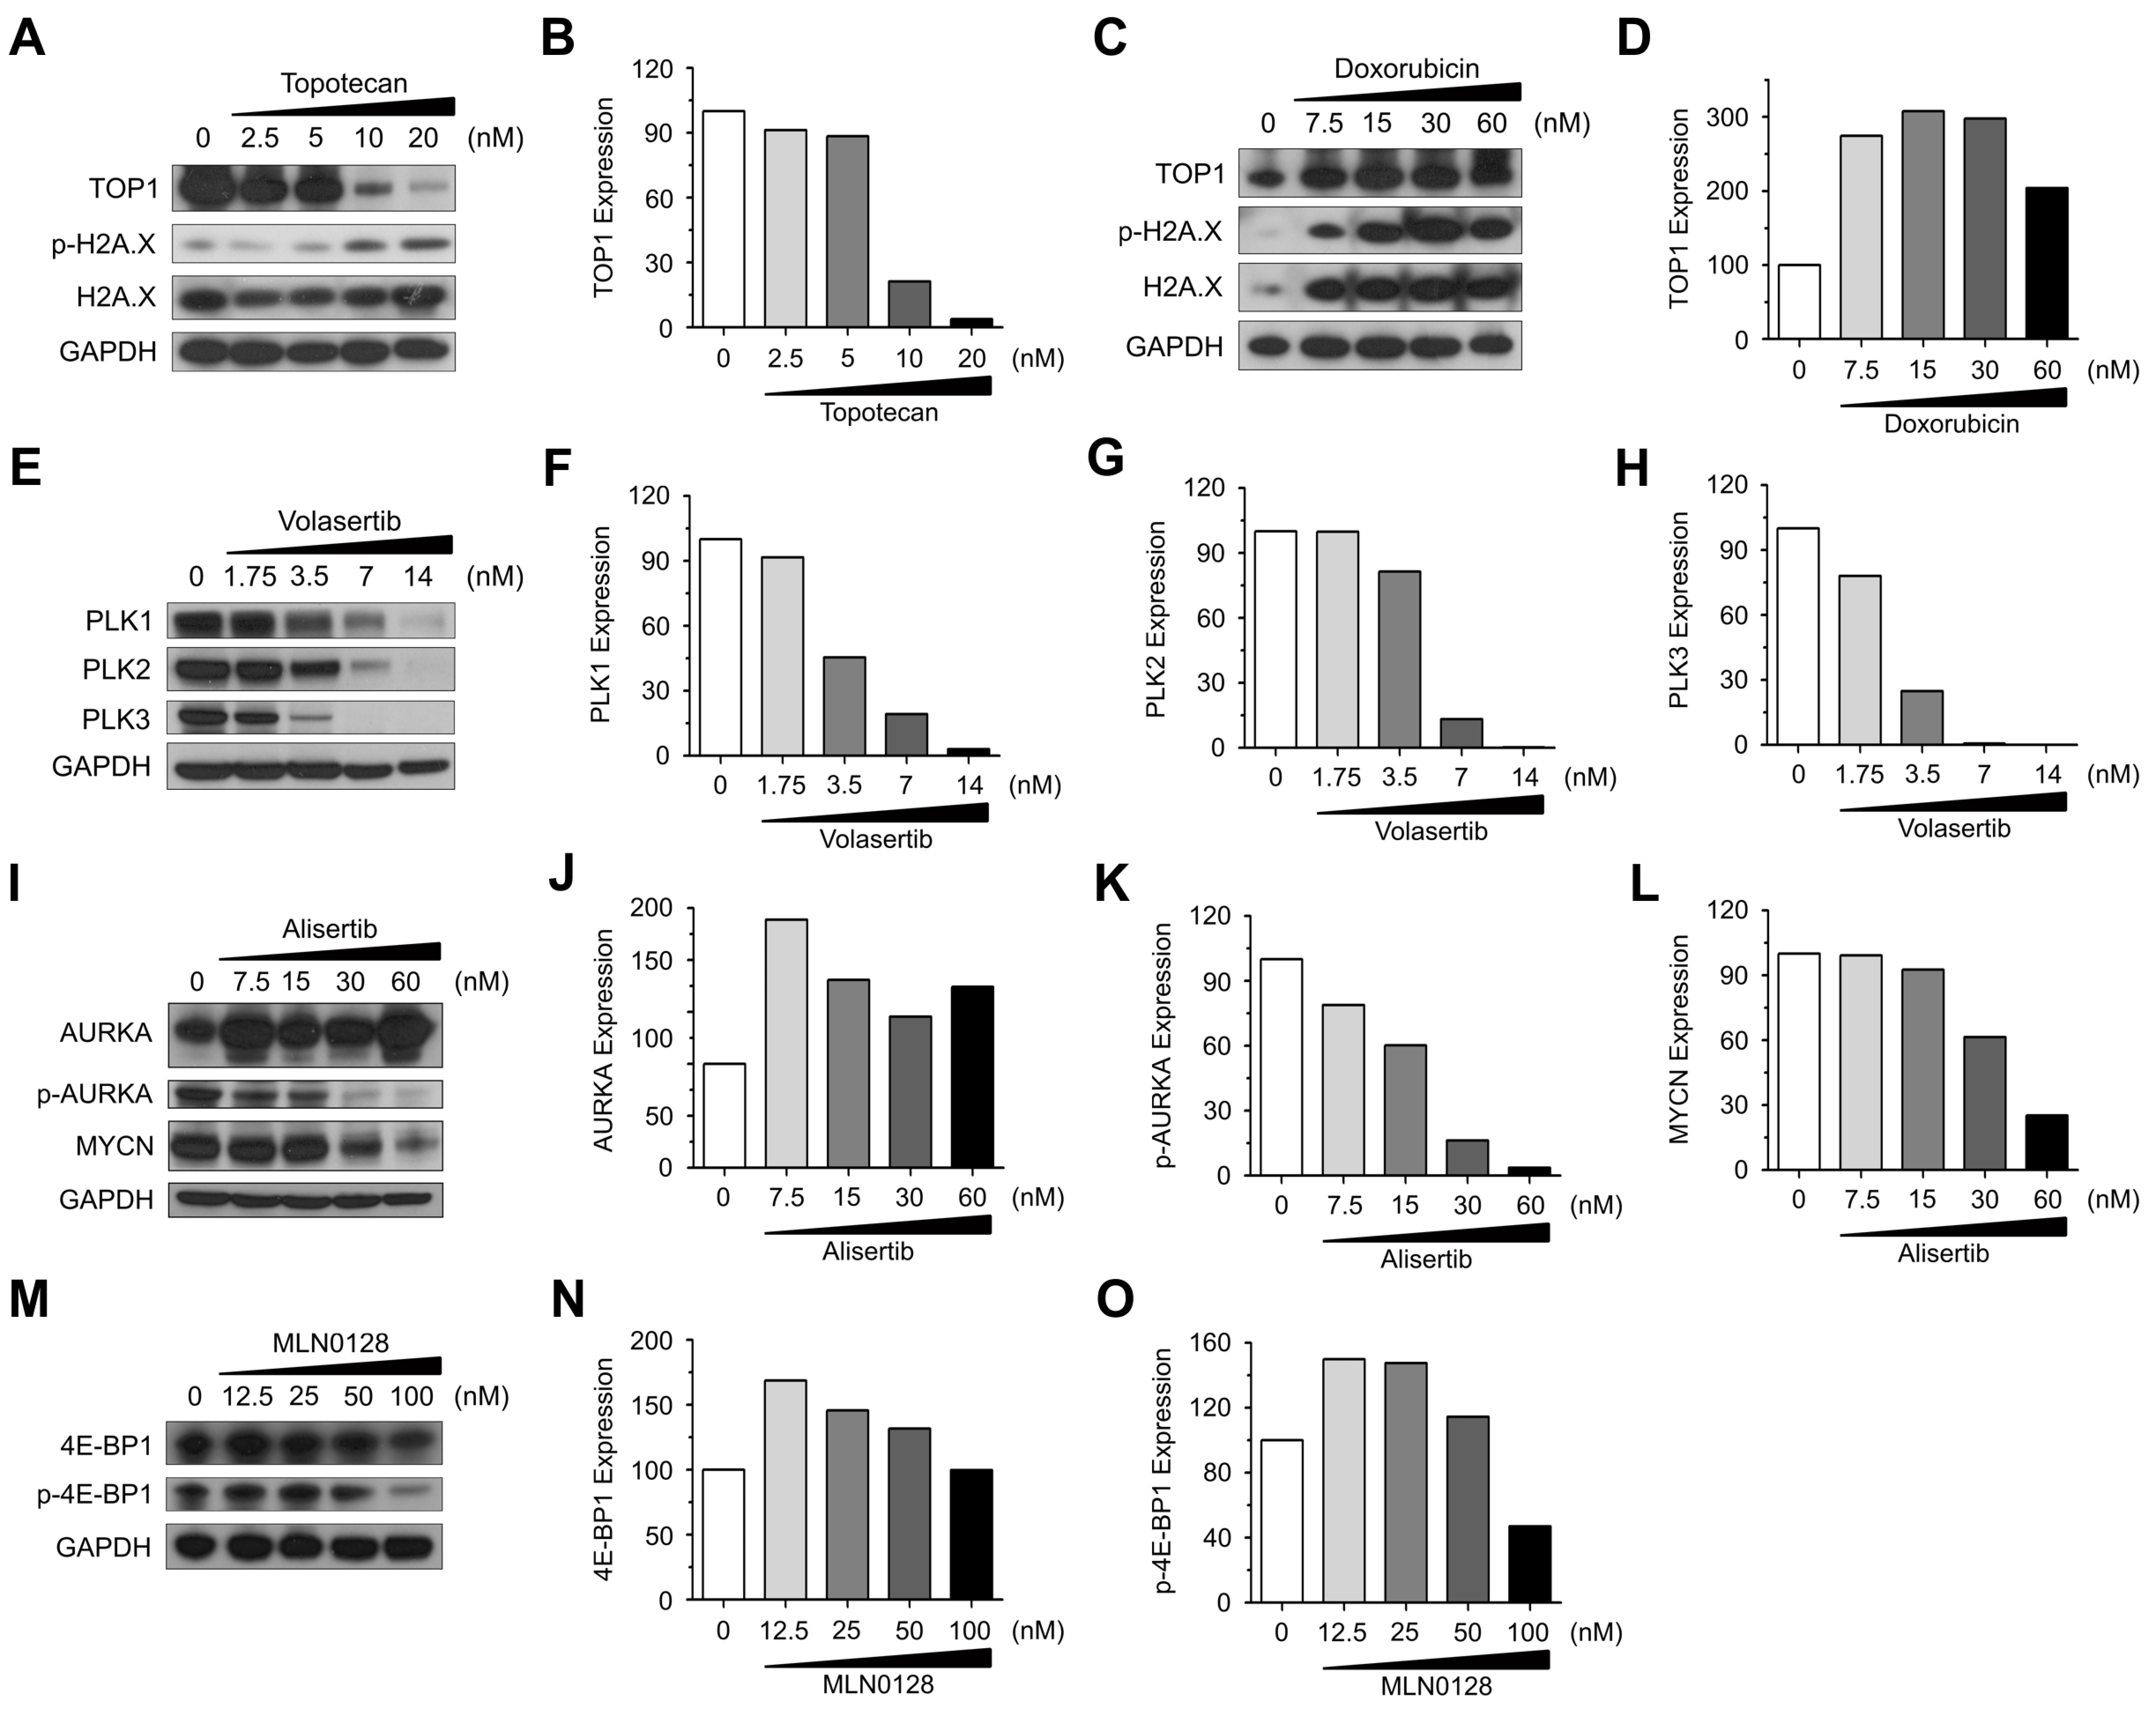
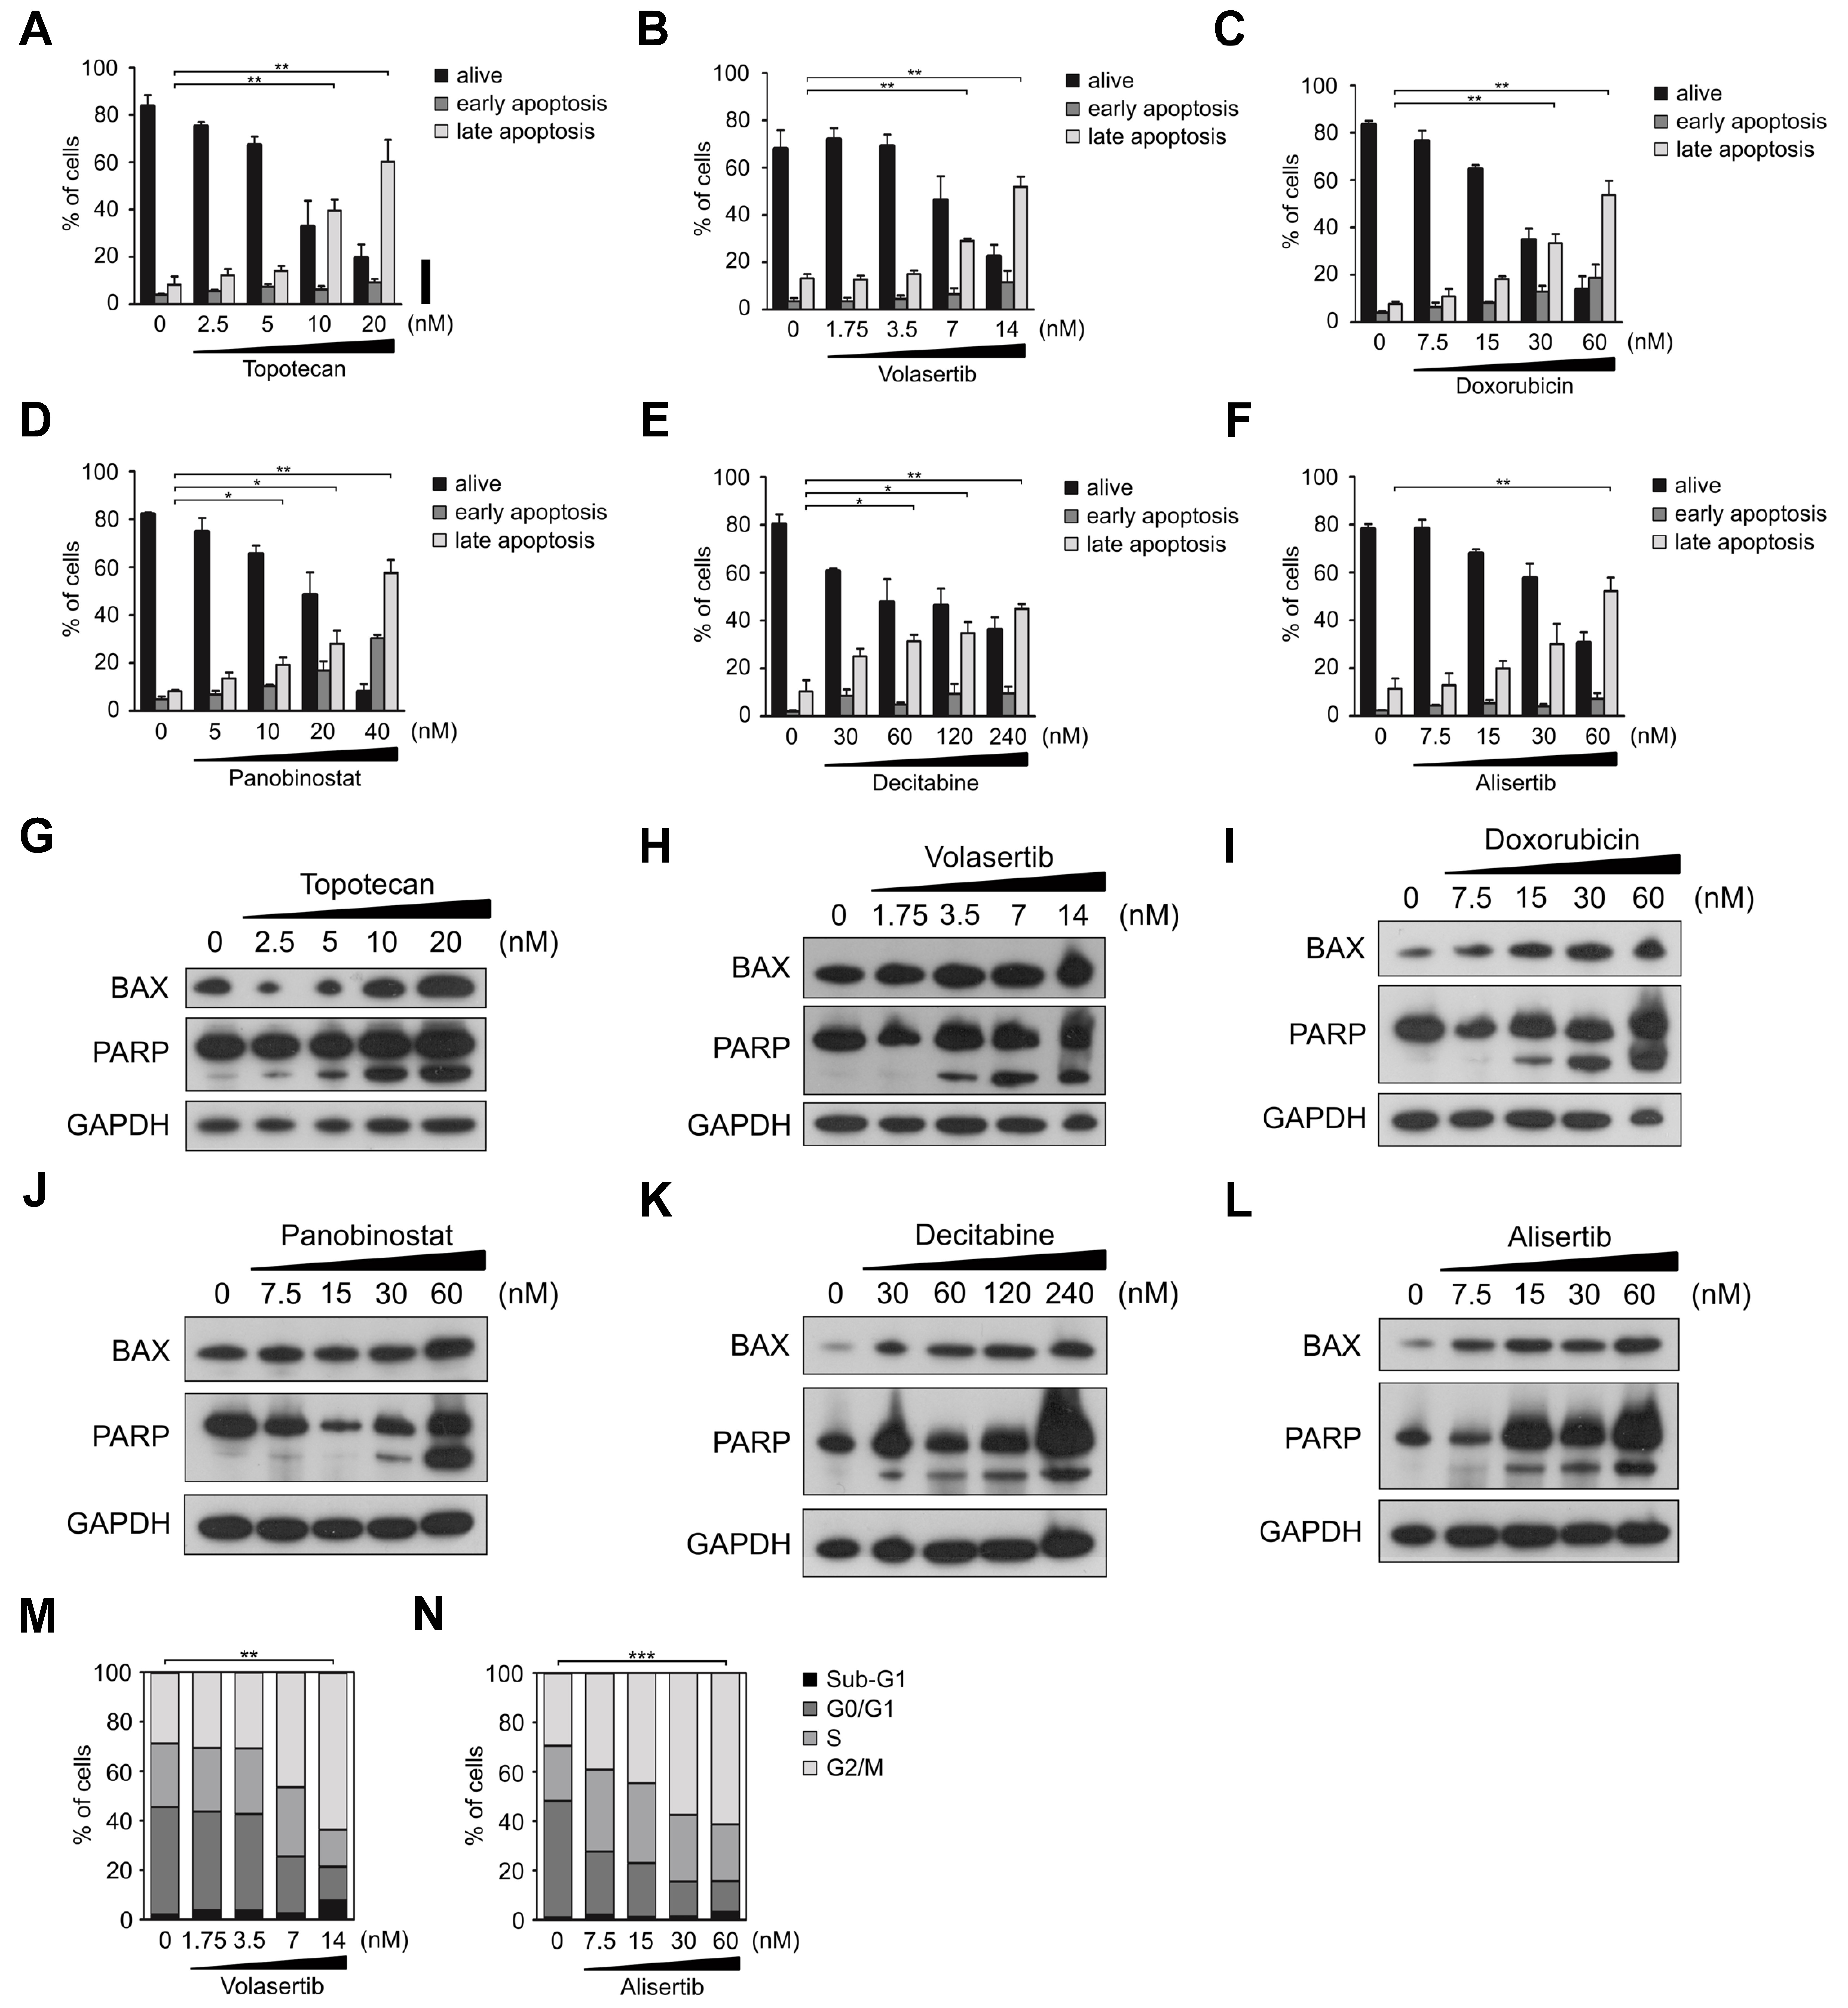
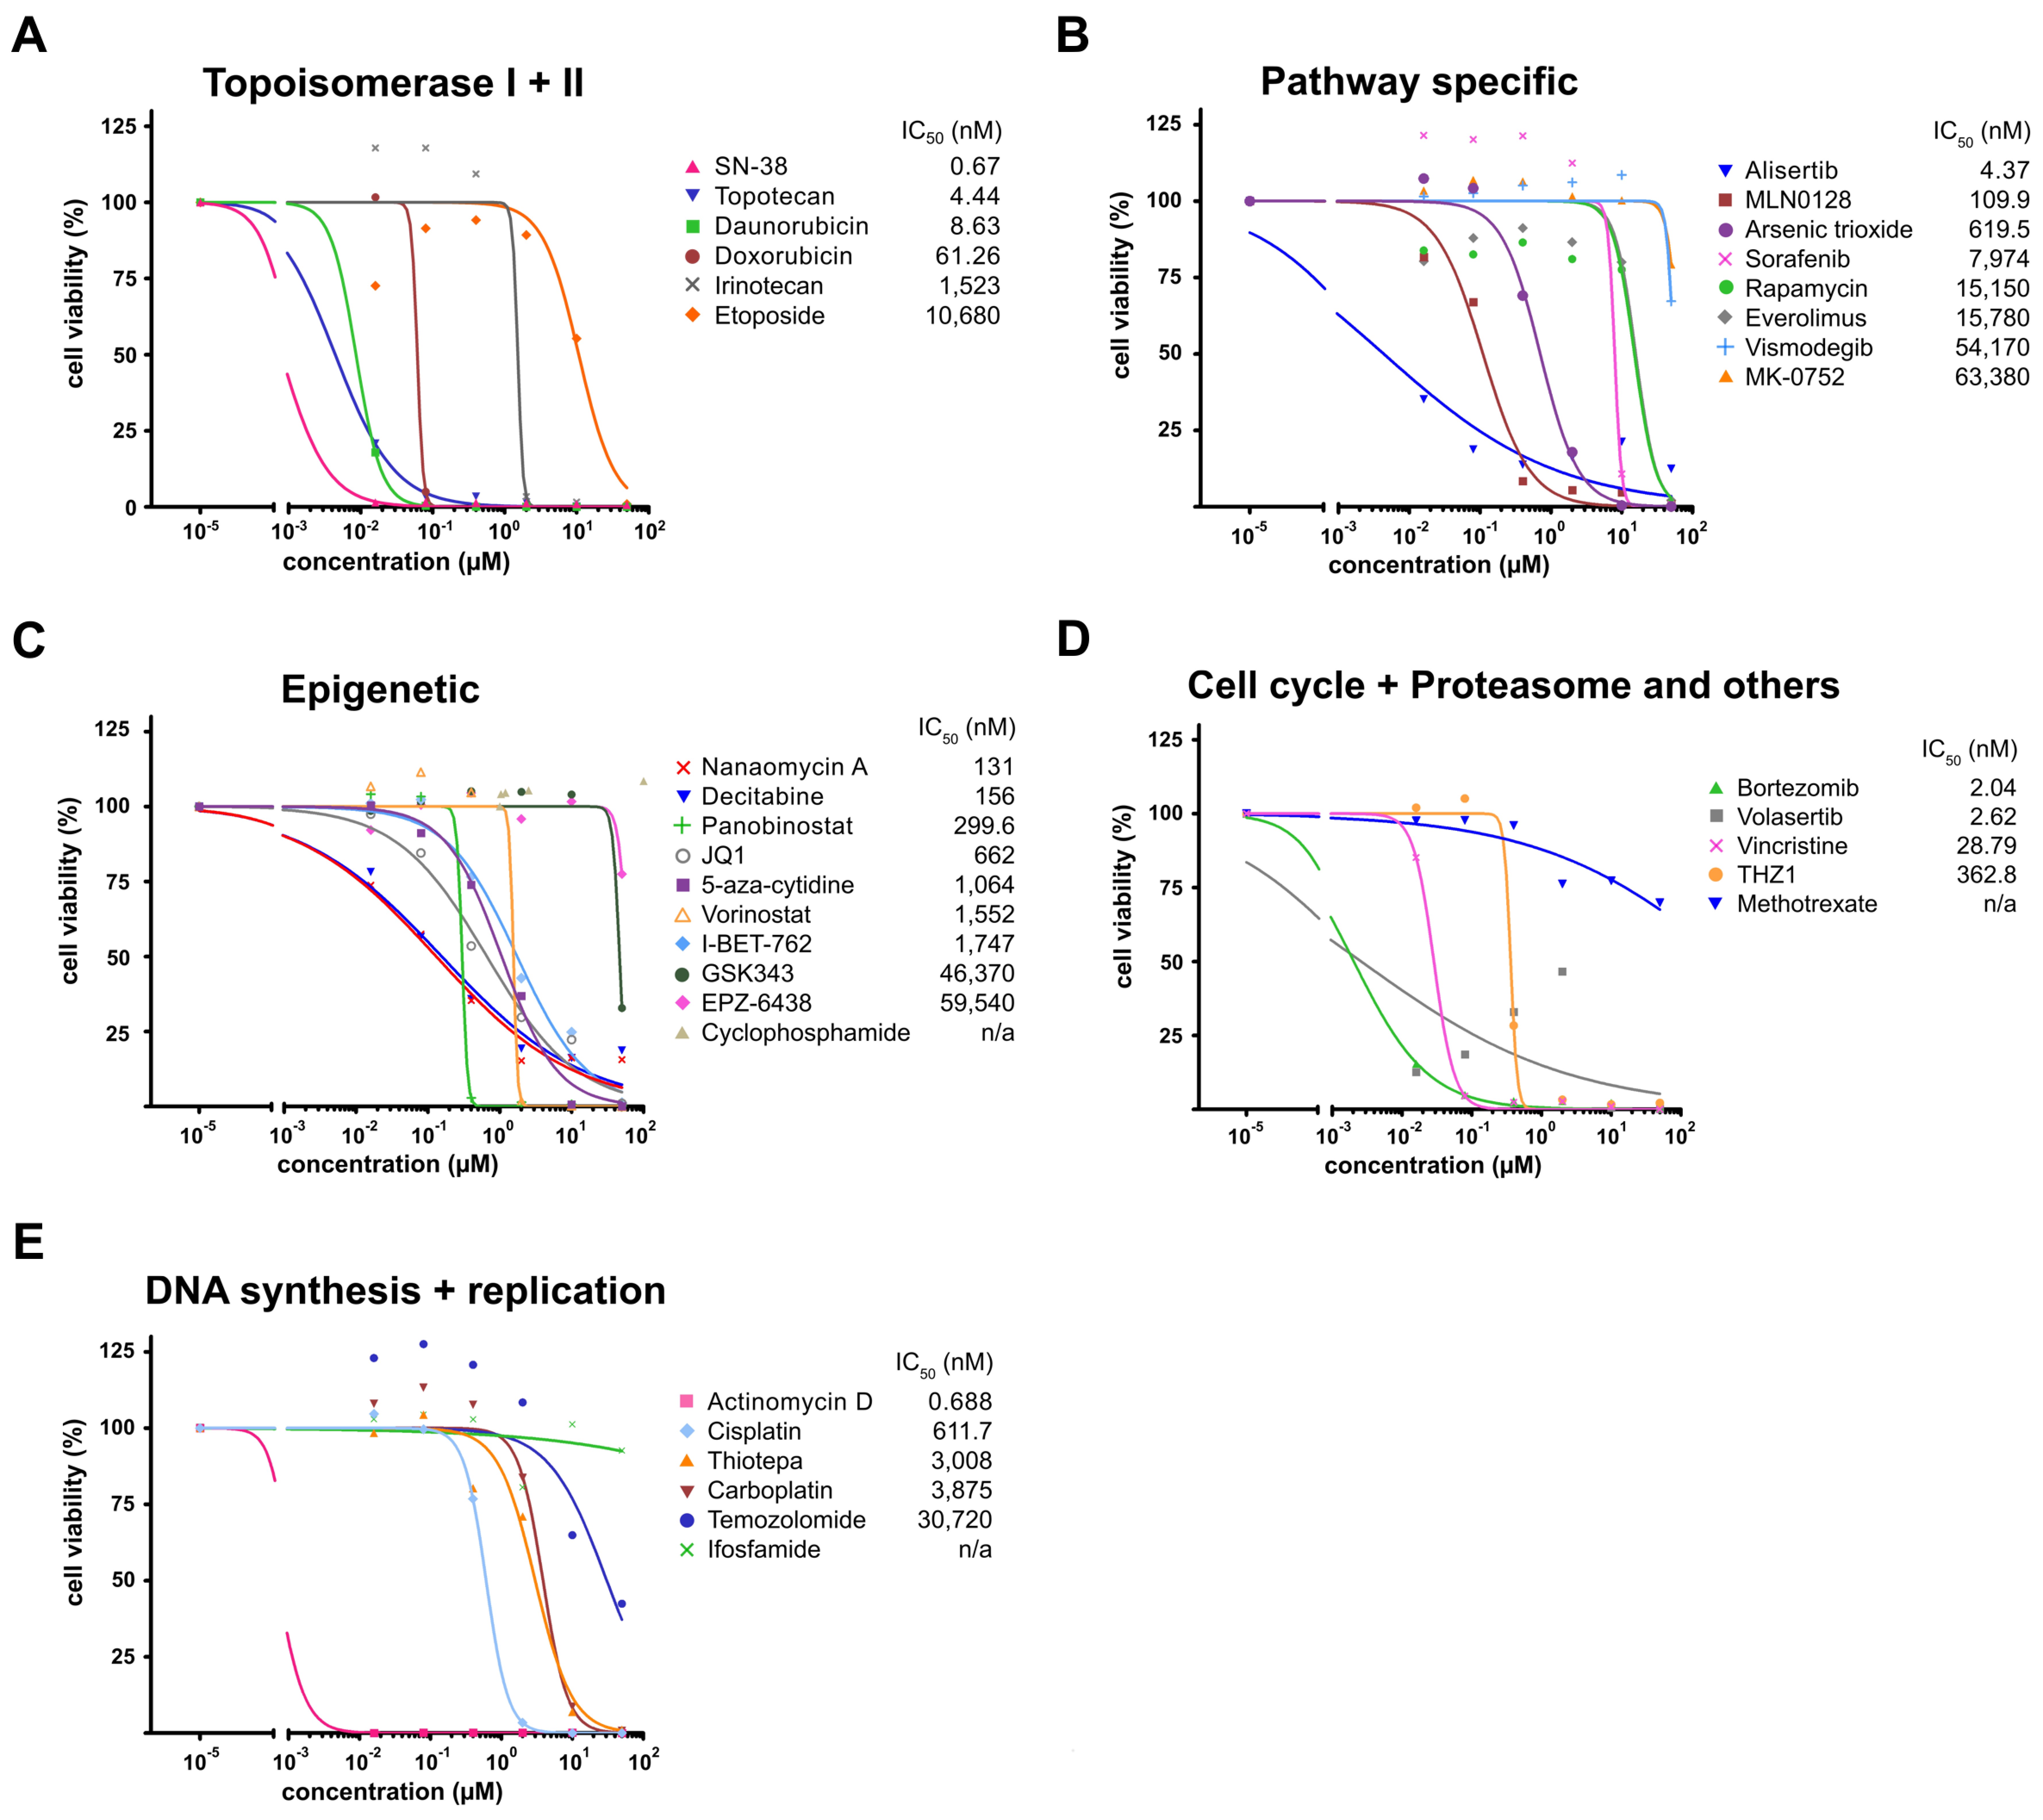
All compounds were tested at concentrations in the range of 16–50,000 nM using the BT183 cells, and compounds were ranked by their respective IC50 values (Fig. 2A). Individual IC50 curves for each compound can be seen in Supplementary Figure S3A–E. Among the top hits in our drug screen with an IC50 < 120 nM in BT183 cells were approved compounds in pediatrics, such as actinomycin D, vincristine, doxorubicin, and topotecan. Other top hits included novel drugs, such as the polo-like kinase 1 (PLK1) inhibitor volasertib, the aurora kinase A inhibitor alisertib, and the mTOR inhibitor MLN0128. Furthermore, with an IC50 < 300 nM we identified several epigenetic drugs, such as nanaomycin A, decitabine, and panobinostat. To explore novel treatment options for ETMR patients, we have focused on the top hits of our screen and elaborated their function in vitro and in vivo in our BT183 xenograft mice. We excluded bortezomib, since it does not cross the blood–brain barrier, and nanaomycin A, which is not available for preclinical or clinical studies. Hence we ended up with 8 compounds: actinomycin D, volasertib, alisertib, MLN0128, decitabine, and panobinostat, along with the topoisomerase inhibitors doxorubicin and topotecan (Fig. 2B). To investigate the mechanism of action of the top compounds, we performed cell viability and caspase-3/-7 activity assays over a time course of 72 hours after treatment of the cells. For all compounds we found a reduced cell viability accompanied by an increased caspase-3/-7 activity during the entire time course (Fig. 2C, E). Apoptotic activity was confirmed by annexin and 7-aminoactinomycin D flow cytometry (Supplementary Figure S4A–F) and by western blot analysis of Bcl-2-associated X protein and cleaved poly(ADP-ribose) polymerase (Supplementary Figure S4G–L). For alisertib and volasertib we found an accumulation of cells in G2/M phase 72 hours after drug treatment (Supplementary Figure S4M, N). To investigate the effect of selected drugs on colony formation we performed a soft-agar colony formation assay and observed a strong reduction in colony formation for all drugs (Fig. 2D). Finally, we verified the mechanism of action of the drugs by immunoblotting of their specific targets. Both topoisomerase inhibitors topotecan and doxorubicin led to an increase in phosphorylation of histone H2A.X, a marker for DNA double-strand breaks (Supplementary Figure S5A–D). As expected, volasertib reduced expression of PLK1–3 (Supplementary Figure S5E–H). Alisertib reduced phosphorylation of aurora kinase A and MYCN expression (Supplementary Figure S5I–L). MLN0128 reduced 4EBP1 and phospho-4EBP1, a downstream target of the mTOR pathway (Supplementary Figure S5M–O). Altogether, our drug screen showed that only a few of the conventional chemotherapeutics used in pediatric neuro-oncology kill ETMR cells at low concentrations, like actinomycin D, vincristine, and doxorubicin, but we identified several potential new compounds for therapy, like topoisomerase I, aurora kinase A, and PLK1 inhibitors.
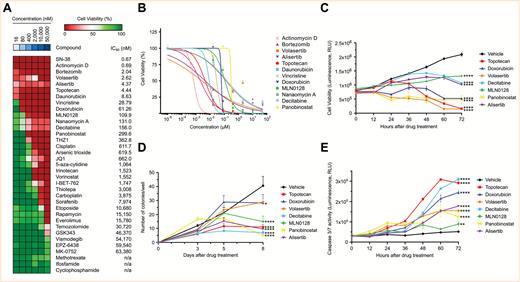
Drug screen in BT183 cells identifies inhibitors of topoisomerase, mTOR pathway, and MYCN and demethylating agents as potent drug candidates. (A) Heatmap of 35 tested compounds in BT183 cells. Tested drug concentrations are sorted incrementally from left to right. Inhibitors and their respective IC50 values are listed on the right. n/a indicates that the IC50 could not be determined. Cell viability >50% is shown in green shades and <50% in red shades. Drugs are sorted from top to bottom by their IC50 in BT183 cells. (B) IC50 curves of the top drug candidates of the screen with an IC50 < 300 nM. Time course cell viability (C), colony-formation assay (D), and caspase-3/-7 assay (E) for treatment of topotecan, volasertib, MLN0128, alisertib, doxorubicin, panobinostat, and decitabine in BT183 cells over 72 hours after drug application. * P < 0.05, ** P < 0.01, *** P < 0.001, ***** P < 0.0001.
Monotherapy of Potent Inhibitors in ETMR Xenograft Mice
The potential inhibitory effects of the 8 selected compounds was further tested in vivo in our BT183 xenograft model. NSG mice were transplanted intracranially with 1 × 10⁵ GFP-luciferase–labeled BT183 cells and tumor growth was monitored weekly via bioluminescence imaging. As an interventional approach, treatments were started when mice had tumors with a luciferase signal of at least 1 × 106 pixel/second. Treatment with topotecan, volasertib, and actinomycin D resulted in a significant increase in median survival of 55.5, 40, and 39 days, respectively, compared with 24 days of median survival in the vehicle group (Fig. 3A, B). Other compounds that showed a slight but not significant increase in survival included MLN0128, alisertib, doxorubicin, vincristine, and panobinostat (Fig. 3A, B). For the decitabine treatment we encountered major toxicities in the animals even at low doses, resulting in shorter survival compared with the vehicle-treated animals (Fig. 3A). For panobinostat and alisertib we encountered signs of toxicity only at a later stage of treatment, suggesting that long-term treatment is not tolerable in these mice. The mode of application of MLN0128 (per os) was also not well tolerated and 2 animals had to be sacrificed early in treatment. Growth kinetic analyses of tumors showed that treatment with topotecan, volasertib, and actinomycin D initially resulted in a strong reduction of tumor growth, but tumors eventually grew again (Fig. 3C–E). In summary, our in vivo data suggest that topotecan, volasertib, and actinomycin D monotherapies are sufficient to induce an initial partial response on tumor growth and prolong survival of orthotopic ETMR xenograft mice.
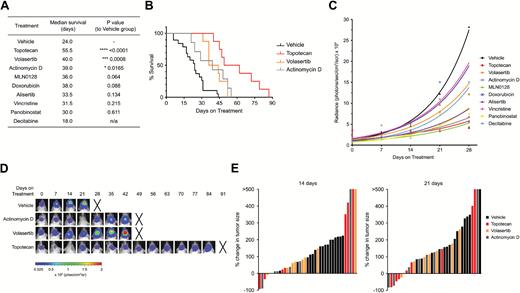
Monotherapy of topotecan, volasertib, and actinomycin D significantly prolong survival in ETMR BT183 xenograft mice. (A) Table of median survival of xenograft animals in the different treatment cohorts: vehicle (n = 18), topotecan (n = 8), volasertib (n = 8), actinomycin D (n = 7), doxorubicin (n = 6), MLN0128 (n = 8), alisertib (n = 4), vincristine (n = 6), panobinostat (n = 4), decitabine (n = 4). (B) Kaplan–Meier curve of the vehicle, topotecan, volasertib, and actinomycin D treatment cohorts. (C) Growth curve of bioluminescence signal per treatment group. (D) Bioluminescence images of representative mice for the vehicle, topotecan, volasertib, and actinomycin D cohort. Xs denote animals euthanized before they could be imaged again. (E) Waterfall plots for progression of tumor growth 14 and 21 days after treatment start for vehicle, topotecan, volasertib, and actinomycin D treatment. Every bar represents one animal. P-values for survival of animals were determined by log-rank (Mantel–Cox) test.
Drug Synergy Analysis in BT183 Cells
Since we did not observe a complete response in our xenograft model, we wanted to test for synergistic drug combinations in BT183 cells. We performed an in vitro drug combination screen and tested several drug combinations among the top compounds plus a few of the conventional chemotherapeutics. Overall, 25 combinations were tested, but for 23 of these we did not find a synergistic effect (Supplementary Table S2). For combinations among our best-performing in vivo compounds, topotecan and volasertib, actinomycin D and volasertib, we could not see a synergistic effect in vitro (Fig. 4A, B). But the combination of actinomycin D and topotecan was synergistic (Fig. 4C). A significant reduction of the IC50 for actinomycin D was observed in the presence of topotecan (Fig. 4D), and the IC50 for topotecan was significantly reduced in the presence of actinomycin D (Fig. 4E). The combination of topotecan and decitabine was also synergistic and the IC50 for decitabine was significantly reduced in the presence of topotecan and vice versa (Fig. 4F–H). Unfortunately we were unable to test the synergistic effect of topotecan and decitabine in our xenograft mice, because of the very strong toxicity of decitabine in our NSG mice even at low concentrations. For the combination of topotecan with actinomycin D, dosing tests in our xenograft are needed to avoid severe toxicity under long-term treatment with actinomycin D.
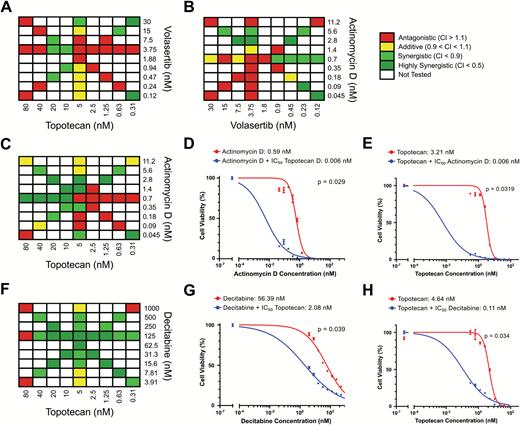
Synergistic effects in vitro in BT183 cells. BT183 cells were treated with the indicated concentrations of topotecan and volasertib (A), actinomycin D and volasertib (B), actinomycin D and topotecan (C), decitabine and topotecan (F). IC50 curves of BT183 cells treated with indicated concentrations of actinomycin D and 5 nM topotecan (D) or indicated concentrations of topotecan and 0.7 nM actinomycin D (E). IC50 curves of BT183 cells treated with indicated concentrations of decitabine and 5 nM topotecan (G) or indicated concentrations of topotecan and 125 nM decitabine (H).
Multi-Agent Chemotherapy in ETMR Xenograft Mice
Since our drug screen showed good responses in vitro and in vivo for several topoisomerase inhibitors, we wanted to further investigate the potential therapeutic effect of 2 of these, topotecan and doxorubicin, in a multi-agent treatment setting. Topotecan is currently being applied in pediatrics for soft-tissue sarcoma but is rarely used for brain tumors so far, while doxorubicin is thought to play an important role in the treatment of rhabdoid tumors, such as atypical teratoid rhabdoid tumor (AT/RT).12,13 The efficacy of these 2 drugs was tested in a multimodal treatment regimen in combination with the conventional chemotherapeutics vincristine and methotrexate in a 2-week schedule (Fig. 5A). Vincristine is the only conventional chemotherapeutic that showed a very good IC50 in our in vitro screen, and methotrexate is currently applied as a backbone in a clinical trial for recurrent or progressive malignant brain tumors, including AT/RT and ETMR (NCT02684071). This treatment schedule was repeated until animals showed signs of toxicity or were moribund. In the topotecan combined chemotherapy (TCC) group, animals had a significantly longer survival compared with animals in the doxorubicin combined chemotherapy (DCC) group (Fig. 5B, C). Moreover, in both treatment regimens we saw an improvement in survival compared with the monotherapy treatments (Figs. 3A–B, 5B–C). DCC-treated mice had a median survival of 34 days, whereas the doxorubicin monotherapy showed a median survival of only 27.5 days. For TCC mice, the median survival was 68 days compared with 55.5 days in topotecan monotherapy treatment. Furthermore the tumor growth in TCC mice was slower than in DCC mice detected by bioluminescence imaging (Fig. 5D–F).
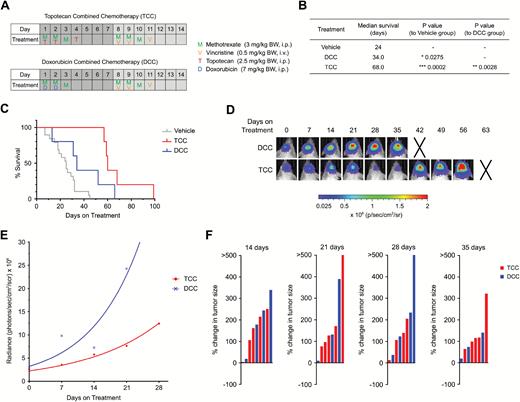
Multi-agent chemotherapy with topotecan shows better survival than doxorubicin multimodal chemotherapy. (A) Treatment regimen with doxorubicin combination chemotherapy (DCC) and topotecan combination chemotherapy (TCC). (B) Table of median survival of vehicle, DCC, and TCC treatment cohorts. (C) Kaplan–Meier curve of DCC (n = 5) and TCC (n = 5) treated mice. (D) Bioluminescence images of representative mice for the DCC and TCC cohort. Xs denote animals euthanized before they could be imaged again. (E) Growth curve of bioluminescence signal per treatment group. (F) Waterfall plots for progression of tumor growth 14, 21, 28, and 35 days after treatment start. Every bar represents one animal. P-values for survival of animals were determined by the log-rank (Mantel–Cox) test.
Validation of Drug Candidates in PDX-Derived NCH3602 ETMR Cells
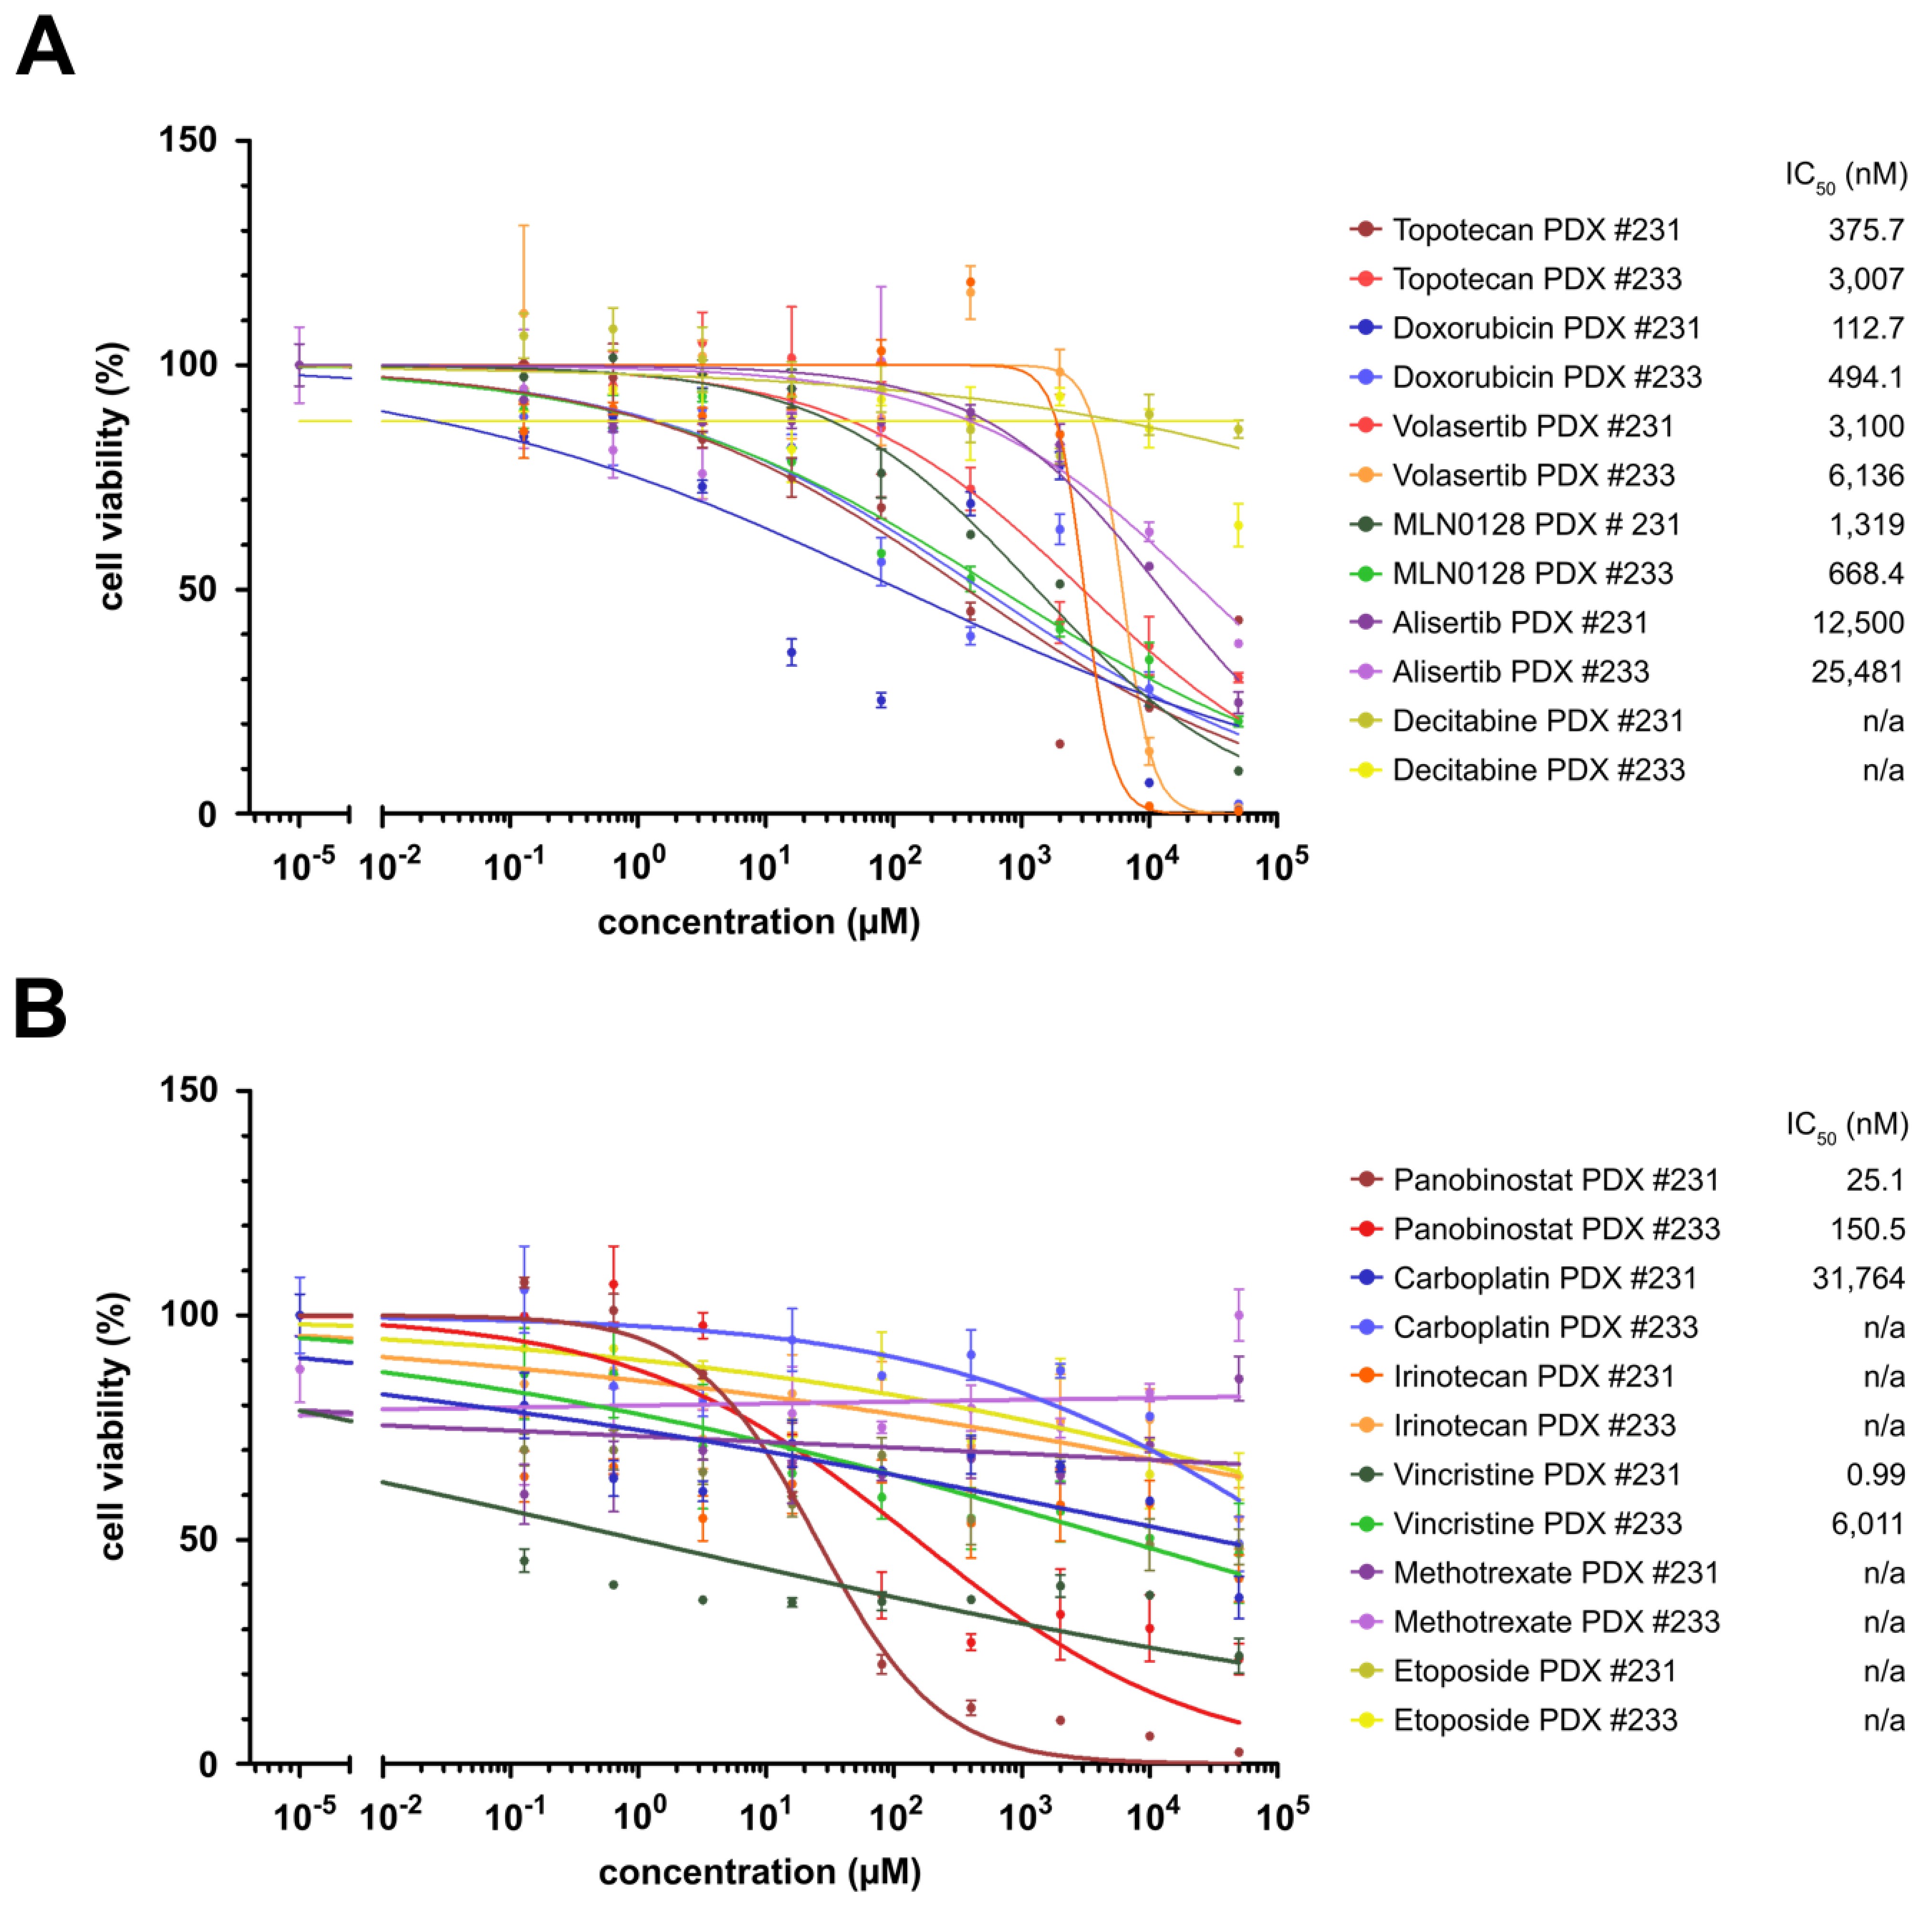
To validate our drug screening results, we used our ETMR PDX model NCH3602. We obtained 2 PDX tumors from transplantation of the patient-derived tumor cells and performed an in vitro drug screen with the dissociated tumor cells after sacrificing the animals. We tested efficacy of our top compounds and standard chemotherapeutic drugs and could show a very good drug response with vincristine, panobinostat, doxorubicin, and topotecan, all with an IC50 well below 500 nM (Fig. 6 and Supplementary Figure S6A, B). MLN0128 and volasertib also had a good response, with an IC50 of 1319 nM and 3100 nM, respectively. The standard chemotherapeutics, such as carboplatin, etoposide, and methotrexate showed no response in NCH3602 cells, confirming our results in the screen with the BT183 cells. Surprisingly, alisertib and decitabine, both effective at low concentrations in BT183 cells, showed only a low or no effect at all in NCH3602 cells. The changes of IC50 in this screen compared with our initial screen are probably due to a heterogeneous cell population in the wells, including the presence of murine cells, and a suboptimal condition of the cells, due to the tumor cell isolation. Still, we could confirm most of our screening results in this new ETMR cell source supporting our findings that topoisomerase I and II, PLK1, and mTOR inhibitors and epigenetic compounds are promising drug candidates in ETMR.
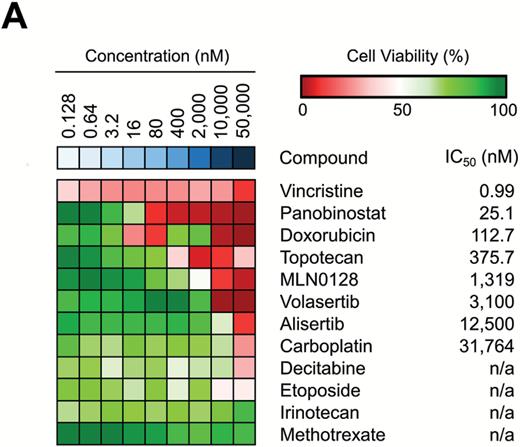
In vitro drug screen in a new ETMR patient-derived xenograft model confirms efficacy of drug candidates. (A) Heatmap of drug screen in NCH3602 cells. Tested drug concentrations are sorted incrementally from left to right. Inhibitors and their respective IC50 values are listed on the right. Cell viability >50% is shown in green shades and <50% in red shades. n/a indicates that the IC50 could not be determined.
Discussion
Despite the aggressive chemotherapeutic intervention in ETMR patients, we are still facing a very poor clinical outcome and there is a need to reconsider and reevaluate current treatment protocols. A previous study from Spence et al already identified several potential drug candidates, including mTOR/phosphatidylinositol-3 kinase/insulin-like growth factor 1 receptor, topoisomerase, and histone deacetylase inhibitors, but these were only tested in vitro.7 To follow up on this study and to validate potential ETMR-specific drug targets, we have performed a detailed preclinical in vitro and in vivo drug screen with the BT183 cell line and in the new PDX cells NCH3602. In line with the study by Spence et al, we also identified topoisomerase inhibitors, histone deacetylase inhibitors, and compounds targeting the mTOR pathway to be effective in vitro at low concentrations, but we also identified several other candidate drugs like actinomycin D, alisertib for aurora kinase inhibition, and volasertib for PLK1 inhibition. Based on past clinical experience, it was not surprising that most of the conventional chemotherapeutics in our screen had no or little effect on the BT183 cells. Notably, actinomycin D, doxorubicin, and topotecan, all effective at low nanomolar concentrations in vitro, significantly increase survival of mice in single or multi-agent treatments, but none is applied in ETMR patients to date. One of the new drugs identified in the in vitro screen was the PLK1 inhibitor volasertib, which also significantly increased survival of mice and slowed down tumor growth in comparison to vehicle-treated animals. However, eventually all tumors progressed under the various treatments, suggesting that drugs identified in our study should be combined with other compounds or treatment modalities. In vitro we found a synergistic effect for the combination of topotecan and decitabine, and of topotecan and actinomycin D. Both are promising drug combinations for future preclinical and clinical studies. We were unable to study the effect of topotecan and decitabine in vivo due to the severe toxicity of decitabine in the NSG mice. It is possible that the observed toxicity is mouse strain related, because decitabine is used already in pediatric therapies—for example, in high-risk relapsed or refractory acute myeloid leukemia.19
Treating ETMR xenograft animals with a multimodal chemotherapy including methotrexate, vincristine, and topotecan or doxorubicin resulted in an increased survival for both treatment regimens compared with the vehicle animals. Most importantly, topotecan multimodal chemotherapy performed better than the doxorubicin multimodal chemotherapy, indicating that topotecan, as a topoisomerase I inhibitor, might be the better choice than doxorubicin in a multimodal ETMR treatment, even as an upfront medication alone. Also SN-38, the active metabolite of irinotecan, a topoisomerase I inhibitor as well, performed very well in our in vitro drug screen and should be considered for future preclinical testing. The overall good performance of topoisomerase inhibition in ETMR cells might indicate a loss or impairment of DNA strand break repair function in ETMR, which will be of high interest for further work studying ETMR biology.
Our study also highlighted the treatment potential of some of the epigenetic drugs such as panobinostat and decitabine, and targeted drugs like MLN0128 for mTOR inhibition and alisertib for aurora A kinase inhibition. Due to toxicity issues and difficulties in drug application in NSG mice for decitabine, panobinostat, and MLN0128, we were unable to see a possible benefit in tumor-bearing mice. The in vivo efficacy of these drugs needs to be followed up in a more detailed toxicity screen, probably even in other mouse strains that are less sensitive to the compounds. Two other drug candidates shown to be very effective in vitro, bortezomib and nanaomycin A, might be of high interest for future treatment strategies in ETMR patients. Unfortunately bortezomib does not pass the blood–brain barrier.20,21 Nanaomycin A, a specific DNMT3B inhibitor, has not been tested by us in vivo yet, because of unknown dosing schedules and no experience in preclinical and clinical studies. DNMT3B expression is exclusively high in ETMR and has been implicated already in the downstream signaling pathway of the TTHY1-C19MC fusion and amplification of the miRNA cluster, which makes it a good potential candidate for ETMR treatment.5
In conclusion, we have demonstrated that ETMRs are very sensitive to PLK1 inhibition by volasertib, topoisomerase I and II inhibition by topotecan and doxorubicin, and the transcription inhibitor actinomycin D. All these drugs are already approved or in clinical trials for malignancies in pediatric oncology, and priority should thus be given to include them in multimodal therapies in future clinical trials for ETMR patients. Interestingly, a phase II clinical trial in pediatric neuro-oncology has already been started testing the use of methotrexate, cyclophosphamide, and topotecan in recurrent or progressive malignant brain tumors, including AT/RT and ETMR (NCT02684071). Still, more preclinical studies are needed and other drug combinations and treatment modalities have to be evaluated. Including topotecan, volasertib, and actinomycin D in current therapies is an important first step to potentially improve the clinical course of ETMR patients.
Supplementary Material
Supplementary material is available at Neuro-Oncology online.
Funding
This work was partially supported by Targeting of Resistance in PEDiatric Oncology (TORPEDO) TRANSCAN project (BMBF funded), project number 01KT1605.
Conflict of interest statement. The authors declare no competing financial interest or patent filing.
Acknowledgments
We thank the animal facility and animal imaging facility of the German Cancer Research Center (DKFZ) Heidelberg for their support during this work. We also thank Katja von Hoff (University Medical Center Hamburg, Germany) for her clinical and scientific advice during the progress of this project.
References


