How Slow Rock Weathering Balances Nutrient Loss During Fast Forest Floor Turnover in Montane, Temperate Forest Ecosystems
 David Uhlig
 Friedhelm von Blanckenburg
- 1GFZ German Research Centre for Geosciences, Section Earth Surface Geochemistry, Potsdam, Germany
- 2Institute of Geological Sciences, Freie Universität Berlin, Berlin, Germany
Mineral nutrient cycling between trees and the forest floor is key to forest ecosystem nutrition. However, in sloping, well-drained landscapes the forest floor experiences permanent nutrient loss in particulate form by plant litter erosion and as solute after plant litter decomposition, solubilisation, and export. To prevent nutrient deficit, a replenishing mechanism must be in operation that we suggest to be sourced in the subsoil and the weathering zone beneath it, provided that atmospheric input is insufficient. To explore such a mechanism, we quantified deep (up to 20 m depth) weathering and mineral nutrient cycling in two montane, temperate forest ecosystems in Southern Germany: Black Forest (CON) and Bavarian Forest (MIT). From measurements of the inventories, turnover times, and fluxes of macronutrients (K, Ca, Mg, P) we found evidence for a fast, shallow “organic nutrient cycle”, and a slow, deep “geogenic nutrient pathway”. We found that the finite nutrient pool size of the forest floor persists for a few years only. Despite this loss, foliar nutrient concentrations in Picea abies and Fagus sylvatica do not indicate deficiency. We infer that ultimately the biologically available fraction in the deep regolith (CON: 3–7 m, MIT: 3–17 m) balances nutrient loss from the forest floor and is also decisive for the level of the forest trees' mineral nutrient stoichiometry. Intriguingly, although the nutrient supply fluxes from chemical weathering at CON are twice those of MIT, nutrient uptake fluxes into trees do not differ. The organic nutrient cycle apparently regulates the efficiency of nutrient re-utilization from organic matter to cater for differences in its replenishment by the deep geogenic nutrient pathway, and thereby ensures long-term forest ecosystem nutrition.
Introduction
A fundamental feature of forest ecosystems is that for most rock-derived nutritive elements demand by forest trees vastly exceeds mineral nutrient supply from chemical weathering and atmospheric deposition. Thus, trees have evolved sophisticated nutrition strategies to satisfy their nutrient demand and to prevent nutrient limitation (e.g., Elser et al., 2007; Vitousek et al., 2010; Augusto et al., 2017). Several nutrient acquisition, storage and allocation strategies have been suggested (Aerts and Chapin, 1999) that all contribute to satisfy nutrient demand through a cycle, that we call here the “organic nutrient cycle”. The most common strategy is efficient re-utilization of organic-bound nutrients from plant litter in the forest floor (e.g., Jobbágy and Jackson, 2004; Lang et al., 2016). In fact, the fast turnover of the forest floor ensures forest ecosystem nutrition. Because organic-bound nutrients are not directly utilizable by plants (George et al., 2011; Jansa et al., 2011), microbial activity is central in ensuring the fast turnover (e.g., Lang et al., 2016). For example, mycorrhizal fungi promote the breakdown of organic matter into plant-available inorganic forms that are subsequently taken up by tree roots (e.g., Chapin et al., 2012).
But, in sloping, well-drained landscapes that characterize large parts of the global land surface, the forest floor experiences permanent loss of organic-derived nutrients by plant litter erosion (Scatena and Lugo, 1995; Heartsill Scalley et al., 2012) and leaching (e.g., Moore et al., 2005; Chaudhuri et al., 2007). Somehow surprisingly, only very few studies have explored erosional nutrient loss. For example, in the well-characterized tropical Bisley Experimental Watershed (Luquillo, Puerto Rico), erosional plant litter export accounts for the two most plant-essential mineral nutrients phosphorus (P) and potassium (K) to 0.04 mg m−2 yr−1 (P) and 0.2 mg m−2 yr−1 (K) (Heartsill Scalley et al., 2012). This estimate is likely too low by some orders of magnitude as compared to temperate, not P-limited ecosystems, given that in these tropical, frequently P-limited ecosystems plant litter is often of low quality (low nutrient concentration) (Chapin, 1980). Much better estimates exist for forest floor leaching fluxes. These amount to about 10–1,000 mg m−2 yr−1 for P and to about 300–4,000 mg m−2 yr−1 for K (Cole and Rapp, 1981; Yavitt and Fahey, 1986; Qualls et al., 1991; Cortina and Vallejo, 1995; Berger et al., 2009). Even though these forest floor leachates may be directly re-utilized by plants and thus do not represent export fluxes per se, a substantial fraction of these solubilised mineral nutrients nevertheless percolates downwards into the mineral soil beneath the rooting depth. For example, Kaiser et al. (2003) showed that up to about 70% (38 mg m−2 yr−1) of dissolved organic P (DOP) leached from the forest floor infiltrated to depth. Furthermore, Gorham et al. (1979) emphasized the downward movement of dissolved weathering products beneath the rooting zone, thereby becoming unavailable to the ecosystem. Comparing these estimates of nutrient loss from the forest floor with estimates of their inventory in the forest floor, it becomes apparent that within only a few years this nutrient pool is exhausted (Wilcke et al., 2002).
To replace this loss, atmospheric deposition has been invoked. This source is particularly pertinent for tropical, non-eroding ecosystems (Chadwick et al., 1999). But even in some temperate, eroding forest ecosystems, external atmospheric dry deposition has been suggested to represent a significant nutrient source (e.g., Aciego et al., 2017). However, other studies have suggested that in this latter case the nutrient loss flux exceeds the replacement flux from atmospheric dry deposition by a factor of a few (Uhlig et al., 2017) such that atmospheric inputs fail to prevent the development of nutrient limitation.
Thus, a pathway represented by the slow release of “new” mineral nutrients from the mineral soil and bedrock by chemical weathering has been suggested as a further nutrient acquisition strategy to counterbalance loss from the “leaky” forest floor (e.g., Cleveland et al., 2013). Because this pathway is rock-sourced and also operates over millennia (Buendía et al., 2010), we here call this second mechanism the “geogenic nutrient pathway”. This pathway operates as follows: In landscapes that have attained steady state between the formation of regolith at depth, dissolved loss of nutrients by leaching, and the removal of the remaining nutrient-depleted soil by erosion at the surface, the topmost soil experiences a continuous renewal of mineral nutrients from the bedrock source that transit upwards from the weathering front into topsoil (e.g., Vitousek et al., 2003; Wardle et al., 2004b; Porder et al., 2007; Peltzer et al., 2010). Critical to this concept, however, is whether these bedrock-sourced mineral nutrients (a) have survived mineral dissolution at depth prior to arriving in the rooting zone; (b) are available in the dissolved or readily plant-available form after abiogenic mineral dissolution in the rooting zone; (c) are in a mineralogical form that can be directly accessed by roots and their associated microorganisms. In the simplest terms chemical weathering taking place in processes (a) and (b) requires water flow and thus porosity (Brantley and Lebedeva, 2011), protons supplied by carbonic acid in water, microbial respiration of CO2, or sulfide oxidation (Brantley et al., 2007), and sufficient fluid flow to dissolve primary minerals (Maher, 2010). For process (c) for example, a high amount of mineral nutrients in the regolith does not necessarily satisfy nutrient demand of forest trees if the nutrient in question is strongly bound to solids and hence inaccessible to forest trees (Walker and Syers, 1976) such as P is frequently occluded to Fe- and Al-containing sesquioxides (Brady and Weil, 2002) or K that is hosted in potash feldspar with low mineral dissolution kinetics (Chaudhuri et al., 2007). However, even if abiogenic dissolution of these minerals is slow, microorganisms such as arbuscular and ectomycorrhizal fungi can access such minerals nevertheless (e.g., Jongmans et al., 1997; Parniske, 2008).
That bedrock-derived nutrients are important to sustain long-term forest ecosystem nutrition was recently highlighted by Houlton et al. (2018) who show that nutrient supply by rock weathering plays an important role in forest ecosystem nutrition even for nitrogen that is otherwise fixed from atmospheric sources. Also, bedrock P concentrations exert an ecological control (Hahm et al., 2014). Still, compared to the organic nutrient cycle this bedrock-derived flux is small. Cleveland et al. (2013) for example suggested that geogenic P may supply only as little as 2% P to terrestrial net primary productivity (NPP), the remainder stemming from recycling. Similarly Wilcke et al. (2017) demonstrated the dominance of the biological over the geogenic control on nutrient fluxes in tropical forest ecosystems. Thus, weathering-derived nutrients are considered to sustain long-term ecosystem nutrition, even though they present only a small fraction of the net nutrient source to forest ecosystems. Consequently, the deep weathering zone gains increasing interest in advancing our understanding on how chemical and physical processes both operating at depth are coupled to biotic processes operating in the upper Critical Zone. Yet this field has not advanced further because we lacked the means to establish the budgets involved.
Suggesting such novel strategies for quantifying nutrient cycling into, from, and within forest ecosystems is the aim of this study. Key to this attempt is introducing metrics designed in weathering geochemistry into the fields of ecology and pedology. As the suite of geochemical metrics presented in this paper integrate over timescales that differ substantially from those over which ecological properties are measured, we do not draw refined conclusions from these comparisons. Rather, we use metrics for concept development, and thus evaluate them mainly by comparing orders of magnitude.
We provide quantitative means to assess the importance of the slow “geogenic nutrient pathway” through which fresh material is uplifted into soil, and that is coupled to the fast “organic nutrient cycle” on long-term forest ecosystem nutrition similar to the conceptual model of Buendía et al. (2010). While on short timescales the organic nutrient cycle appears to be highly efficient, over millennia, nutrient losses from the organic nutrient cycle must be balanced by nutrient uptake via the geogenic nutrient pathway. To underpin this hypothesis, we have undertaken a case study to parameterise all components of the system in two mountainous catchments. These sites were chosen because even though they strongly differ in their nutrient supply fluxes through rock weathering, they are characterized by similar forest primary productivity. We quantified nutrient cycling in forest ecosystems across several reservoirs of the Critical Zone: these extend from the unweathered bedrock that was accessed at up to 30 m depth by drilling, up to the tissue of trees. As a prerequisite for the way by which we apply these geo- and biogeochemical measurements for hypothesis evaluation, we developed a conceptual framework including a series of simple mass balance equations that combine nutrient fluxes, inventories and turnover times.
Conceptual Framework
Consider a forest ecosystem extending from the top of the vegetation canopy down to unweathered bedrock from a conceptual standpoint (Figure 1), a zone now commonly termed the “Critical Zone” (Brantley et al., 2007; Lin, 2010). Each box in Figure 1 represents a compartment of the forest ecosystem comprising a nutrient inventory and a nutrient turnover time. The turnover time is calculated as the inventory of a given compartment divided by a nutrient input or output flux and describes the mean time a constituent spends in the respective compartment after entry and before exit (Sierra et al., 2017). In explaining the conceptual framework, we follow a given nutrient from its bedrock source through forest trees to the forest floor. In doing so we parameterise nutrient fluxes and inventories in the geogenic nutrient pathway and the organic nutrient cycle to be able to quantify turnover times. A glossary on the metrics used throughout this paper is provided in Table 1 and more detailed information on the calculation and limitations of the metrics is given in section Calculation of Fluxes and Inventories in Forest Ecosystems.
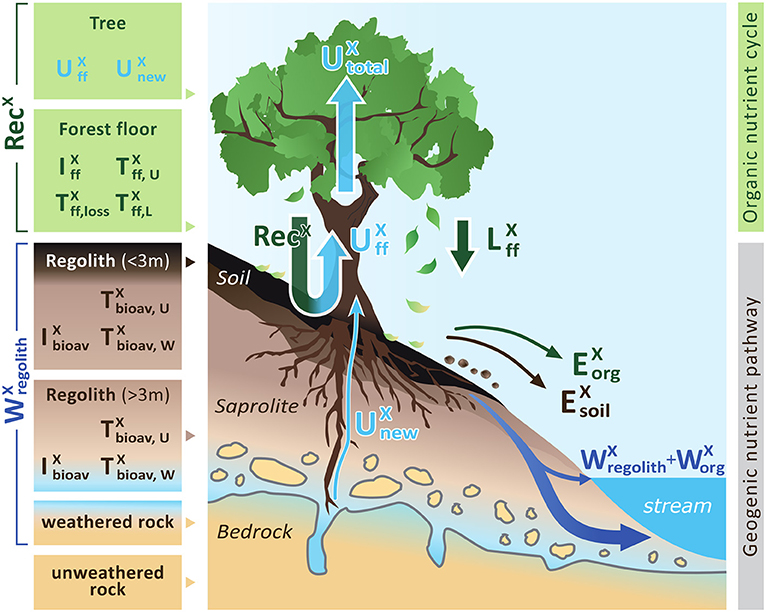
Figure 1. A conceptual forest ecosystem comprising the “geogenic nutrient cycle” which is mainly effected by nutrient release through chemical weathering () and the “organic nutrient pathway” which is mainly effected by nutrient re-utilization (recycling) from organic matter (RecX). Individual compartments are presented as boxes including the metrics used to quantify their properties: nutrient inventory (I) and nutrient turnover time (T) of element X. The first subscript refers to the ecosystem compartment (“ff” denotes forest floor, “bioav” denotes the biologically available fraction and “regolith” denotes soil, saprolite and weathered rock, respectively). The second subscript refers to the flux used to calculate the respective turnover time (“U” denotes nutrient uptake, “L” denotes litterfall, “W” denotes chemical weathering). Compartments are linked by fluxes (arrows), where the thickness of the arrows indicates the relative proportions. Fluxes include nutrient uptake (U), chemical weathering (W), erosion (E) of soil or organic matter (org), and litterfall (L). “Rec” denotes nutrient recycling. Detailed information on the metrics is provided in Table 1. Figure is not drawn to scale.
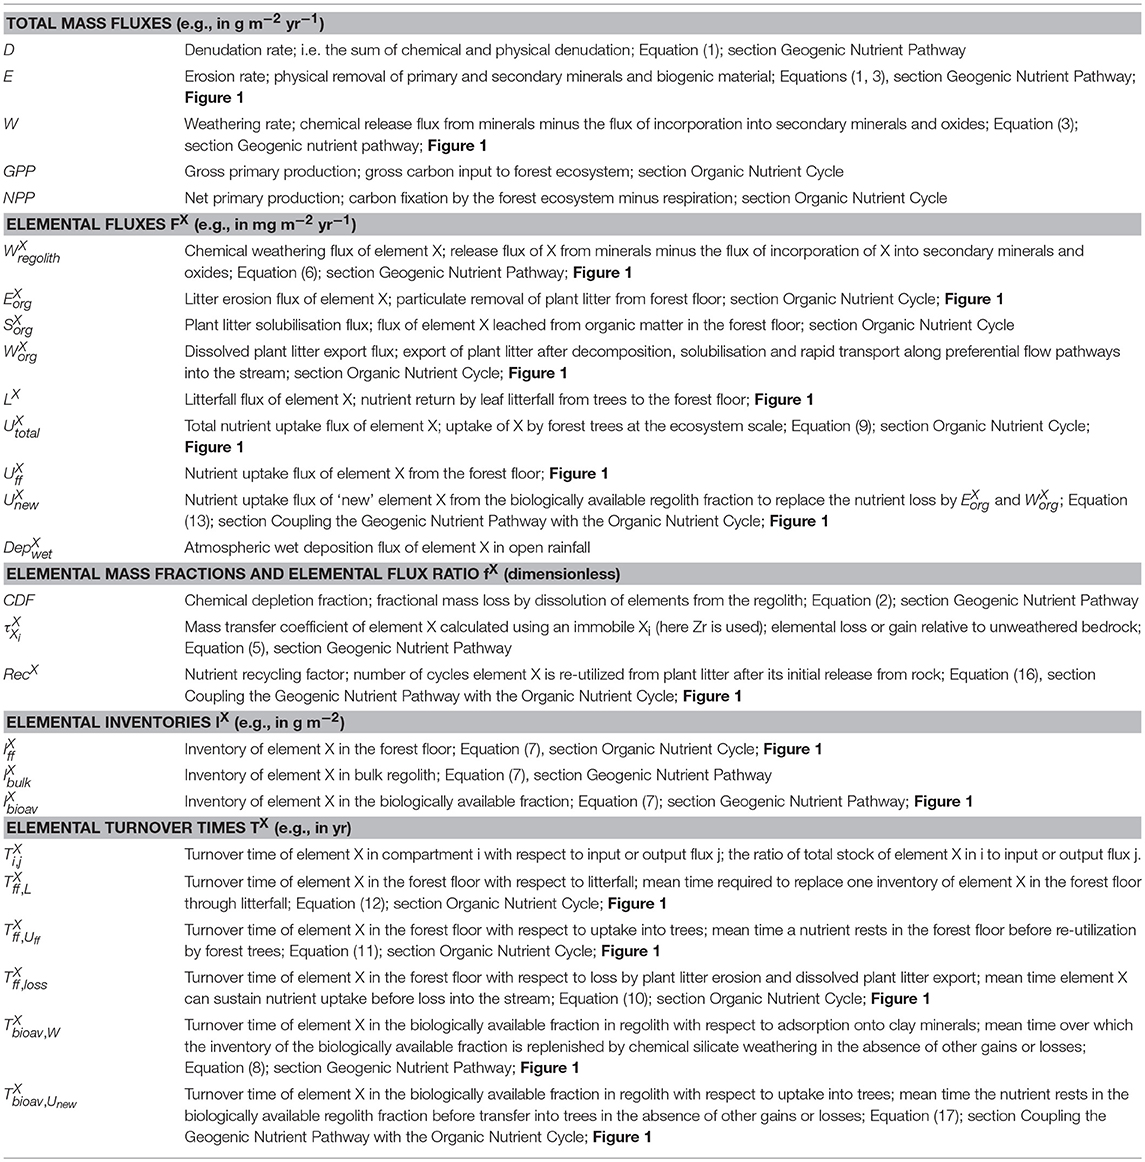
Table 1. Glossary of metrics.
For the geogenic cycles we assume steady state of fluxes and hence compartment sizes that do not vary with time. This requirement is integral to the method used to determine fluxes, namely cosmogenic nuclides, and is thus inevitable. But even if this assumption is not strictly valid, deviation from steady state will be minor given the slow response times that are ca. 104 years for the geogenic cycle. In contrast, for the organic cycles we do not assume steady state, and thus allow the inbound flux to differ from the outbound flux for a given compartment. Hence the resulting turnover time estimates may depend on the respective flux. Still, even for the organic compartments, some form of quasi-steady state is required to prevent ecosystem limitation that might develop if a compartment were to run into depletion.
Geogenic Nutrient Pathway
The geogenic nutrient pathway is characterized by the conversion of bedrock into regolith—defined here to comprise weathered rock, saprolite and soil. This pathway encompasses regolith production, nutrient release from primary and secondary minerals by chemical weathering, lateral and vertical transport of dissolved species through the regolith and groundwater aquifers which ultimately drain into a stream or lake, erosion of remaining solids, and for the remainder nutrient utilization by forest trees.
Fluxes
At the weathering front unweathered bedrock is converted into regolith by regolith production (RP). At steady state RP is coupled to the total mass loss from the weathering profile (e.g., Heimsath et al., 1997; Lebedeva et al., 2010), so as to maintain a constant thickness of regolith. Total mass loss comprises both particulate matter (physical erosion, E) and dissolved material (chemical weathering, W), and the combined mass loss flux is the denudation flux D (Equation 1). This denudation flux can be determined, for example, by cosmogenic nuclides such as in situ 10Be (section Calculation of Fluxes and Inventories in Forest Ecosystems).
An estimate of the time-integrated total amount of elements (X) in the dissolved form in this process can be made from the chemical depletion fraction (CDF). The CDF uses the relative enrichment of an inert mineral's refractory element (Xi) compared to parent bedrock to quantify the relative dissolved mass loss in the regolith. For this purpose, we ratio the concentration of such a chemically immobile element ([Xi]) (Merrill, 1906; Barth, 1961) in unweathered parent bedrock (p) to its concentration in weathered regolith (r) (Brimhall and Dietrich, 1987; Riebe et al., 2003) in Equation (2). A CDF-value of 0 indicates no chemical depletion, while a CDF-value of 1 would mean that parent bedrock dissolution has run to completion. In reality, since quartz and secondary precipitates remain even in heavily weathered regolith the global observed maximum CDF approaches a value of 0.5 to 0.7, depending on bedrock mineralogy (Dixon and von Blanckenburg, 2012).
The chemical weathering flux can be disentangled from total denudation by multiplying the CDF by D (Riebe et al., 2003) (Equation 3). Accordingly, E can be calculated from the difference between D and W (Equations 1, 3).
Absolute mass fluxes can be expressed as elemental fluxes, which form the basis to assess the cycling of mineral nutrients between forest ecosystem compartments. For example, RP is expressed as RPX by multiplying RP with the concentration of the element of interest (X) in unweathered parent bedrock (Equation 4).
Chemical weathering of bedrock and regolith releases elements dissolved from primary minerals into solution. A dissolved element X may follow one of three paths: it may be exported as solute via the stream, it may be utilized by forest trees, or it may be incorporated into or adsorbed onto secondary minerals or (oxy-)hydroxides. An estimate of the time-integrated total amount of an individual element following the first two paths can be made based on the elemental mass transfer coefficient (). quantifies the relative loss or gain of element X in the weathering zone and provides a maximum estimate of dissolved nutrients available to forest trees, as some solute can be lost into the stream prior to uptake. Specifically, is the concentration ratio of a chemically immobile element ([Xi]) to a chemically mobile element of interest ([X]) in parent bedrock and the regolith (Equation 5) (Brimhall and Dietrich, 1987; Anderson et al., 2002). If is negative, a fraction of element X was lost by mineral dissolution. Conversely, if is positive, a fraction of element X was added by admixing of organic matter or external atmospheric inputs into the regolith, or by translocation of elements through nutrient uplift and recycling. Also, can be positive if elements (e.g., Al, Fe, Mn) are mobilized as solute or colloid from topsoil and re-precipitate as secondary precipitates or deposit at depth after vertical translocation (e.g., Brantley and Lebedeva, 2011). If is zero, neither loss nor gain occurred, and unweathered parent bedrock is present, or inputs are balanced by outputs.
The elemental chemical weathering flux () provides the time-integrated dissolution flux of element X from primary minerals minus the incorporation flux of X into secondary minerals and (oxy-)hydroxides formed in the regolith. is inferred from the total denudation flux, the mass transfer coefficient () and the concentration of element X in unweathered parent bedrock by multiplying Equation 4 with the negative of Equation 5 (Equation 6).
The fraction of which is not involved in secondary mineral or (oxy-)hydroxide formation is either drained into the stream or utilized by vegetation, from which it can also be drained into the stream after solubilisation from litter.
Inventories
The inventory of element X provides a metric on the total stock of element X in the regolith. This inventory in compartment j (), where j denotes bulk regolith (bulk), the forest floor (ff), or the biologically available fraction of regolith (bioav), is calculated by the integral of the depth interval's concentration of element X in compartment j ([X]j), the soil density (ρ) and the thickness (dz) of the respective depth interval (Equation 7).
Turnover Times
Following the terminology suggested for terrestrial ecosystem ecology by Sierra et al. (2017) and Spohn and Sierra (2018) the turnover time is a quantification of the capacity of an ecosystem to store and cycle an element. In other words, the turnover time of element X in compartment j represents the mean time an element X remains in a given compartment before being transferred from this source compartment into another compartment. In this sense it may be considered analogous to the concept of a residence time in hydrology or geochemistry. Turnover time can thus be defined as the ratio of the inventory of a compartment (pool) to the input flux into the pool or output flux from the pool. We do not require the balance of inbound and outbound fluxes and thus do not assume the steady state of inventories. Yet, over the timescale of a few turnover times the fluxes must attain some balance to avoid total depletion. The total turnover time in the compartments we consider is governed by several in- and outbound fluxes. We do not consider total turnover (or residence) times for these compartments. Rather, we calculate turnover times with respect to one specific flux (denoted by the second subscript). For example, represents the mean time element X spends in the biologically available inventory with respect to supply from dissolution of primary minerals and secondary precipitates () (Equation 8). Thereby, provides the minimum turnover time estimate, as some fraction of could be directly drained via groundwater into streams instead of arriving in the biologically available fraction by e.g., adsorption.
Organic Nutrient Cycle
Put simply, the organic nutrient cycle incorporates nutrient uptake from forest trees, nutrient return to the forest floor followed by either nutrient re-utilization or nutrient export from the forest ecosystem by the stream.
Fluxes
The total nutrient uptake flux of the entire forest ecosystem () can be quantified from estimates of gross primary production (GPP). As GPP includes the release of carbon by plant mitochondrial respiration, which accounts for 50% of the GPP flux (Chapin et al., 2012), GPP must be converted into net primary productivity (NPP). We determined from Equation (9), where [X]tree is the bulk tree nutrient concentration in dry biomass and [C]tree is the carbon concentration of bulk tree of 50 wt.-%. Equation (9) converts the carbon-based NPP flux into a total annual dry biomass production flux of the element of interest.
After nutrient utilization, nutrients are returned to the forest floor by litterfall (LX)–comprising non-woody foliage (leaves and needles), woody foliage (twigs), dead roots and whole trees after windthrow. Subsequently these nutrients can be utilized directly from plant litter by animals such as earthworms (Resner et al., 2014). However, within the context of this study this consumption represents a soil-internal cycle that does not impact fluxes between compartments. In contrast, such flux is generated when nutrients are re-utilized by tree roots after plant litter solubilisation (), or are lost from the forest ecosystem in particulate form by plant litter erosion () or in solute form after plant litter decomposition, solubilisation and export ().
In the absence of difficult field-based measurements of the elemental plant litter erosion flux (), a rough estimate of this flux can be calculated from the product of the cosmogenic in situ 10Be-derived erosion flux (E) in units t km−2 yr−1, the concentration of element X in the litter layer and a density ratio of bedrock to plant litter that converts the annual 10Be-derived mass per area erosion flux of bedrock into an annual mass per area erosion flux of plant litter. This estimate likely provides a minimum flux, as the low-density litter is removed more readily than the higher-density quartz minerals measured for cosmogenic nuclide-based erosion rates.
The elemental plant litter solubilisation flux () can be estimated from the product of the inventory of the forest floor (, Equation 7) and a plant litter decay rate constant (k, yr−1), where 1/k represents the total, non-element specific turnover time of plant litter. However, only a fraction of is exported from the ecosystem because some fraction is directly re-utilized by forest trees after solubilisation. We term the exported fraction the dissolved plant litter export flux (). Unfortunately, direct measurements of are still lacking. A rough estimate can be obtained by assuming that preferential flow is the primary transport pathway of water and thus for dissolved nutrients from forest soils (e.g., Julich et al., 2017). The high velocity of lateral subsurface water flow combined with the lack of sorption sites along these pathways prevents the retention of dissolved organic nutrients (Jarvis, 2007). Thus, can be estimated from the product of the nutrient concentration in deep lateral subsurface water and discharge, provided that deep lateral subsurface flow contributes to groundwater recharge which ultimately drains into the stream.
Turnover Times
The turnover time of element X in the forest floor with respect to loss by plant litter erosion and solute export is (Equation 10). We note that merely presents a rough estimate, as neither nor can be estimated with certainty. Also, both parameters depend on the time X is cycled through forest trees which prevents it from loss (see section Calculation of Fluxes and Inventories in Forest Ecosystems).
The turnover time of element X in the forest floor with respect to the outbound nutrient uptake flux by forest trees is (Equation 11) (where represents the major fraction of the total nutrient uptake flux, see section Coupling the Geogenic Nutrient Pathway with the Organic Nutrient Cycle).
The turnover time of element X in the forest floor with respect to the inbound litterfall flux (LX), where LX is annual nutrient return from forest trees to the forest floor, is (Equation 12). We note that LX represents only a minimum estimate of annual nutrient return, as measurements of LX account mostly for fine litterfall only, but not for root mortality, branch fall and windthrow.
Coupling the Geogenic Nutrient Pathway With the Organic Nutrient Cycle
Fluxes
In our conceptual forest ecosystem, the fluxes of (plant litter erosion flux) and (dissolved plant litter export flux) must be balanced by a replacement flux to preserve the ecosystem from nutrient limitation that would otherwise develop on the long-term. Following the terminology in Cleveland et al. (2013) we term this nutrient uptake replacement flux that stems from fresh nutrients “new” (), as it comprises nutrients that are utilized by forest trees for the first time and are not re-utilized from the forest floor. Such new nutrients could be sourced from external atmospheric wet and dry deposition or, if these external fluxes are negligible relative to , from itself. We have no a priori means to assess how much of is used for nutrient uptake by forest trees, as some of the weathering flux is likely drained via groundwater into the stream. By assuming that at best balances nutrient losses from the organic nutrient cycle, we instead equate with the sum of nutrient loss from plant litter erosion and dissolved plant litter export by Equation 13.
in Equation (14), the total uptake flux of X reflects both the fraction of element X utilized from the forest floor () and the ‘new’ nutrient ().
Nutrient Recycling Factor
The fraction of nutrient X that is returned to the forest floor by litterfall (LX) and is neither eroded as plant litter nor lost into the stream after being leached from plant litter can be re-utilized by forest trees. We term this re-utilization process “nutrient recycling” and assess the efficiency of the nutrient recycling loop with the “nutrient recycling factor” (RecX). RecX is a metric that quantifies the efficiency of uptake of a nutrient relative to its release by weathering. We parameterise this nutrient recycling factor by the ratio of the total nutrient uptake flux of element X () relative to (Equation 15).
Because over millennia the replacement flux for and must originate from the geogenic pathway we parameterise RecX by dividing by (Equation 16, Uhlig et al., 2017). This parameterisation of RecX circumvents the impossibility of measuring directly and the challenges involved in estimating and (see section Calculation of Fluxes and Inventories in Forest Ecosystems). Note that RecX therefore represents a minimum estimate of the number of nutrient uptake and re-utilization cycles of element X through forest trees. This is because not all of the weathering release flux may be available to forest trees, if some of this flux is lost, for example, into groundwater before nutrient uptake.
Turnover Times
In a conceptual forest ecosystem in which the organic nutrient cycle is coupled to the geogenic nutrient pathway, the inventory of the biologically available fraction of the regolith represents a source for the forest trees' . The turnover time of element X in the biologically available fraction of the regolith with respect to new nutrient utilization by forest trees is (Equation 17).
Study Sites
Our two study sites are in the uplands of southern Germany: Conventwald (CON) in the Black Forest (Schwarzwald) and Mitterfels (MIT) in the Bavarian Forest (Bayerischer Wald). Both are part of the long-term forest ecosystem monitoring program “International Co-operative Program on assessment and monitoring of air pollution effects on forests (ICP Forest Level II)” and are study sites of the DFG priority program SPP 1685 “Ecosystem Nutrition—Forest Strategies for limited Phosphorus Resources”. For details of location, climatic regime, vegetation, geomorphology, and mineralogy at each catchment (see Table 2). While most aspects of the sites are similar, the catchments differ in the chemical composition of their bedrock and in their elemental atmospheric supply fluxes. Even though neither study site was glaciated during the Quaternary, periglacial slope deposits developed during the last glacial maximum (Schaller et al., 2003; Raab et al., 2007), providing the source material for pedogenesis and setting subsurface water flow characteristics. For example, water infiltrating along vertical preferential flow paths (Julich et al., 2017) is redirected into lateral subsurface flow (Chifflard et al., 2008) due to the presence of rock fragments that are aligned parallel to the slope in the so-called basal layer (Kleber and Terhorst, 2013 and references therein). Thus, the combination of vertical and lateral subsurface flow leads to the rapid transport of water and solutes through the subsurface. Evidence for such preferential flow was provided during the drilling campaign were water containing rock flour from drilling rapidly emerged from a spring about 100 m downslope.
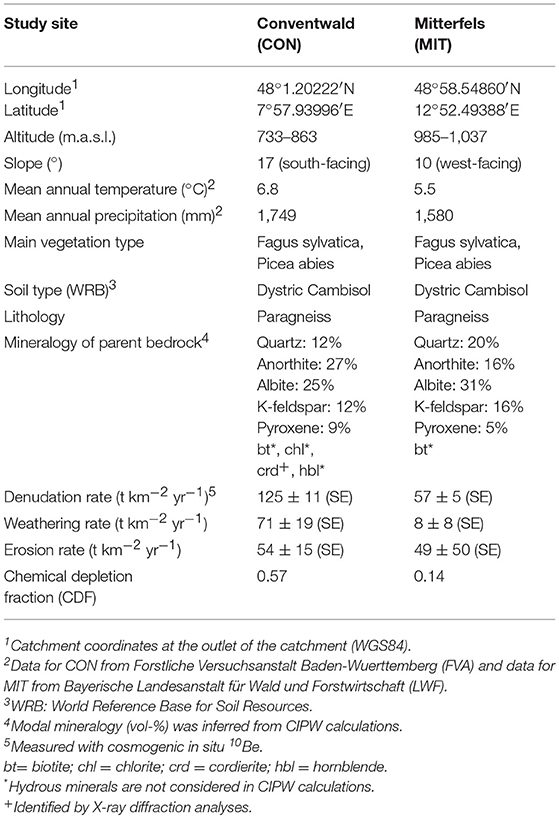
Table 2. Characteristics of the study sites in the Black Forest (CON, Schwarzwald) and the Bavarian Forest (MIT, Bayerischer Wald).
Elemental atmospheric supply fluxes from the Bayerische Landesanstalt für Wald und Forstwirtschaft (LWF) for MIT and from the Forstliche Versuchsanstalt Baden-Wuerttemberg (FVA) for CON show higher wet atmospheric deposition fluxes () at MIT with of K, Ca, and Na all being in the range of 300–600 mg m−2 yr−1 at MIT and 200–300 mg m−2 yr−1 at CON (Table 3). At MIT the relative elemental abundances do not resemble any natural dust source and are most likely caused by anthropogenic inputs. Thus, we consider wet atmospheric deposition fluxes to contribute to tree nutrition at MIT only since industrialization and modern land use. Over the time scales of this study (millennia) atmospheric inputs can be considered negligible compared to rock weathering sources (Tables 2, 3).
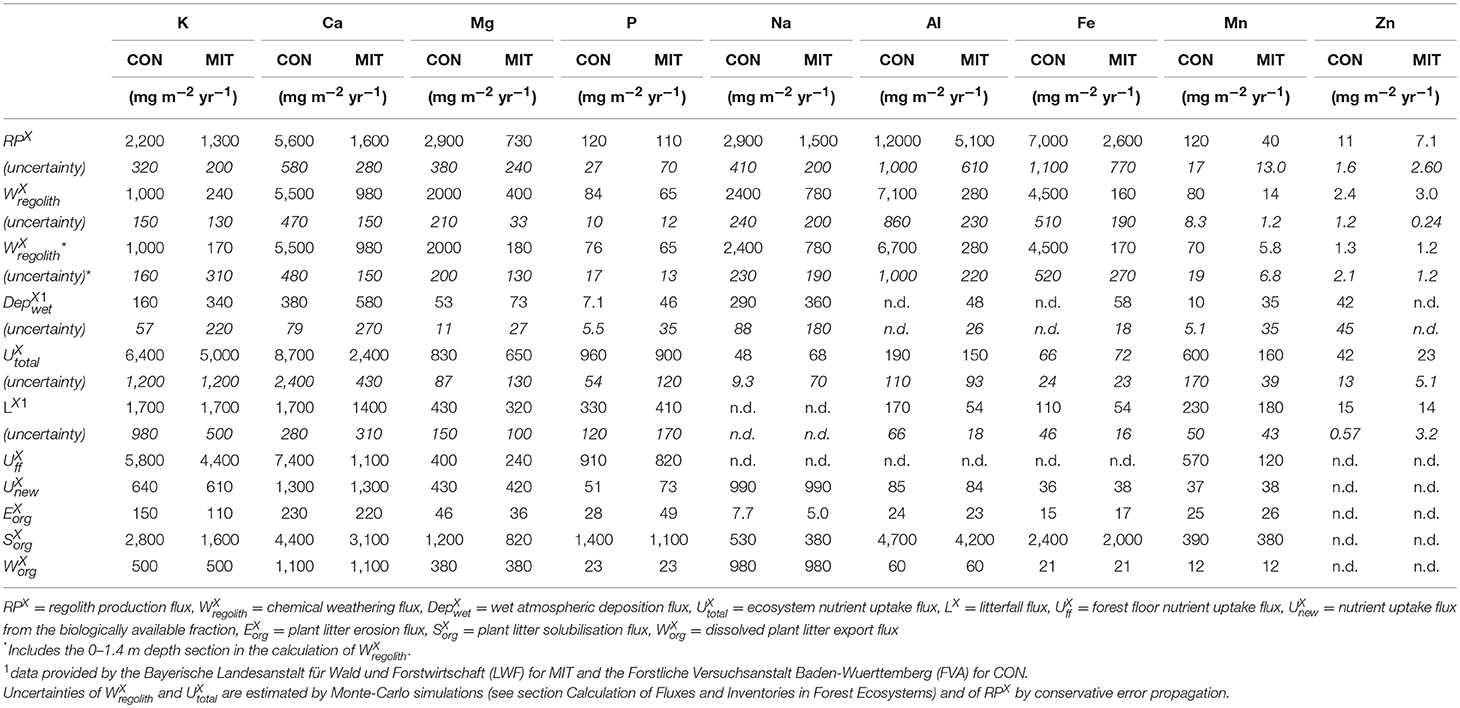
Table 3. Elemental fluxes at CON and MIT.
Methods
Sampling
Forest floor samples originate from soil pits sampled by Lang et al. (2017) nearby and upslope the drill sites at each study site. Regolith was sampled at depth increments of 20 cm from a 3 m deep trench. Regolith beyond 3 m depth was sampled from 20 m (CON) and 30 m (MIT) deep drill cores as composite samples collected from about 0.5 m to about 1 m core sections (Figure 2). Diesel-powered wireline core-drilling was required, as thick regolith containing periglacial slope deposits of <3 m thickness (e.g., Kleber and Terhorst, 2013) separated soil from unweathered parent bedrock. Dry core-drilling was performed at CON from 0 m depth to the regolith-bedrock interface at 7 m depth, and only to a depth of 5.5 m at MIT, which is not the regolith-bedrock interface, but where the abundance of fragmented rocks increased significantly. Diamond core drilling using creek water as drilling fluid from the neighboring watersheds was used to sample bedrock at both sites from drill-cores. At MIT diamond core drilling was also performed within regolith above the regolith-bedrock interface. This practice could have led to alteration of regolith properties such as soil pH and the chemical composition of the easily exchangeable fraction, and so where possible samples from hydraulically-drilled regolith sections were taken from the interior of coherent core pieces. Where this was impossible, samples were taken from wet cuttings integrating over ~2 m depth.
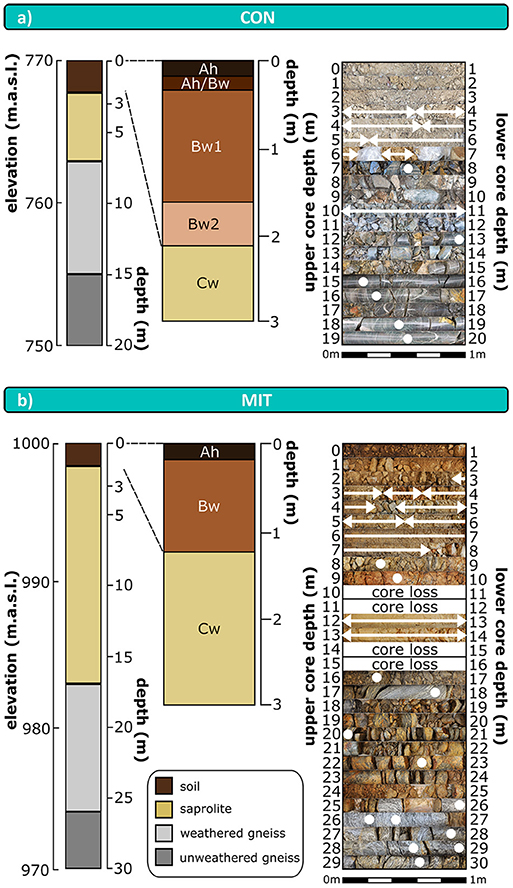
Figure 2. Schematic depth distribution of drill cores and soil profiles (left hand side); stacked photographs of drill core sections with labeled sampling points and sampled depth intervals (right hand side) at CON (a) and MIT (b). Arrows and cycles illustrate sampling points and depth intervals, respectively. Sampled depth intervals were selected to correspond to drill sections and changes in regolith appearance. Polyethylene bags at CON between 6 and 7 m depth contain coherent regolith. m.a.s.l.: meter above sea level. Ah, Bw, Cw: soil horizons according to IUSS/ISRIC/FAO 2006. Boundary of soil to saprolite is defined to be represented by the boundary between Bw horizon to Cw horizon. Color scheme of schematic drill cores is used in subsequent profile figures to assign data to soil, saprolite, and bedrock.
Living wood, leaves and needles were sampled from representative mature trees of the prevailing species European beech (Fagus sylvatica) and Norway spruce (Picea abies). Living wood was sampled by using an increment borer. Leaves and needles were sampled from young branches nearest the forest floor in September 2014.
Analytical Methods
Element concentration and radiogenic Sr isotope analyses were performed at the Helmholtz Laboratory for the Geochemistry of the Earth Surface (HELGES) at GFZ Potsdam (von Blanckenburg et al., 2016). X-ray fluorescence spectrometry was performed with the Isotope Geochemistry section at GFZ Potsdam. Phosphorus Hedley sequential fractionation was done at the University of Bonn, INRES.
Chemical Composition of Regolith and Bedrock
The bulk chemical composition of regolith, bedrock, and international reference materials (Tables S1a,b in Uhlig and von Blanckenburg, 2019) were analyzed at GFZ Potsdam. Weathering rinds were removed from representative sections of the drill core, crushed, and pulverized to <60 μm. From representative soil and saprolite samples, rock fragments were removed, oven-dried (60°C, 24 h), homogenized, split, sieved to <2 mm and pulverized to <60 μm. Glass tablets were made by alkali fusion using Li-metaborate. The chemical composition of the samples and reference materials was analyzed by X-ray fluorescence spectroscopy (XRF, PANalytical Axios Advanced) with a relative uncertainty of 5% for major elements and 10% for trace elements. The loss on ignition (LOI) of each sample was determined by weighing the glass tablets after fusion. Concentration data and respective uncertainties are reported in Uhlig and von Blanckenburg (2019).
Chemical Composition of Vegetation
Leaves and needles were rinsed in the field with deionised water (Milli-Q, 18 MΩ) to avoid contamination by dust particles. All plant tissues were oven-dried (60°C, 24 h), crushed and homogenized. Sections of heartwood (dead part of stem wood) and sapwood (living part of stem wood) spanning several consecutive annual rings were sampled from core wood and cut into pieces of ~5 cm length. Samples were digested in PFA vials using a microwave (MLS start) and ultrapure concentrated acid mixtures comprising H2O2, HNO3, HCl, and HF. The HF treatment was performed to destroy any Si-containing precipitates that may have formed after total evaporation of the dissolved sample. Chemical compositions were analyzed by inductively coupled plasma optical emission spectrometry (ICP-OES, Varian 720ES) for major and trace element concentrations, with relative uncertainties of 10% (see Table S3 in Uhlig and von Blanckenburg, 2019). The international reference material SRM 1515 (apple leaves, NIST) was processed with each sample batch.
In situ 10Be Concentrations in Quartz
To determine in situ 10Be concentrations bedload sediment was sampled at the outlet of the catchment. This averaged the spatially heterogeneous in situ 10Be concentrations of soil over the entire catchment area and ensured that flux estimates are representative over all possible topographic positions. Bedload sediment was sieved to 125–250 μm and this aliquot was purified from matrix minerals to yield 10 g of pure quartz. Beryllium was separated from matrix elements by cation chromatography following the method described in von Blanckenburg et al. (2004), oxidized and analyzed at the University of Cologne Center for Accelerator Mass Spectrometry (AMS). Procedural blanks were run with each sample batch and subtracted from the samples. The 10Be blank contribution was about 5%.
Soil pH
The pH of soil and saprolite (hereafter termed “soil pH” for ease) was analyzed after suspension in 0.01 M CaCl2. Specifically, soil pH was measured in a suspension of 1 g oven-dried (60°C, 24 h) bulk soil/saprolite (<2 mm) in 5 ml 0.01 M CaCl2 with a WTW pH meter, 3-point-calibrated using Merck buffer solutions. To monitor stability, accuracy and reproducibility, Merck pH 4 buffer solution and the international reference material IRMM-443-7 (Cambisol, BCR/IRMM representing the same soil type as those at our study sites) were measured every tenth sample. Reproducibility of measurements was better than ± 1.5%. Soil pH values are reported in Table S1c (Uhlig and von Blanckenburg, 2019).
Sequential Extraction Procedure and Chemical Analyses
Sequential extractions were performed to trace the depth distribution of nutritive elements available for uptake by trees, extracting increasingly stronger-bound nutrients with each extraction step. For extracting the metal group of nutritive elements the method from Tessier et al. (1979) was adapted (note, because binding behavior of biologically available phosphorus differs, a separate procedure was required for P; see below). Sample to extractant ratios of 1:7 were used throughout (14 ml of reactants to 2 g of dried bulk soil, sieved to <2 mm), consistent with previous studies (e.g., Baruah et al., 2011). Each extraction step (except the oxidisable extraction step) was performed by mild agitation. After each extraction step, the suspension was centrifuged at 4,200 rpm for 30 min and the supernatant pipetted off and filtered through a 0.2 μm acetate filter. Between each extraction step, soil samples were rinsed with 10 ml deionised water. After all extractions the residuals were dissolved with concentrated acid mixtures (HF, HCl, HNO3). The element concentration of each extracted fraction was measured with ICP-OES following the procedure described in Schuessler et al. (2016), with relative uncertainties better than 5% (Al, Ba, Ca, Fe, Mn, Na, S, Sr) and 10% (K, Mg) based on repeat analyses of the international reference materials SLRS-5 (river water, NRC CNRC), SRM 1640a (river water, NIST), and M212 (USGS) and synthetic in-house standards. Data from each extraction step are listed in Table S2 (Uhlig and von Blanckenburg, 2019).
The water-soluble fraction represents the most labile soil compartment, most accessible to plants (He et al., 1995) and was extracted by suspending in deionised water (Milli-Q, 18 MΩ) for 24 h, with 1 h of ultrasonication prior to extraction. The exchangeable fraction consists of elements that form weak electrostatic bonds between the hydrated surfaces of primary phyllosilicates, secondary clay minerals, or organic matter and was extracted with 1 M NH4OAc for 2 h. We cannot exclude that elements that were structurally bonded with organic matter could have accidently been extracted by 1 M NH4OAc too. The carbonate fraction is accessible to forest trees if roots excrete low-molecular weight organic acids into the rhizosphere to decrease pH and dissolve minerals of low mineral solubility. The carbonate fraction was extracted with such an acid, namely 1 M CH3COOH for 24 h. The oxidisable fraction is accessible to forest trees if tree roots develop a symbiotic relationship with organic matter decomposing organisms such as mycorrhiza fungi (Wardle et al., 2004a) that break down organic matter into plant-accessible inorganic forms. The oxidisable fraction was extracted with hydrogen peroxide in dilute nitric acid medium (4 ml 30% H2O2 in 0.01 M HNO3) following e.g., Tessier et al. (1979) and Gibson and Farmer (1986) and incubated at 85°C. After 2 h 3 ml 30% H2O2 in 0.01 M HNO3 was added and the oxidization was continued at 85°C for 3 h. Finally, 5 ml of 2.4 M NH4OAc was added and the mixture was agitated for 30 min to desorb any part of the oxidisable fraction that might have bound to exchangeable sites. The reducible fraction was not extracted here so as to avoid attacking primary silicate minerals (Tessier et al., 1979). Since under common soil conditions the reducible fraction is relatively stable and thus biologically inaccessible (Lee and Kittrick, 1984), this should not compromise our interpretation of these data.
Phosphorus Hedley Sequential Fractionation
Sieved and ground aliquots from core samples were extracted sequentially in duplicate according to a modified Hedley procedure (Tiessen and Moir, 1993) at the University of Bonn, INRES. This method assesses P availability via stepwise extraction of 0.5 g soil at a 1:60 soil:solution ratio (w/v) using anion exchange resin (termed “resin P”), 0.5 M NaHCO3 (termed “P-NaHCO3”), 0.1 M NaOH (termed “P-NaOH”), and 1 M HCl (termed “P-HCl”) over 16 h. Samples are then centrifuged and filtered through ashless quantitative paper filters (Albet LabScience, Dassel, Germany). Subsequently, the “P-HClconc” fraction was extracted with hot concentrated HCl (80°C, 20 min). For the final extraction of “residual P”, aqua regia (following Lauer et al., 2013) was used. For each fraction, inorganic P (Pi) was determined by the molybdenum-blue method (Murphy and Riley, 1962) and total P by ICP-OES (Ultima 2, HORIBA Jobin Yvon, Longjumeau, France). Organic P (Po) was then calculated as the difference of total P and Pi. P concentrations are reported listed in Table S2e (Uhlig and von Blanckenburg, 2019).
Radiogenic Strontium (87Sr/86Sr) Ratios
Radiogenic Sr analyses were performed on unweathered and weathered bedrock, bulk soil and bulk saprolite after sample digestion in PFA vials. Sr was separated from matrix elements using inverted disposable pipettes packed with 200 μl Sr Spec resin [TrisKem SR-B50-S (50-100 μm)]. Matrix elements were removed by elution with 5.5 ml 7.5 M HNO3 and Sr was eluted with 2 ml deionised water (Milli-Q water, 18 MΩ). To destroy any organic crown-ether released from the Sr Spec resin, the Sr fraction was dried, re-dissolved, and treated in closed PFA vials for more than 12 h in a concentrated acid mixture (H2O2, HNO3) at 85°C and then in concentrated HNO3 at 170°C. The purity of the Sr fraction was monitored by ICP-OES analyses. Impurities were significant only for Ba and kept below a Ba/Sr ratio of <5. Doping tests (not shown here) with SRM 987 demonstrate the absence of analytical bias below this threshold. 87Sr/86Sr was measured as 40 ng/g pure Sr solutions in 0.3 M HNO3 on a multi collector inductively coupled plasma mass spectrometer (MC-ICP-MS, Thermo Neptune) in low mass resolution using an APEX-Q (ESI). Blank correction of samples and reference material during the sequence was <0.4% of sample signal. Simultaneously to the signals of 84Sr (L2), 86Sr (central Faraday Cup), 87Sr (H1) and 88Sr (H2) the signals of 82Kr (L4), and 83Kr (L3) and 85Rb (L1) were monitored to correct for Kr and Rb interferences on the masses 84 and 87 with the Kr and Rb isotope ratios measured prior to the sequence run. The measured 87Sr/86Sr ratio was normalized to the 88Sr/86Sr ratio of 8.375209 by using an exponential law to correct for natural and instrumental isotope fractionation. Repeat analyses of SRM 987 processed the same way as samples and without chemistry was used to determine the long-term accuracy of the method. Averages and two standard deviations are SRM 987 = 0.71029 ± 0.00001 (N = 240, without chemistry) and SRM 987 = 0.71026 ± 0.00011 (N = 32, including chemistry) and are identical to published values for SRM 987 = 0.71029 ± 0.00033 (N = 247, Jochum et al., 2005) measured with MC-ICP-MS.
Calculation of Fluxes and Inventories in Forest Ecosystems
Total Denudation Rates (D)
Catchment wide denudation rates (D) were determined from in situ 10Be concentrations of quartz sampled from bedload sediment at the outlet of the catchment [following the approach of von Blanckenburg (2006)]. D was calculated from Equation 18, where PROD is the production rate (at g−1 yr−1) of cosmogenic 10Be at the Earth surface in quartz, [10Be]insitu the measured cosmogenic nuclide concentration (at g−1), λ is the decay constant (yr−1) of 10Be and Λ the cosmic ray absorption mean free path (150 g cm−2) in rock. To calculate D a PROD of 4.01 at g−1 yr−1 at sea-level high latitude (SLHL) (Lal, 1991; Stone, 2000) was used and scaled for altitude and latitude (Stone, 2000). The total denudation rate is reported in Table 2.
Chemical Depletion Fraction (CDF)
The calculation of CDF requires the presence of a chemically immobile element. We tested the deviation of supposedly chemically immobile elements from the weathering enrichment lines (Hewawasam et al., 2013; Oeser et al., 2018) in Supplementary Figure 1 that were inferred from unweathered bedrock concentrations. At both study sites Zr is considered the most chemically immobile element, as its concentration increase from unweathered bedrock to regolith is most pronounced. Weathered rock or regolith samples that originated from a chemically distinct parent bedrock were disclosed if their Zr concentration was lower than the mean of unweathered bedrock by more than two standard deviations (2SD). Because additions of mobile elements of such magnitude are unlikely in in situ rock or saprolite, these samples were excluded from further consideration. Saprolite and weathered rock samples were also excluded from our dataset if the Cr, Ni, Nb and Ti concentrations are twice those of unweathered parent bedrock (+2SD). Elevated concentrations of these elements indicate the presence of mafic precursor rock such as present in bedrock enclaves. Finally, mineralogical evidence from X-ray diffraction analyses suggests that these regolith samples originate from another source rock given that primary minerals like cordierite and hornblende are present in saprolite and weathered rock at MIT but absent in unweathered bedrock (see Supplementary Figure 5). All such excluded samples are labeled in red in Supplementary Figure 1 and are highlighted in Uhlig and von Blanckenburg (2019).
To estimate the profile's representative chemical depletion fraction, each sites CDF value was estimated by averaging the Zr concentration through the weathering profile from below 1.4 m depth to the regolith-weathered bedrock interface at 7 m depth at CON and at 17 m depth at MIT. The topmost 1.4 m were excluded for this estimate, because there Zr concentrations decrease, which is presumably due to a dilation effect (Brimhall et al., 1992) caused by biota and accumulation of secondary precipitates. All CDF-values were calculated from Equation (2) and reported in Uhlig and von Blanckenburg (2019).
Elemental Chemical Weathering Fluxes ()
was calculated from Equation 6 and reported in Table 3. To estimate mean -values (calculated from Equation 5 and reported in Table S1c in Uhlig and von Blanckenburg, 2019) were used from the entire depth of soil and saprolite from -profiles that exhibit uniform depth distributions. Some -profiles exhibit strong depth dependencies. These depth dependencies are characteristic for depletion profiles, depletion-enrichment profiles and biogenic profiles (Brantley and Lebedeva, 2011). For these -profiles either the most negative -values from the shallowest mineral soil sample (for depletion profiles at MIT) or average -values from below the enrichment horizons from 1.4 to 7.0 m depth (for depletion-enrichment profiles at CON) were used. In addition, we tested whether including the 0–1.4 m depth section in the calculation of the Weathering profiles' -value results in different weathering fluxes and call these (Table 3). Including these shallow sections has no effect on beyond uncertainty for most elements except for Mg, Mn, and Zn at MIT.
Ecosystem Nutrient Uptake Fluxes ()
was calculated from Equation (9) and fluxes are reported in Table 3. An elemental bulk tree nutrient concentration was estimated by averaging leaf foliage and wood nutrient concentrations in both prevailing tree species (Fagus sylvatica and Picea abies) and reported in Table 4. The sampling and analyses of roots was excluded in this study, because of the difficulties related to their purification from soil particles, and because the accurate apportionment of elements into different root compartments is notoriously difficult. For example, nutrient concentrations in fine roots are substantially higher than in coarse roots (Hellsten et al., 2013), but the relative proportions of fine to coarse roots are largely unknown. However, given the relatively high uncertainty in the bulk tree nutrient concentration averaged from leaf foliage and wood, we nevertheless suggest that the nutrient content in roots is adequately estimated. Gross primary productivity (GPP) was not measured at our study sites. Instead, mean annual (1982–2008) GPP data from a global empirical upscaling model, based on FLUXNET data were used. For both study sites this equates to about 1,260 g m−2 yr−1 ± 60 (SE, N = 360).
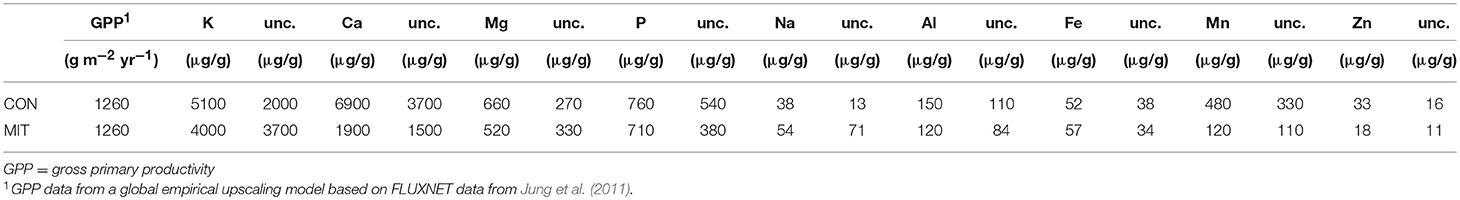
Table 4. GPP and element concentrations of bulk tree at CON and MIT.
Litter Erosion Flux ()
was estimated from the cosmogenic in situ 10Be-derived erosion flux (E), the concentration of element X in the litter layer and a density ratio of bedrock to plant litter, and reported in Table 3. Data on the density of the litter layer was taken from Supplement 2 in Lang et al. (2017). Because the metric includes the cosmogenic nuclide derived denudation rate (D) that integrates over millennia, the litter erosion flux represents an underestimation of . The reason is that the litter layer is of lower density than the soil beneath it that contains quartz on which D was measured, meaning that the litter layer requires less erosional forces to be eroded than do quartz minerals.
Litter Solubilisation Flux ()
was estimated from the inventory of the forest floor (, Equation 7) and a plant litter decay rate constant (k, yr−1), and reported in Table 3. Leaf foliage litter decomposition rate constants (k, yr−1) from litterbag experiments in 30 to 120 years old pure and mixed stands of Fagus sylvatica and Picea abies from Albers et al. (2004) were used and converted from unit mo−1 to yr−1. Decomposition rate constants used for non-woody foliage at pure stands were 0.31 yr−1 for Picea abies and 0.22 yr−1 for Fagus sylvatica, and at mixed stands 0.29 yr−1 for Picea abies and 0.24 yr−1 for Fagus sylvatica (Albers et al., 2004). This non-woody foliage derived decomposition rate constants are comparable to the lower end of litter decay constants of diverse tree species calculated from Table 1 in Homann (2012) amounting to 0.39–0.88 yr−1, but are about one third higher than in situ derived decomposition rate constants of woody tissue of, for example, about 0.10 yr−1 (Johnson et al., 2014).
Dissolved Plant Litter Export Flux ()
was estimated from the product of the nutrient concentration in deep lateral subsurface water and runoff. We assumed that most of the nutrient concentration in deep subsurface water originates from plant material. At CON, lateral subsurface water was sampled [method see Sohrt et al. (2018)] over the course of 1 year. At CON, annual runoff of about 600 mm (Sohrt, 2019) was used. Because deep lateral subsurface water was sampled only at CON, from CON was also used for MIT as both sites are very similar with respect to pedogenesis and environmental conditions.
Determination of Inventories ()
was calculated from Equation (7) for each of the compartments: the biologically available fraction (), forest floor () and bulk regolith including nutrients contained in fragmented rocks (). are reported in Table 5.
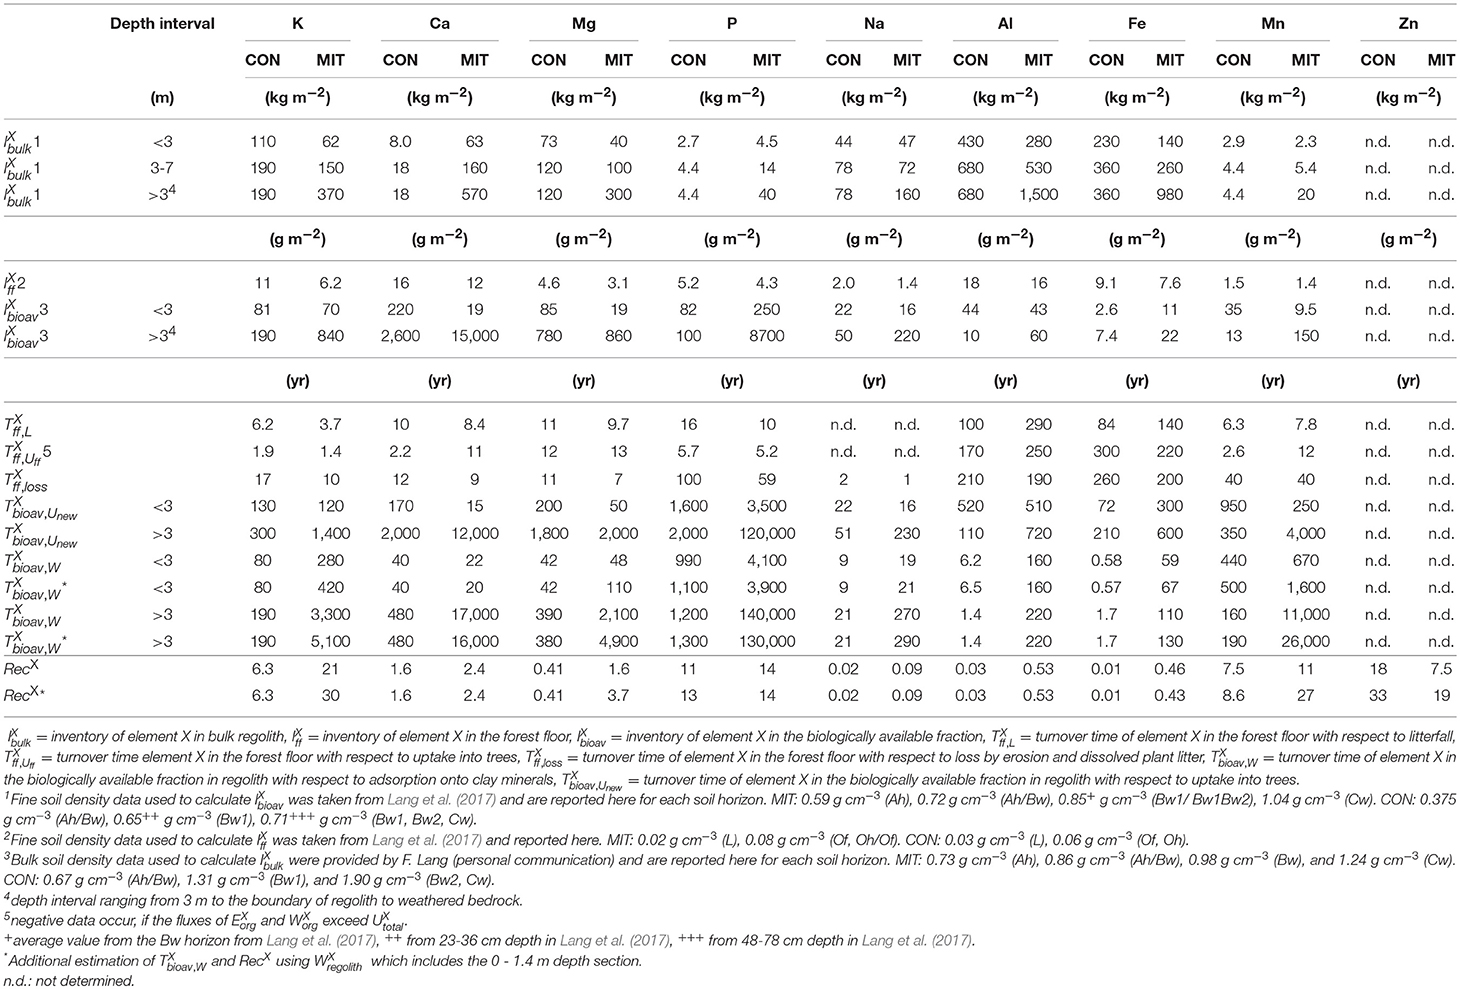
Table 5. Inventories (), turnover times (), and recycling factors (RecX) at CON and MIT.
The biologically available fraction comprises the water-soluble and exchangeable fraction that is weakly adsorbed to soil minerals and organic matter. In the case of P the biologically available fraction refers to the inorganic products of the Hedley sequential P fractionation method, namely resin-P, HCO3-Pi, and 1M HCl-Pi. was estimated for two depth intervals mainly for reasons of sampling depth resolution and the presence or absence of periglacial slope deposits: from 0 m to 3 m (called “ <3 m,” high sampling depth resolution (20 cm depth sections), presence of periglacial slope deposits) and from 3 m depth until the interface of saprolite and weathered bedrock (called “>3 m,” low sampling depth resolution (0.5–1 m depth sections), absence of periglacial slope deposits). The >3 m depth intervals range from 3 to 7 m at CON and 3 to 17 m at MIT. However, we believe that both depth intervals are principally accessible to tree roots.
The fine-earth soil density of the soil horizons Ah, Bw and Cw, required to calculate the inventory of the biologically available fraction () via Equation (7), was taken from Lang et al. (2017) and reported in Table 5. The bulk soil densities, required to calculate the nutrient inventory of bulk regolith including fragmented rocks () via Equation (7) were reported in Table 5 (data from Friederike Lang, personal communication). To account for fragmented rocks in the concentration in rock fragments was multiplied by the rock fragment content (69% at CON, 25% at MIT; Lang et al., 2017); the nutrient concentration in fine earth multiplied by its percent abundance (100% minus % rock fragments) was added; this sum was then multiplied by bulk soil densities (>2 mm, including rock fragments). To calculate , density data from Lang et al. (2017) and element concentrations from the Oh layer were excluded, because the chemical composition of the Oh horizon indicates that the dissolved sample contained not only organic material, but also silicate minerals accidently dissolved during microwave digestion. Hence, data from the Of horizon was used instead.
Nutrient Recycling Factor (RecX)
RecX was calculated from Equation 16 and reported in Table 5. Note that RecX, the ratio of element uptake to the weathering release flux of this element presents a minimum estimate. First, some fraction of may get discharged via groundwater into the stream in which case the denominator in Equation 16 is an overestimate for tree root availability. Second, because used to calculate RecX does not account for nutrient loss after uptake by throughfall and stemflow fluxes, which are generally highest for K compared to other nutrients (e.g., Wilcke et al., 2017), the numerator in Equation 16 might be a minimum estimate. Third, the numerator is also a minimum estimate because nutrient resorption and excretion into the rhizosphere during leaf senescence, followed by re-utilization in the subsequent growing season, is not accounted for. For some elements RecX is higher when is calculated using the 0–1.4 m depth section (see Table 5 for a revised RecX*). Note that RecX is not sensitive to intra-plant cycling of nutrients such as storage in perennial wood after resorption during senescence of leaves (Aerts, 1996; Killingbeck, 1996) or wood (Meerts, 2002). If atmospheric wet and dry deposition fluxes (the latter only if also biologically available) contribute substantially to forest ecosystem nutrition this flux must be added to the weathering term of RecX. Wet deposition is believed to be negligible in this study, however, based on data shown in Table 3 and discussed in section Mineral Nutrient Availability of the Regolith.
Uncertainty Estimation of Nutrient Fluxes
The analytical uncertainties of measured data are reported in Uhlig and von Blanckenburg (2019) and in section Analytical Methods. Assigned uncertainties on and LX are 1 standard deviation (SD) of the entire datasets from Bayerische Landesanstalt für Wald und Forstwirtschaft (LWF) for MIT and from the Forstliche Versuchsanstalt Baden-Wuerttemberg (FVA) for CON. For GPP, a much larger dataset is available allowing us to assign 1 standard error (SE). Uncertainty on RPX incorporates the SE of the catchment-wide denudation rate propagated with the SD of unweathered bedrock concentration. The uncertainties of the nutrient fluxes of and were estimated by performing Monte Carlo simulations: 1,000 random datasets were sampled within the SD and SE of all input parameters, generated by a Box-Muller transform (Box and Muller, 1958). Specifically, input uncertainties into Monte Carlo simulations for were the SE of GPP and the SD of nutrient concentrations in woody and non-woody foliage. Input variable uncertainties for were the SE of the catchment-wide denudation rate and the SD of the mean of the weathering profile's elemental loss/gain fraction. Resultant uncertainties on nutrient fluxes are reported in Table 3.
Results and Interpretations
To evaluate the significance of the various geogenic and organic nutrient reservoirs and cycles for long-term forest ecosystem nutrition we use the sequence of metrics developed in our conceptual framework (section Conceptual Framework). First, we follow this sequence to guide through the values obtained for them and second, we discuss their contribution to the entire system.
Geogenic Nutrient Pathway
Mineral Nutrient Availability of the Regolith
Denudation (D) and regolith production rates (RP)
The absolute mass loss from the regolith by denudation (sum of weathering flux and erosion flux) is substantially higher at CON (125 t km−2 yr−1) than at MIT (57 t km−2 yr−1; Table 2). Provided that the weathering profiles are at steady state (meaning quasi-steady regolith thickness over 10 kyr timescale) these denudation rates also correspond to the regolith production rates. On a global comparison, both denudation rates are within the range of fast regolith production rates (Dixon and von Blanckenburg, 2012). According to the nutrient supply framework for eroding settings (Porder et al., 2007), this mass loss should translate to effective rejuvenation of the topsoil's nutrient availability by erosion. However, besides advection by erosion the abundance of primary minerals and thus of mineral nutrients remaining at the top of the profile ultimately also depends on water flow and the mineral solubility of primary minerals (Maher, 2010). To shed light on the nutrient availability we quantified the degree of chemical alteration along the regolith profile.
Chemical depletion fraction (CDF)
The chemical depletion fraction (CDF, Equation 2, Figure 3a) at CON is 0.57 (0.55, respectively, when considering the entire depth of soil and saprolite). This CDF is close to the global reported maximum CDF for granitic rock in sloping landscapes of ~0.6 (Dixon and von Blanckenburg, 2012) and indicates that dissolution of primary minerals, such as plagioclase, virtually ran to completion. At MIT the CDF is substantially lower at 0.14 (CDF is also 0.14 when the entire depth of soil and saprolite is considered), indicating that a large fraction of primary minerals remained and the regolith is only weakly altered. To determine whether erosion at the surface sets this difference we used the catchment's CDF values to disentangle D into W and E (see Equations 1, 3). We find that soil erosion rates are similar at both sites (54 t km−2 yr−1 at CON and 49 t km−2 yr−1 at MIT) and weathering rates (W) are 71 t km−2 yr−1 at CON and 8 t km−2 yr−1 at MIT (Table 2). Several factors might favor higher weathering rates at CON: mean annual temperature exceeds temperature at MIT by 1.3°C, mean annual precipitation exceeds precipitation at MIT by 150 mm, the aspect at CON is south- rather than west-facing, and the rock at CON contains minerals with higher solubility (Table 2). Several watershed-based mineral dissolution studies suggest that the effect of temperature is minor once the control of runoff that strongly depends on temperature has been removed (White and Blum, 1995; White et al., 1999; Ibarra et al., 2016). Similarly, weathering indices and rates determined in regolith studies show that lithological controls prevail over climate controls (Ferrier et al., 2012; Oeser et al., 2018). As differences in precipitation and hence runoff are minor between our sites, we attribute mineral composition to exert the primary control over the large differences in weathering rate. Indeed, the paragneiss at MIT contains more minerals of low mineral solubility. For example, whereas the paragneiss at CON contains only 12% quartz by vol., MIT contains 20%. The composition of plagioclase is shifted toward low solubility at MIT. There, plagioclase contains about 31% albite by vol. and 16% anorthite by vol., as opposed to about equal proportions of albite (25%) and anorthite (27%) at CON. Also, minerals with high solubility like hornblende, cordierite, and chlorite were identified in parent bedrock at CON (based on of X-ray diffraction analyses; Supplementary Figure 5), but they are absent at MIT. As a result, the weathering rates are 71 t km−2 yr−1 at CON and only 8 t km−2 yr−1 at MIT (Equation 3). In terms of nutrient availability to the forest ecosystem, we conclude that CON apparently lost a higher fraction of nutrients relative to bedrock than MIT; yet they are also supplied at much higher rates by chemical weathering at CON than at MIT.
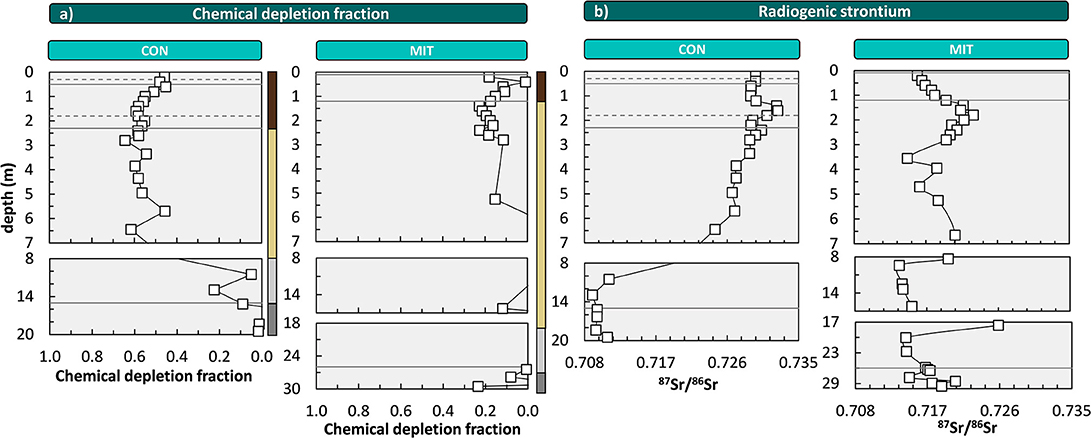
Figure 3. Depth distribution of the chemical depletion fraction (CDF, a) and the radiogenic strontium isotope ratio (87Sr/86Sr, b). Solid lines illustrate soil horizon boundaries and the interface of weathered rock to unweathered rock. Dashed lines indicate soil horizon subdivision (see Figure 2). Colored bars at the right site of panel a refer to color coding of drill core sections from Figure 2. For ease of display we changed the y-axis spacing with depth, yet all data are shown continuously. At MIT some CDF-values are negative; these are not displayed for simplicity.
Radiogenic strontium isotope ratio (87Sr/86Sr)
As an independent proxy for the overall nutrient availability of the regolith that does not depend on an index element like Zr we use the ratio of the radiogenic Sr isotope 87Sr to the stable Sr isotope 86Sr. 87Sr/86Sr of bulk parent bedrock and bulk regolith differ if bedrock mineralogy comprises minerals that are different in their mineral solubility, Sr contents and 87Sr/86Sr compositions (Blum and Erel, 1995). For example, the 87Sr/86Sr of bulk regolith shifts from low ratios in unweathered rock to high ratios in regolith, as plagioclase with low 87Sr/86Sr and high Sr concentration is lost and biotite with high (radiogenic) 87Sr/86Sr and low Sr concentrations remains. Thus, the higher the intensity of chemical weathering, the larger the difference between 87Sr/86Sr of bulk bedrock and bulk regolith. At CON, 87Sr/86Sr of bulk regolith ranges from 0.7245 to 0.7327 and is distinct from that of bulk parent bedrock, which ranges from 0.7094 to 0.7109 (Figure 3b). Conversely, at MIT, 87Sr/86Sr of bulk regolith is similar to bulk parent bedrock (which ranges from 0.7148 to 0.7205), with values of 0.7136–0.7230 (Figure 3b). Consequently, 87Sr/86Sr of bulk regolith is only at CON substantially more radiogenic than bulk parent bedrock, implying a high degree of chemical alteration relative to parent bedrock and thus more nutrient loss at this site. Yet CDF and 87Sr/86Sr, both being indicators of bulk mass loss from the regolith, do not per se inform on nutrient availability.
Elemental loss and gain fractions ()
Indicators of the availability of individual nutrients and plant-beneficial elements are -values (Equation 5). In agreement with the higher CDF and the difference in 87Sr/86Sr we find substantially greater losses at CON among all considered elements (Figure 4). The degree of nutrient loss is most striking for Ca at CON, where Ca loss runs to completion, whereas at MIT about 35% of Ca remain in the regolith. At both study sites most elements exhibit depletion profiles (Figure 4), defined as weathering profiles showing the continuous loss of soluble elements from bedrock as one moves from the weathering front to topsoil (Brantley and Lebedeva, 2011). For P and Zn at CON, there is a remarkable enrichment toward the forest floor in the Bw horizon that can be ascribed to nutrient uplift by biota. At both sites, the elemental losses can be attributed to a “kinetically limited weathering regime” (Brantley and Lebedeva, 2011), where the erosion rate is sufficiently high to keep the nutrient stock of minerals that transit vertically through the weathering profile at moderate levels. The higher nutrient depletion of the regolith at CON is attributed to (i) the complete dissolution of cordierite and hornblende, and (ii) the presence of a slowly altering anorthite-poor plagioclase at MIT.
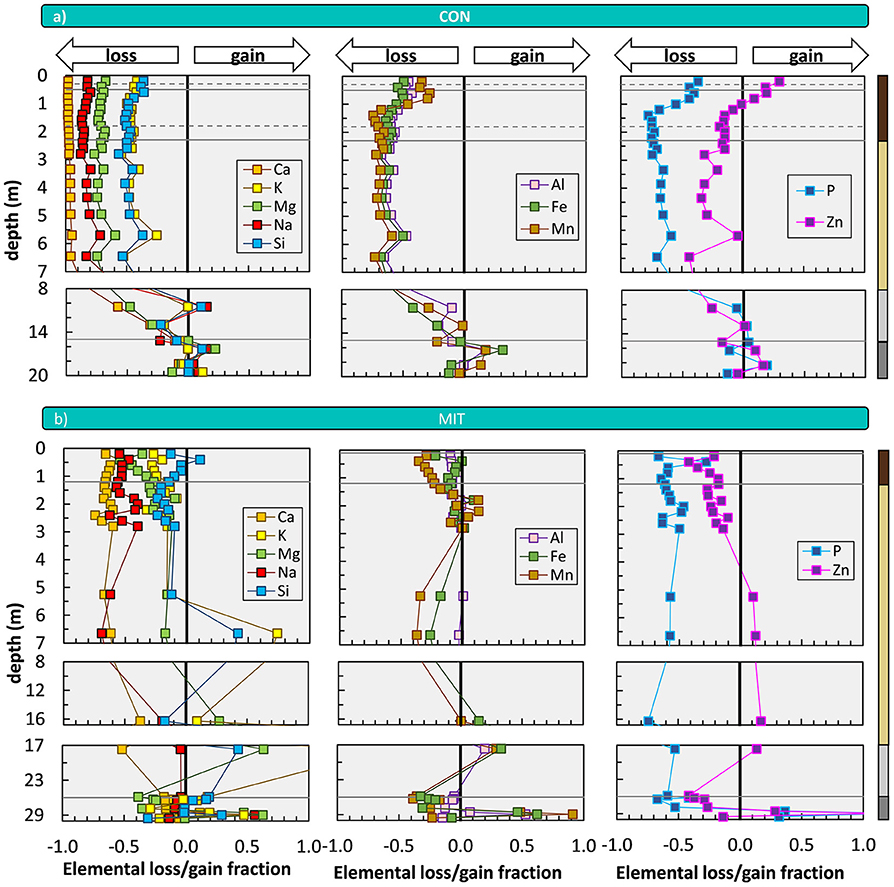
Figure 4. Depth distribution of elemental loss/gain fractions (mass transfer coefficients, ) at CON (a) and MIT (b). The vertical line indicates a -value of zero and represents unweathered parent bedrock. Solid horizontal lines illustrate soil horizon boundaries and the interface of weathered rock to unweathered rock. Dashed horizontal lines indicate soil horizon subdivision (see Figure 2). Colored bars at the right site of panel a refer to color coding of drill core sections from Figure 2. For ease of display we changed the y-axis spacing with depth, yet all data are shown continuously. X-axis scale in panel a (not shown) is the same as in panel b. Given that some outliers were excluded from this figure, Figure 3a and from flux estimates that are based on , we show the depth distribution of element concentrations in Supplementary Figure 2, and in Supplementary Figure 3 and Supplementary Figure 4 [according to Fisher et al. (2017) log10 (CX/Cj)] including the outliers.
Importantly, CDF, 87Sr/86Sr, and -values all inform about the depth of the weathering front. At CON, all these indicators point at the weathering front to be located beneath 7 m depth, within the diffuse saprolite/gneiss boundary (Figure 2). But also, at MIT, where overall loss is low, of the most soluble elements Ca and Na indicate a weathering front at > 7 m depth. Thus, the intriguing possibility arises that nutrients are indeed released at these depths and are transported into the rooting zone for uptake into forest trees. To begin an evaluation of this possibility we convert these elemental loss and gain fractions into elemental fluxes, and we note that these present upper flux limits of nutrient transfer from rock into forest trees as some nutrient may be lost into the stream, before it is captured by trees.
Nutrient supply by
The weathering supply for the most plant-essential mineral nutrient phosphorus is similar between both study sites and amounts to 84 mg m−2 yr−1 at CON and to 65 mg m−2 yr−1 at MIT. For the other nutritive elements, the fluxes of (Equation 6) are considerably higher at CON, where the regolith experiences more chemical alteration (Table 3, Figure 5). For example, of the second most essential mineral nutrient potassium (K) amounts to 1,000 mg m−2 yr−1 at CON, but only to 240 mg m−2 yr−1 at MIT. These geogenic supply fluxes exceed atmospheric supply fluxes () by an order of magnitude at CON and by several times at MIT, as at MIT atmospheric supply is dominated by anthropogenic sources today (see section Study Sites above). Forest trees are thus considered to be nourished from a nutrient stock fed by chemical weathering, some of which is sourced at substantial depth. To quantify whether this stock is a reservoir of sufficient size and also accessible to tree roots we proceed to quantify the inventories of these regolith nutrient stocks.
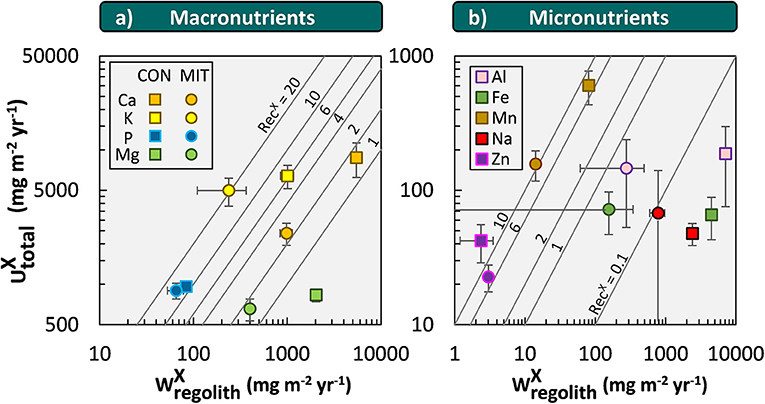
Figure 5. Chemical weathering fluxes () and ecosystem nutrient uptake fluxes () for macronutrients (a) and micronutrients + Na (b) at CON (squares) and MIT (circles). Contour lines illustrate the nutrient recycling factor (RecX), which is the ratio of to . Uncertainty bars show one standard deviation (see section Calculation of Fluxes and Inventories in Forest Ecosystems).
Accessibility of Mineral Nutrients to Forest Trees
Regolith nutrient inventories () and nutrient accessibility
The first and most simple assessment is to quantify the maximum amount of nutrients by means of their inventories in bulk regolith (). For most elements inventories are substantially higher at CON than at MIT (Table 5). The exceptions are Ca and P. is an order of magnitude higher at MIT than at CON because at CON most of the more soluble anorthite-rich plagioclase has been depleted (Table 2). is higher at MIT than at CON because of the 2 to 3-fold higher concentration of P in unweathered bedrock (MIT: ~2,000 μg/g, CON: ~950 μg/g) and fragmented rocks (MIT: ~2,900 μg/g, CON: ~470 μg/g) at MIT relative to CON.
Less than 1% of this bulk nutrient inventory is biologically available to forest trees (Figure 6). Our sequential extractions disclose this biologically available fraction, which is generally higher at CON than at MIT. Even though element concentrations of all extracted regolith fractions are orders of magnitude below the bulk regolith concentrations (Figure 6) the plant-accessible nutritive elements occur throughout the regolith profiles and are enriched at the surface in the topmost meter of soil and beneath 3 m depth up to >7 m depth at both sites (particularly Ca). The enrichment in the topmost meter of soil is indicative of biological uplift of nutrients from depth through plants (Jobbágy and Jackson, 2001). According to our conceptual framework biological nutrient uplift contribute toward the organic nutrient cycle. The elevated concentrations and thus higher inventories of elements at >3 m depth (Table 5), potentially providing another reservoir of biologically available nutrients, most likely have been released by chemical weathering within the saprolite and are subsequently adsorbed onto clay minerals. These nutrients contribute to the suggested geogenic nutrient pathway.
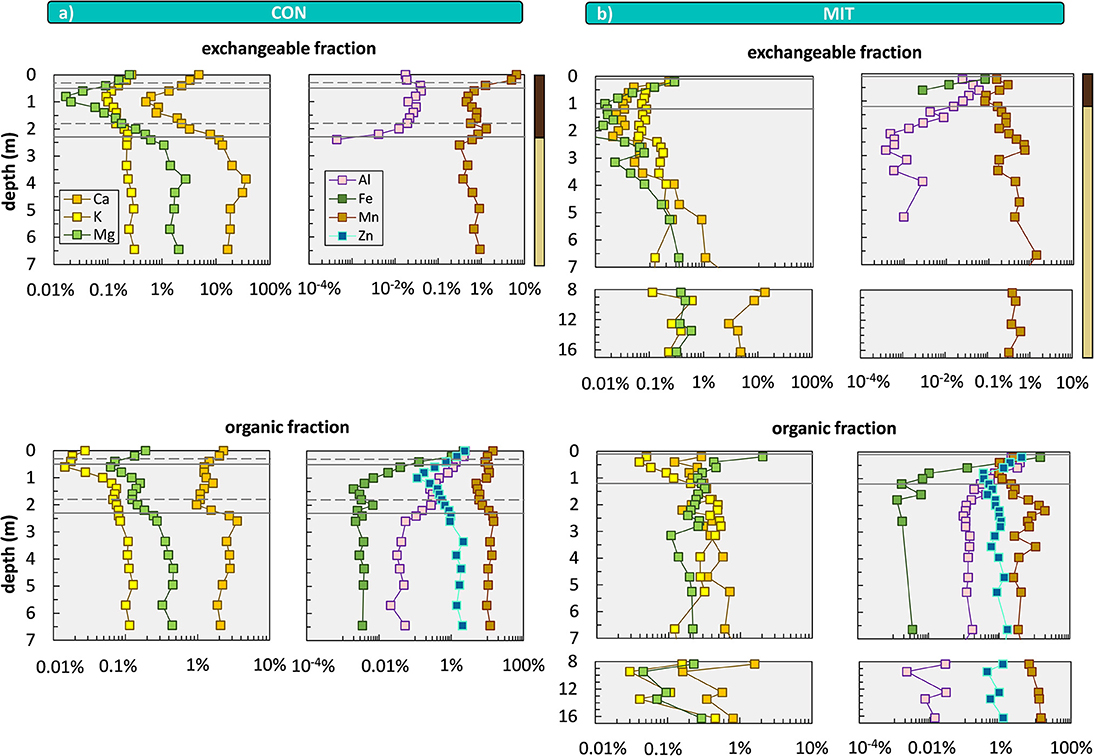
Figure 6. Depth distributions of sequentially extracted fractions comprising the exchangeable fraction (1 M NH4OAc) and organic fraction (30% H2O2 in 0.01 M HNO3) at CON (a) and MIT (b). Shown are total concentrations relative to bulk soil and saprolite samples. Data gaps occur when extractant was below limit of detection. Solid lines illustrate soil horizon boundaries and the interface of weathered rock to unweathered rock. Dashed lines indicate soil horizon subdivision (see Figure 2). Colored bars at the top of the panel refer to color coding of drill core sections from Figure 2. For ease of display we changed the y-axis spacing with depth, yet all data are shown continuously.
To provide further insight into the biological availability of these nutrients we discuss the depth distribution of their chemical forms by focusing on the exchangeable and organic-bound fractions. The exchangeable fraction is considered as the best representation of plant-available nutrients. The most striking feature is an increase in Al toward the surface, particularly in the acidic Bw soil horizon [4.3–4.7 at CON and 3.6–4.7 at MIT (Figure 7)], which is a trend opposite to the depth distribution of Ca, K, Mg within the Bw horizon. At depth > 2 m no exchangeable Al is found whereas Ca, K, Mg occur in concentrations that exceed those in the central part of the Bw horizon by an order of magnitude. These depth profiles result from both the soil pH and the cation exchange capacity (CEC). At low soil pH acidic cations that are less plant-essential (such as Fe, Mn, and Al), inhibit the adsorption of basic cations that are more plant-essential (such as Ca, Mg, and K). Hence, where the soil pH is acidic, plantessential basic cations are replaced by elements of less nutritive character. Indeed, the soil pH decreases from ~6 to ~7 at a depth > 3 m to ~4 at the surface at both sites (Figure 7). However, contrary to these findings the concentrations of K, Ca, and Mg in the exchangeable fraction increase from a depth of 1 m toward the forest floor at both sites, where the soil pH is most acidic (Figures 6, 7). At this level total carbon (Ctotal), considered to be organic, as pedogenic carbonate is absent at this low pH, also increases (Figure 7). Thus, the depth distribution of Ca, K, Mg, and Al suggests the adsorption of these nutritive elements onto organic matter (as humus exhibits the highest CEC).
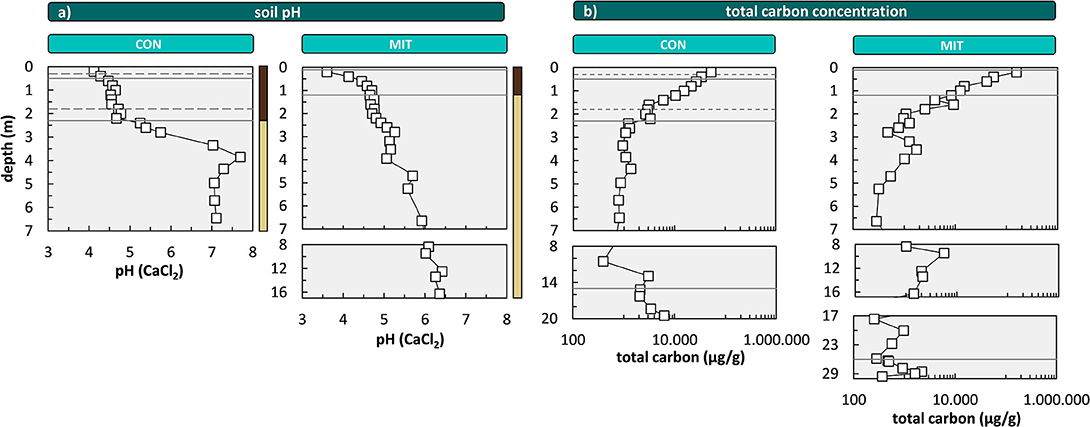
Figure 7. Depth distribution of the soil pH (a) and depth distribution of total carbon concentrations (b) at CON and MIT. Soil pH is analyzed in 0.01 M CaCl2. Solid lines illustrate soil horizon boundaries and the interface of weathered rock to unweathered rock. Dashed lines indicate soil horizon subdivision (see Figure 2). Colored bars at the right site of (a) refer to color coding of drill core sections from Figure 2. For ease of display we changed the y-axis spacing with depth, yet all data are shown continuously.
Concentrations in the organic fractions, featuring similar depth distributions to the exchangeable fraction, support this interpretation. However the concentrations of some organic-extractable nutritive elements (mainly Ca, K, Mg, and Mn) do not mirror the pattern of Ctotal that steadily increases from depth to topsoil (Figure 7), where organic carbon of true biological origin is present only in the Bw horizon and above. Note that Ctotal at depth can be attributed to lithogenic sources such as graphite. One potential explanation is that the oxidative extraction step partially attacked residual phyllosilicates such as biotite, chlorite, or illite.
The chemical form of the biologically available fraction of P differ from the other elements. Concentrations of biologically available Ca-bound P increase with depth and approach maximum concentrations in the lower regolith (>3 m) where it dominates over the entirety of P species (Table S2e in Uhlig and von Blanckenburg, 2019).
Organic Nutrient Cycle
Chemical Composition of Picea abies and Fagus sylvatica
Comparing critical leaf and needle concentrations from Göttlein et al. (2011) with foliar concentrations at CON and MIT (Figure 8) reveal that for most elements the nutrient levels are in the normal range. Comparing the foliar and wood concentrations from CON and MIT with those compiled by Jacobsen et al. (2003) in more than a dozen independent studies performed on Fagus sylvatica and Picea abies forests shows that Ca levels for Picea abies at CON (Figure 8) and K levels for both tree species are indicative of nutrient surplus.
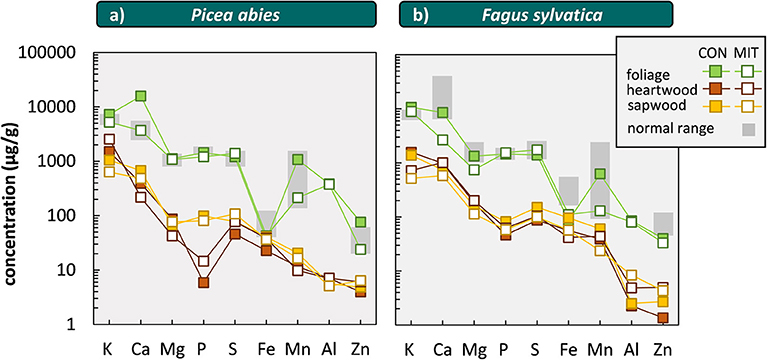
Figure 8. Elemental concentrations in leaves, needles, heartwood (dead part of wood) and sapwood (living part of wood) of Picea abies (a) and Fagus sylvatica (b) at CON and MIT. We did not illustrate data of sample MIT-V-7 and MIT-V-8 as P and S were not analyzed in these samples. “normal range” denotes the critical leaf and needle concentration at normal range [data from Göttlein et al. (2011)]. Elements on x-axis are sorted from left to right by macronutrients, micronutrients, and plant-beneficial elements.
Another indicator for the nutrient status of forest trees is nutrient resorption during sapwood senescence. The concentrations in wood from Fagus sylvatica (Angiosperms) are generally higher than those in Picea abies (Gymnosperms) at both sites, which agrees well with data reviewed by Meerts (2002). Nutrient concentrations in sapwood (living part of stem wood) are generally higher than in heartwood (dead part of stem wood) in both study sites and tree species (Figure 8). This effect is most pronounced for P in Picea abies at both sites, where P concentrations in sapwood are 6-fold higher at MIT and 17-fold higher at CON than in heartwood (Figure 8), which is indicative of nutrient resorption and P is efficiently used and not in deficit. This observation is consistent with critical leaf and needle concentrations found for P in Picea abies at MIT. In contrast, we found higher concentrations of Ca, Mg, K in heartwood over those in sapwood at both sites. We attribute the partitioning of these elements into heartwood to its accumulation into crystals such as oxalates, which are typically found in wood (Hillis, 2006).
Surprisingly, the element concentrations in bulk tree are roughly correlated with the biologically available fraction but not with those in bulk regolith (Figure 9). One explanation for this trend is that the tree's concentrations are determined by their nutrient demand [the “physiological needs” model of Elser et al. (2010)]. The composition of the biologically available fraction is then set by nutrients being returned to the regolith through litterfall, litter decomposition followed by transport of released nutrients with infiltrating water and later adsorption. The alternative explanation is that nutrient stoichiometry of forest trees is set to within an order of magnitude by the elemental abundance in the biologically available fraction which in turn is set by primary mineral weathering [the “you are what you root in” model of Elser et al. (2010)]. We consider the first explanation as less likely, because nutrients released from plant litter are usually directly re-utilized by forest trees to minimize nutrient loss and prevent nutrient deficiency. More importantly, concentrations of the biologically available mineral nutrients in the >3 m deep regolith fraction exceed those in the <3 m interval by one order of magnitude even though root density is highest at shallow levels. Thus, we regard it as likely that the first-order stoichiometry of the biologically available regolith fraction is set by a deep weathering source, whereas physiological demand adds deviations from the patterns of the bioavailable fraction that are smaller than one order of magnitude.
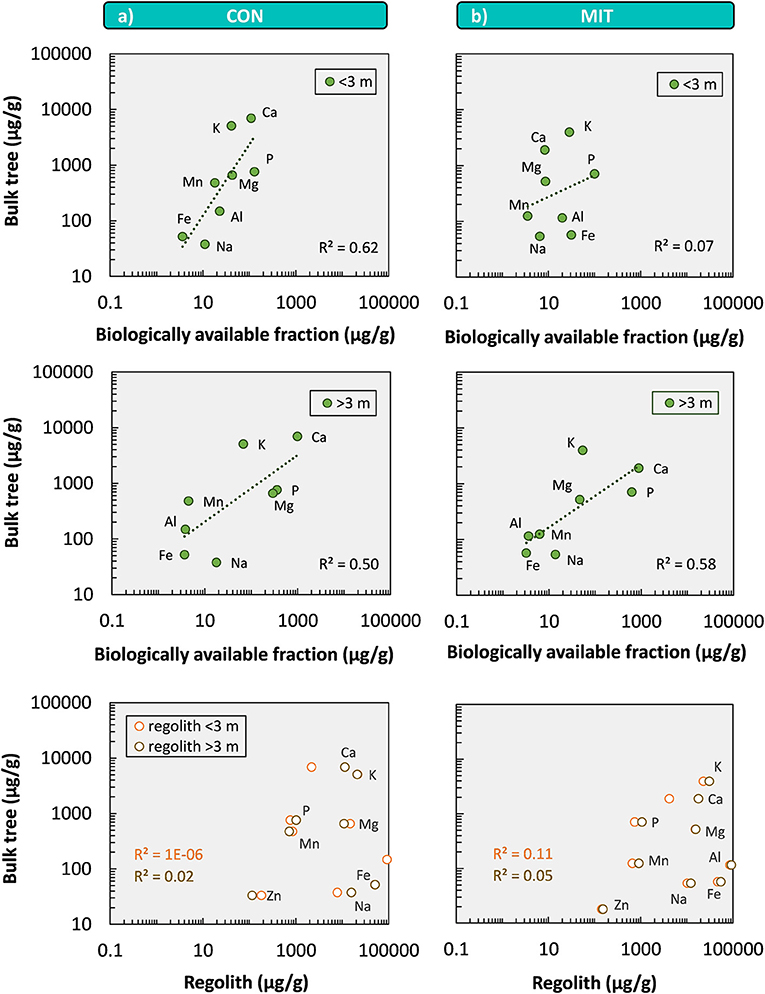
Figure 9. Ecological stoichiometry shown by element concentrations of bulk tree (average of Fagus sylvatica and Picea abies) vs. element concentrations of the biologically available fractions above 3 m depth (<3 m) and below 3 m depth (>3 m), and regolith above and below 3 m depth at CON (a) and MIT (b). Zn concentrations of the biologically available fraction were below the limit of detection.
Nutrient Uptake and Loss Fluxes
That nutrient uptake fluxes into forest trees () exceed weathering fluxes ) by several times for K, Ca, P, Mn, Zn at both study sites, and for Mg at MIT (Figure 5), means that after uptake, nutrients are returned to the forest floor by annual litterfall from which they can be re-utilized multiple times. We return to the quantification of nutrient recycling efficiency in section Maintaining a Healthy Nutrient Status by Regulation of Nutrient Recycling Loops. However, such cycling cannot proceed infinitely. Nutrients contained in plant litter can be lost from the forest ecosystem's forest floor as particulate by plant litter erosion () and as solute after litter decomposition, solubilisation and fast export along preferential flow pathways into the stream (). Neither loss flux is well-known, but both can be significant. Plant litter is particularly vulnerable to erosion, because the litter layer is—in contrast to the mineral soil—directly exposed to erosive forces such as overland flow, storm events, and wildfires. The export of particulate organic matter and coarse woody debris in sloping forest ecosystems can be substantial (Hilton, 2017) and significant for biogenic material including plant litter (Bormann et al., 1969; Webster et al., 1990; Heartsill Scalley et al., 2012). Uhlig et al. (2017) have used chemical and stable isotope mass balances in a forested ecosystem to show that, depending on ecological stoichiometry, up to more than 50% loss of elements can take place by erosion of plant debris. The litter layer is also constantly exposed to precipitation and is prone to microbial decomposition. Plant litter decay time scales for non-woody foliage are about 3 yr for both Picea abies and Fagus sylvatica (Albers et al., 2004), but in detail depend on water flow and microbial abundance.
In the absence of direct measurements of nutrient losses we roughly estimated the fluxes of plant litter erosion () and dissolved plant litter export () (section Organic Nutrient Cycle and Calculation of Fluxes and Inventories in Forest Ecosystems) and reported the estimates in Table 3. For the most plant-essential mineral nutrient P, amounts to ~23 mg m−2 yr−1 at both sites. Also, is not negligible and amounts to ~30 mg m−2 yr−1 at CON and to ~50 mg m−2 yr−1 at MIT. The sum of these fluxes is very similar to the P weathering flux that amounts to 84 mg m−2 yr−1 at CON and to 65 mg m−2 yr−1 at MIT (Table 3). Also, for the second-most plant-essential mineral nutrient K, the weathering flux and the loss flux from the forest floor are roughly similar. In contrast, for most of the other elements loss fluxes are lower than the weathering flux (Table 3).
We conclude that all elements lost from the forest floor are balanced by fresh nutrients released by weathering. In addition, we speculate that for those elements of which + is lower than a fraction of is lost via groundwater into drainage without being utilized by forest trees, and that in turn those nutrients in highest demand like P and K are transferred with the highest efficiency from their weathering source into trees.
Discussion
We guide the discussion by two important questions. (1) How is nutrient loss from the forest floor balanced to prevent nutrient deficit? (2) How is a healthy nutrient status maintained when nutrient supply fluxes from rock differ?
Balancing Nutrient Loss From the Forest Floor by Geogenic-Derived Nutrients
The geogenic nutrient source is an important contributor to long-term forest ecosystem nutrition. To estimate the timescale over which a given inventory lasts we combine nutrient inventories (Table 5) in the forest floor () and the biologically available fraction in the regolith () with nutrient fluxes (Table 3) of weathering, uptake, and loss. Nutrient loss and supply fluxes do not need to balance on the short-term, as for this assessment steady state is required only over extended periods. For simplicity, we limit this discussion to the frequently plant-growth limiting mineral nutrient P. Yet these calculations are applicable to all nutrients (Table 5), and in Figure 10 we also illustrate how they apply to K, the second-most important mineral nutrient.
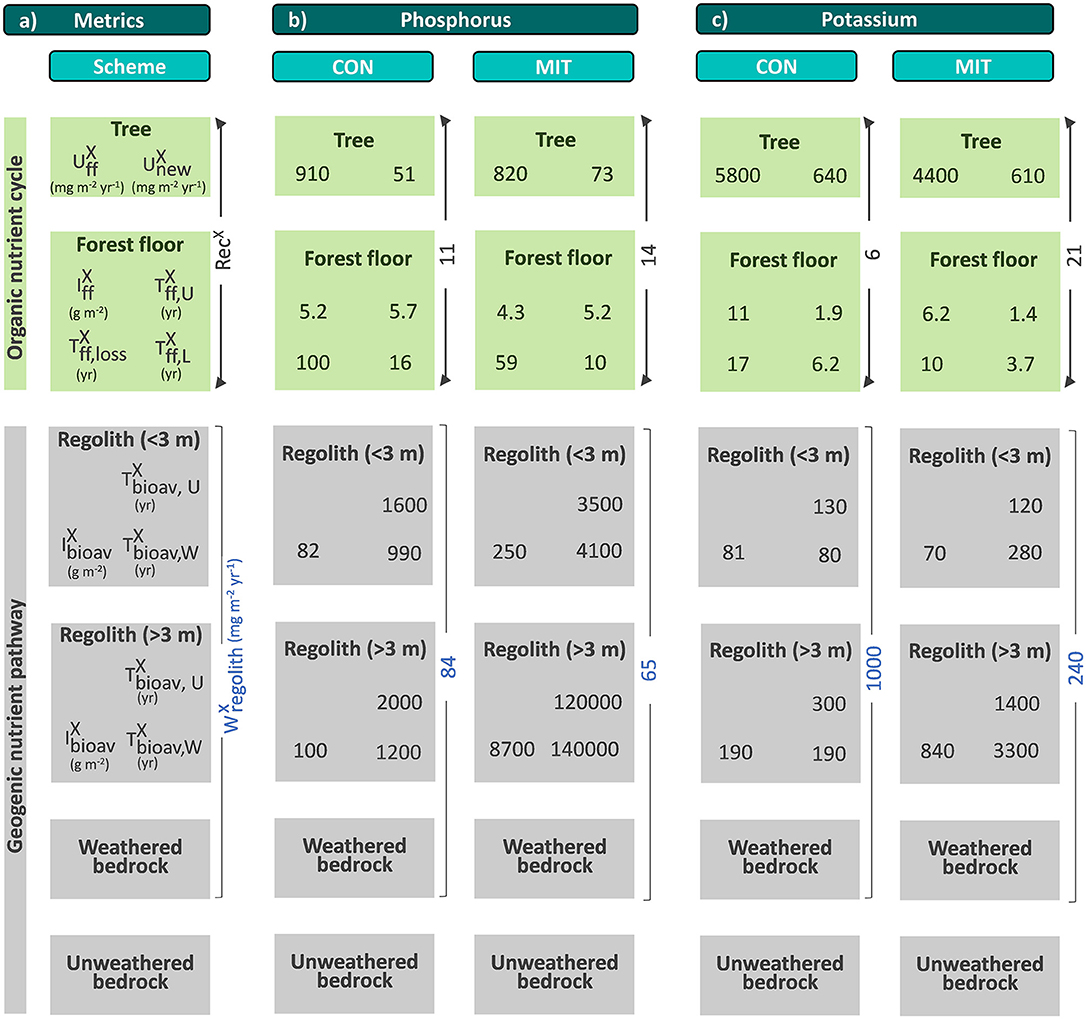
Figure 10. Fluxes (), inventories (), turnover times (), and recycling factors (RecX) of nutrients in the organic nutrient cycle and geogenic nutrient pathway (overview in a) for phosphorus (b) and potassium (c). is shown in vertical blue labels to the right of regolith boxes; RecX in black vertical labels to the right of organic cycle boxes. For detailed description on the metrics see Figure 1 and Table 1. Units of the metrics are given in left panels (RecX is dimensionless).
The need to replace nutrient losses arises because in the organic nutrient cycle the timescale of P in the forest floor until loss by plant litter erosion () and solute export () is about 60 yr (MIT) to 100 yr (CON) (Figure 10). Whilst residing in the forest floor, ~1,100 mg m−2 yr−1 (MIT) to ~1,400 mg m−2 yr−1 (CON) of P are leached (). That of this leached P only about 23 mg m−2 yr−1 of P is lost in the dissolved form () means that P is immediately re-utilized by renewed uptake to minimize dissolved nutrient loss (e.g., Jobbágy and Jackson, 2001, 2004). We indeed have further evidence for such cycling. Because total P uptake fluxes () from forest trees (900–960 mg m−2 yr−1) are an order of magnitude higher than P supply fluxes from chemical weathering (60–80 mg m−2 yr−1), efficient re-utilization of P from the forest floor takes place to ensure forest ecosystem nutrition. However, despite such intense re-utilization, P resides sufficiently long in the forest floor before renewed uptake to suffer loss. To show this we use turnover, or residence times in the forest floor that can be estimated to range between about 6 yr at both study sites before re-utilization , Figure 10) and about 10 to 16 yr with respect to replenishment by litterfall (, Figure 10). This residence time suffices for P to experience continuous nutrient loss by and . Thus, unless another nutrient inventory exists that provides a flux that permanently replaces the continuous nutrient loss from the forest floor, over decadal timescales would run out. P in the forest floor would be depleted on a timescale shorter than the life cycle of a forest tree, about 150–200 yr.
We have found such a potential reservoir through the geogenic nutrient pathway in the form of the inventory of the biologically available fraction (). In the upper regolith (<3 m) lasts for ~1.5 kyr at CON and for ~3.6 kyr at MIT (Figure 10) to replace the P loss incurred in the forest floor. In the lower regolith (>3 m) lasts even longer: ~2.0 kyr at CON and for ~120 kyr at MIT (Figure 10). We have also found that the chemical composition of this fraction exerts a first-order control over the stoichiometry of mineral nutrients in forest trees (see Figure 9) which serves as evidence for the likelihood of this deep source. However, if the biologically available P fraction permanently replenishes the forest floor over millennial timescales a deficit of P will develop there too. We suggest that the biologically available P fraction is in turn replenished by P release through chemical weathering. In the upper regolith (<3 m) the turnover timescale with respect to chemical weathering () is about 1.0 kyr at CON and about 4 kyr at MIT (Figure 10). In the lower regolith (>3 m) is about 1.2 kyr at CON and about 140 kyr at MIT (Figure 10). The fact that the turnover time of the biologically available fraction of P from weathering () is so similar to the “new” P required to balance P losses () strongly suggests that can be supplied from over millennial timescales.
We suggest that the permanent loss of nutrients from the forest floor is replaced by the deep regolith's biologically available nutrient inventory. This reservoir is in turn continuously replenished by slow rock weathering. Thus, even though the nutrient uptake flux () from the geogenic nutrient pathway is small compared to the total nutrient uptake (), this flux is of key importance in ensuring forest ecosystem nutrition over millennia. In terms of mechanisms, the organic nutrient cycle and the geogenic nutrient pathway are connected through dimorphic root systems comprising a surficial dense root network and deep taproots, which enable forest trees to access a groundwater table even at a depth of several meters (Fan et al., 2017). Thereby, deep roots ensure water supply during summer droughts (Brantley et al., 2017) and aid tree nutrition as groundwater is often chemically equilibrated with respect to forming and dissolving secondary precipitates (e.g., Maher, 2011). Such hydraulic redistribution of water and thus nutrients by roots is a well-known mechanism in arid and semi-arid landscapes (McCulley et al., 2004; Lambers et al., 2006). Given our results we suggest that this mechanism is likely to operate in temperate forest ecosystems too, which often experience summer droughts. However, the depth of nutrient uptake in arid to temperate climate zones contrasts with the shallow nutrient uptake depth in tropical rainforests (Poszwa et al., 2002), primarily through nutrient re-utilization from organic matter (e.g., Wilcke et al., 2017; Schuessler et al., 2018). Hence, pore water presents a reservoir of biologically available nutrients, which can be uplifted by roots and stored in the forest floor (e.g., Jobbágy and Jackson, 2004; Bullen and Chadwick, 2016).
Maintaining a Healthy Nutrient Status by Regulation of Nutrient Recycling Loops
Regardless of the importance of the geogenic nutrient source, nutrient re-utilization from plant litter presents the dominant source to short-term forest ecosystem nutrition. This source, however, has a limited lifetime due to permanent loss that correspondingly limits the number of possible recycling loops. As we suggest that the replenishment of this forest floor compartment originates from chemical weathering, we speculate that the number of nutrient recycling loops between forest trees and organic matter in the forest floor depends on the size of the geogenic-derived nutrient supply fluxes, namely chemical weathering (where ). As at our two study sites nutrient uptake fluxes are identical but nutrient supply fluxes from rock weathering are higher at CON than at MIT we can explore whether nutrient recycling between forest trees and the forest floor indeed reflects these differences. For example, the nutrient supply flux from rock weathering of the second-most plant-essential mineral nutrient K () is about 1,000 mg m−2 yr−1 at CON and only about 240 mg m−2 yr−1 at MIT. Yet, the nutrient uptake fluxes of K () are similar between sites. Because we have defined the nutrient recycling factor (RecX) as the ratio of to , the RecX of K suggests 6 re-utilization cycles between the forest floor and forest trees at CON, but 21 re-utilization cycles at MIT (Figure 10). For the other macronutrients Ca, Mg and P the nutrient recycling factor RecX at MIT exceeds RecX at CON (Table 5, Figure 5). We note, however, that for the less essential mineral nutrients Ca and Mg a substantial fraction of weathering fluxes is potentially directly drained via groundwater into the stream. Thus, the actual supply of these nutrients to forest trees presents a maximum flux and the calculated RecX provides correspondingly a minimum estimate.
We conclude that forest trees persist with similar primary production through the adjustment of the nutrient re-utilization loop toward higher efficiency under conditions of lower nutrient supply from chemical weathering. In other words, in the organic nutrient cycle nutrient loss is minimized to an extent that depends on nutrient supply by . With this efficient nutrient use the physiological needs of forest ecosystems are sustained.
Conclusions
We found that even though the nutrient supply fluxes from rock weathering differ substantially among the two study sites, different efficiencies of nutrient recycling from the forest floor regulate nutrient uptake fluxes to similar levels. We explored the mechanisms that regulate the uptake fluxes by considering the forest ecosystem in a mass balance comprising the shallow organic nutrient cycle and the belowground geogenic nutrient pathway. We found that the nutrient inventory in the forest floor is of finite size that lasts only for decades to nourish forest trees, because continuous nutrient loss through plant litter erosion and dissolved plant litter export occurs. Because an additional inorganic nutrient supplying flux in the form of atmospheric inputs is negligible this permanent nutrient loss is balanced by fluxes from a reservoir in the deep regolith. Even though only a minor fraction of the nutrient inventory in soil and saprolite is biologically available, its inventories in the upper regolith (<3 m) and even more so in the deep regolith (>3 m) exceed the nutrient inventory in the forest floor by orders of magnitude. This reservoir of geogenic-derived nutrients lasts for centuries to millennia, replaces the nutrient loss from the forest floor in the organic nutrient cycle. The reservoir of the biologically available fraction is in turn replenished through chemical weathering. The stoichiometry of this deep biologically available regolith nutrient reservoir might also set the stoichiometry of the forest trees to within an order of magnitude. Finally, we found that adjustment of the efficiency of re-utilization cycles from plant litter ensures sustained forest ecosystem nutrition even when nutrient supply or loss vary. Although the timescales over which the metrics used to derive our observations inevitably differ by orders of magnitude this study adds to the increasing evidence for the importance of a geological cycle, driven by erosion, that sustains forest ecosystem nutrition over centuries or longer.
Data Availability
The datasets for this study are deposited in the Data Repository accessible under the reference Uhlig and von Blanckenburg (2019).
Author Contributions
DU conducted field work, analyzed samples, interpreted data, and wrote text. FvB designed the study, interpreted data, and wrote text.
Funding
This work was funded in the framework of DFG Priority Program (SPP 1685) Ecosystem Nutrition: Forest strategies for limited phosphorus resources (grant no. BL 562/14-1).
Conflict of Interest Statement
The authors declare that the research was conducted in the absence of any commercial or financial relationships that could be construed as a potential conflict of interest.
Acknowledgments
We are grateful to the DFG Priority Program (SPP 1685) Ecosystem Nutrition: Forest strategies for limited phosphorus resources for funding and Friederike Lang (Albert-Ludwigs-University of Freiburg) for its coordination and discussion. We also thank the Bayerische Landesanstalt für Wald und Forstwirtschaft (LWF) and the Forstliche Versuchsanstalt Baden-Wuerttemberg (FVA) for providing wet deposition and litterfall data. For X-ray fluorescence analyses and X-ray diffraction analyses we are thankful to R. Naumann (GFZ) and A. Gottsche (GFZ). For phosphorus Hedley sequential fractionation we are grateful to A. Rodionov (INRES), S. L. Bauke (INRES), and W. Amelung (INRES). J. A. Schuessler (GFZ) and H. Wittmann (GFZ) are acknowledged for analytical support and R. Kapannusch (GFZ) is acknowledged for sample preparation. M. Henehan (GFZ) is thanked for a review of an early version of this paper. We are grateful to Beth A. Fisher and Gary E. Stinchcomb for their detailed and constructive reviews.
Supplementary Material
The Supplementary Material for this article can be found online at: https://www.frontiersin.org/articles/10.3389/feart.2019.00159/full#supplementary-material
References
Aciego, S. M., Riebe, C. S., Hart, S. C., Blakowski, M. A., Carey, C. J., Aarons, S. M., et al. (2017). Dust outpaces bedrock in nutrient supply to montane forest ecosystems. Nat. Commun. 8, 1–10. doi: 10.1038/ncomms14800
Aerts, R. (1996). Nutrient resorption from senescing leaves of perennials : are there general patterns? J. Ecol. 84, 597–608. doi: 10.2307/2261481
Aerts, R., and Chapin, F. S. (1999). The mineral nutrition of wild plants revisited: a re-evaluation of processes and patterns. Adv. Ecol. Res. 30, 1–67. doi: 10.1016/S0065-2504(08)60016-1
Albers, D., Migge, S., Schaefer, M., and Scheu, S. (2004). Decomposition of beech leaves (Fagus sylvatica) and spruce needles (Picea abies) in pure and mixed stands of beech and spruce. Soil Biol. Biochem. 36, 155–164. doi: 10.1016/j.soilbio.2003.09.002
Anderson, S. P., Dietrich, W. E., and Brimhall, G. H. (2002). Weathering profiles, mass-balance analysis, and rates of solute loss: Linkages between weathering and erosion in a small, steep catchment. Bull. Geol. Soc. Am. 114, 1143–1158. doi: 10.1130/0016-7606(2002)114<1143:WPMBAA>2.0.CO;2
Augusto, L., Achat, D. L., Jonard, M., Vidal, D., and Ringeval, B. (2017). Soil parent material—A major driver of plant nutrient limitations in terrestrial ecosystems. Glob. Chang. Biol. 23, 3808–3824. doi: 10.1111/gcb.13691
Barth, T. (1961). Abundance of the elements, areal averages and geochemical cycles. Geochim. Cosmochim. Acta 23, 1–8. doi: 10.1016/0016-7037(61)90086-2
Baruah, B. K., Das, B., Haque, A., Medhi, C., and Misra, A. K. (2011). Sequential extraction of common metals (Na, K., Ca and Mg) from surface soil. J. Chem. Pharm. Res. 3, 565–573.
Berger, T. W., Untersteiner, H., Toplitzer, M., and Neubauer, C. (2009). Nutrient fluxes in pure and mixed stands of spruce (Picea abies) and beech (Fagus sylvatica). Plant Soil 322, 317–342. doi: 10.1007/s11104-009-9918-z
Blum, J. D., and Erel, Y. (1995). A silicate weathering mechanism linking increases in marine 87Sr/86Sr with global glaciation. Nature 373, 415–418. doi: 10.1038/373415a0
Bormann, F. H., Likens, G. E., and Eaton, J. S. (1969). Biotic regulation of particulate and solution losses from a forest ecosystem. Bioscience 19, 600–610. doi: 10.2307/1294934
Box, G. E. P., and Muller, M. E. (1958). A note on the generation of random normal deviates. Ann. Math. Stat. 29, 610–611. doi: 10.1214/aoms/1177706645
Brady, N. C., and Weil, R. R. (2002). The nature and properties of soils, 13th. Pearson Educ. 482, 621–624.
Brantley, S. L., Eissenstat, D. M., Marshall, J. A., Godsey, S. E., Balogh-Brunstad, Z., Karwan, D. L., et al. (2017). Reviews and syntheses: on the roles trees play in building and plumbing the critical zone. Biogeosciences 14, 5115–5142. doi: 10.5194/bg-14-5115-2017
Brantley, S. L., Goldhaber, M. B., and Vala Ragnarsdottir, K. (2007). Crossing disciplines and scales to understand the critical zone. Elements 3, 307–314. doi: 10.2113/gselements.3.5.307
Brantley, S. L., and Lebedeva, M. (2011). Learning to Read the chemistry of regolith to understand the critical zone. Annu. Rev. Earth Planet. Sci. 39, 387–416. doi: 10.1146/annurev-earth-040809-152321
Brimhall, G. H., Chadwick, O. A., Lewis, C. J., Compston, W., Williams, I. S., Danti, K. J., et al. (1992). Deformational mass transport and invasive processes in soil evolution. Science 255, 695–702. doi: 10.1126/science.255.5045.695
Brimhall, G. H., and Dietrich, W. E. (1987). Constitutive mass balance relations between chemical composition, volume, density, porosity, and strain in metasomatic hydrochemical systems: results on weathering and pedogenesis. Geochim. Cosmochim. Acta 51, 567–587. doi: 10.1016/0016-7037(87)90070-6
Buendía, C., Kleidon, A., and Porporato, A. (2010). The role of tectonic uplift, climate, and vegetation in the long-term terrestrial phosphorous cycle. Biogeosciences 7, 2025–2038. doi: 10.5194/bg-7-2025-2010
Bullen, T., and Chadwick, O. (2016). Ca, Sr and Ba stable isotopes reveal the fate of soil nutrients along a tropical climosequence in Hawaii. Chem. Geol. 422, 25–45. doi: 10.1016/j.chemgeo.2015.12.008
Chadwick, O. A., Derry, L. A., Vitousek, P. M., Huebert, B. J., and Hedin, L. O. (1999). Changing sources of nutrients during four million years of ecosystem development. Nature 397, 491–497. doi: 10.1038/17276
Chapin, F. S. (1980). The mineral nutrition of wild plants. Annu. Rev. Ecol. Syst. 11, 233–260. doi: 10.1146/annurev.es.11.110180.001313
Chapin, S. F., Matson, P. A., and Vitousek, P. M. (2012). Principles of Terrestrial Ecosystem Ecology, Second. New York, NY; Dordrecht; Heidelberg; London: Springer. doi: 10.1007/978-1-4419-9504-9
Chaudhuri, S., Clauer, N., and Semhi, K. (2007). Plant decay as a major control of river dissolved potassium: a first estimate. Chem. Geol. 243, 178–190. doi: 10.1016/j.chemgeo.2007.05.023
Chifflard, P., Didszun, J., and Zepp, H. (2008). Skalenübergreifende Prozess-Studien zur Abflussbildung in Gebieten mit periglazialen Deckschichten (Sauerland, Deutschland). Grundwasser 13, 27–41. doi: 10.1007/s00767-007-0058-1
Cleveland, C. C., Houlton, B. Z., Smith, W. K., Marklein, A. R., Reed, S. C., Parton, W., et al. (2013). Patterns of new versus recycled primary production in the terrestrial biosphere. Proc. Natl. Acad. Sci.U.S.A. 110, 12733–12737. doi: 10.1073/pnas.1302768110
Cole, D. W., and Rapp, M. (1981). “Elemental cycling in forest ecosystems,” in Dynamic Properties of Forest Ecosystems. eds D. E. Reichle (Cambridge, NY: Cambridge University Press), 341–410.
Cortina, J., and Vallejo, V. R. (1995). Nitrogen and phosphorus leaching from the forest floor of a mature Pinus radiata stand. Geoderma 66, 321–330. doi: 10.1016/0016-7061(95)00006-A
Dixon, J. L., and von Blanckenburg, F. (2012). Soils as pacemakers and limiters of global silicate weathering. Comptes. Rendus. Geosci. 344, 597–609. doi: 10.1016/j.crte.2012.10.012
Elser, J. J., Bracken, M. E., Cleland, E. E., Gruner, D. S., Harpole, W. S., Hillebrand, H., et al. (2007). Global analysis of nitrogen and phosphorus limitation of primary producers in freshwater, marine and terrestrial ecosystems. Ecol. Lett. 10, 1135–1142. doi: 10.1111/j.1461-0248.2007.01113.x
Elser, J. J., Fagan, W. F., Kerkhoff, A. J., Swenson, N. G., and Enquist, B. J. (2010). Biological stoichiometry of plant production: metabolism, scaling and ecological response to global change. New Phytol. 186, 593–608. doi: 10.1111/j.1469-8137.2010.03214.x
Fan, Y., Miguez-Macho, G., Jobbágy, E. G., Jackson, R. B., and Otero-Casal, C. (2017). Hydrologic regulation of plant rooting depth. Proc. Natl. Acad. Sci.U.S.A. 114, 10572–10577. doi: 10.1073/pnas.1712381114
Ferrier, K. L., Kirchner, J. W., and Finkel, R. C. (2012). Weak influences of climate and mineral supply rates on chemical erosion rates: measurements along two altitudinal transects in the Idaho Batholith. J. Geophys. Res. Earth Surf. 117, 1–21. doi: 10.1029/2011JF002231
Fisher, B. A., Rendahl, A. K., Aufdenkampe, A. K., and Yoo, K. (2017). Quantifying weathering on variable rocks, an extension of geochemical mass balance: critical zone and landscape evolution. Earth Surf. Process Landforms 42, 2457–2468. doi: 10.1002/esp.4212
George, T. S., Fransson, A., Hammond, J. P., and White, P. J. (2011). Phosphorus nutrition: rhizosphere processes plant response and adaptations. Phosphor. Action 2011, 245–271. doi: 10.1007/978-3-642-15271-9_10
Gibson, M. J., and Farmer, J. G. (1986). Multi-step sequential chemical extraction of heavy metals from urban soils. Environ. Pollut. B. Chem. Phys. 11, 117–135. doi: 10.1016/0143-148X(86)90039-X
Gorham, E., Vitousek, P. M., and Reiners, W. A. (1979). The regulation of chemical budgets over the course of terrestrial ecosystem succession. Annu. Rev. Ecol. Syst. 10, 53–84. doi: 10.1146/annurev.es.10.110179.000413
Göttlein, A., Baier, R., and Mellert, K. H. (2011). Neue Ernährungskennwerte für die forstlichen Hauptbaumarten in Mitteleuropa - Eine statistische Herleitung aus VAN DEN BURG'S Literaturzusammenstellung. Allg. Forst.- Jagdzeitung. 182, 173–186.
Hahm, W. J., Riebe, C. S., Lukens, C. E., and Araki, S. (2014). Bedrock composition regulates mountain ecosystems and landscape evolution. Proc. Natl. Acad. Sci.U.S.A. 111, 3338–3343. doi: 10.1073/pnas.1315667111
He, X.-T., Logan, T. J., and Traina, S. J. (1995). Physical and chemical characteristics of selected US municipal solid waste composts. J. Environ. Qual. 24, 543–552. doi: 10.2134/jeq1995.00472425002400030022x
Heartsill Scalley, T., Scatena, F. N., Moya, S., and Lugo, A. E. (2012). Long-term dynamics of organic matter and elements exported as coarse particulates from two Caribbean montane watersheds. J. Trop. Ecol. 28, 127–139. doi: 10.1017/S0266467411000733
Heimsath, A. M., Dietrich, W. E., Nishiizumi, K., and Finkel, R. C. (1997). The soil production function and landscape equilibrium. Nature 388, 358–361. doi: 10.1038/41056
Hellsten, S., Helmisaari, H. S., Melin, Y., Skovsgaard, J. P., Kaakinen, S., Kukkola, M., et al. (2013). Nutrient concentrations in stumps and coarse roots of Norway spruce, Scots pine and silver birch in Sweden, Finland and Denmark. For. Ecol. Manage. 290, 40–48. doi: 10.1016/j.foreco.2012.09.017
Hewawasam, T., von Blanckenburg, F., Bouchez, J., Dixon, J. L., Schuessler, J. A., and Maekeler, R. (2013). Slow advance of the weathering front during deep, supply-limited saprolite formation in the tropical Highlands of Sri Lanka. Geochim. Cosmochim. Acta 118, 202–230. doi: 10.1016/j.gca.2013.05.006
Hillis, W. E. (2006). Heartwood and Tree Exudates. Berlin; Heidelberg; New York, NY; London; Paris; Tokyo: Springer-Verlag.
Hilton, R. G. (2017). Climate regulates the erosional carbon export from the terrestrial biosphere. Geomorphology 277, 118–132. doi: 10.1016/j.geomorph.2016.03.028
Homann, P. S. (2012). Convergence and divergence of nutrient stoichiometry during forest litter decomposition. Plant Soil 358, 251–263. doi: 10.1007/s11104-012-1174-y
Houlton, B. Z., Morford, S. L., and Dahlgren, R. A. (2018). Convergent evidence for widespread rock nitrogen sources in Earth' s surface environment. Science 360, 58–62. doi: 10.1126/science.aan4399
Ibarra, D. E., Caves, J. K., Moon, S., Thomas, D. L., Hartmann, J., Chamberlain, C. P., et al. (2016). Differential weathering of basaltic and granitic catchments from concentration–discharge relationships. Geochim. Cosmochim. Acta 190, 265–293. doi: 10.1016/j.gca.2016.07.006
Jacobsen, C., Rademacher, P., Meesenburg, H., and Meiwes, K. J. (2003). Gehalte chemischer Elemente in Baumkompartimenten. Literaturstudie und Datensammlung. Berichte des Forschungszentrums Waldökosysteme.
Jansa, J., Finlay, R., Smith, F. A., and Smith, S. E. (2011). Role of mycorrhizal symbioses in phosphorus cycling. Phosphor. Action 2011, 137–168. doi: 10.1007/978-3-642-15271-9_6
Jarvis, N. J. (2007). A review of non-equilibrium water flow and solute transport in soil macropores: principles, controlling factors and consequences for water quality. Eur. J. Soil Sci. 58, 523–546. doi: 10.1111/j.1365-2389.2007.00915.x
Jobbágy, E. G., and Jackson, R. B. (2001). The distribution of soil nutrients with depth: global patterns and the imprint of plants. Biogeochemistry 53, 51–77. doi: 10.1023/A:1010760720215
Jobbágy, E. G., and Jackson, R. B. (2004). The uplift of soil nutrients by plants: biogeochemical consequences across scales. Ecology 85, 2380–2389. doi: 10.1890/03-0245
Jochum, K. P., Nohl, U., Herwig, K., Lammel, E., Stoll, B., and Hofmann, A. W. (2005). GeoReM: a new geochemical database for reference materials and isotopic standards. Geostand. Geoanal. Res. 29, 333–338. doi: 10.1111/j.1751-908X.2005.tb00904.x
Johnson, C. E., Siccama, T. G., Denny, E. G., Koppers, M. M., and Vogt, D. J. (2014). In situ decomposition of northern hardwood tree boles: decay rates and nutrient dynamics in wood and bark. Can. J. For. Res. 44, 1515–1524. doi: 10.1139/cjfr-2014-0221
Jongmans, A. G., Van Breemen, N., Lundström, U., van Hees, P. A. W., Finlay, R. D., Srinivasan, M., et al. (1997). Rock-eating fungi. Nature 389, 682–683. doi: 10.1038/39493
Julich, D., Julich, S., and Feger, K. H. (2017). Phosphorus in preferential flow pathways of forest soils in Germany. Forests 8:2017. doi: 10.3390/f8010019
Jung, M., Reichstein, M., Margolis, H. A., Cescatti, A., Richardson, A. D., Arain, M. A., et al. (2011). Global patterns of land-atmosphere fluxes of carbon dioxide, latent heat, and sensible heat derived from eddy covariance, satellite, and meteorological observations. J. Geophys. Res. Biogeosciences 116, 1–16. doi: 10.1029/2010JG001566
Kaiser, K., Guggenberger, G., and Haumaier, L. (2003). Organic phosphorus in soil water under a European beech (Fagus sylvatica L.) stand in Northeastern Bavaria, Germany : seasonal variability and changes with soil depth. Biogeochemistry 66, 287–310. doi: 10.1023/B:BIOG.0000005325.86131.5f
Killingbeck, K. T. (1996). Nutrients in senesced leaves : keys to the search for potential resorption and resorption proficiency. Ecology 77, 1716–1727. doi: 10.2307/2265777
Kleber, A., and Terhorst, B. (2013). Mid-Latitude Slope Deposits (Cover Beds). Amsterdam; Boston, MA; Heidelberg; London; New York, NY; Oxford; Paris; San Diego, CA; San Francisco, CA; Singapore, Sydney, Tokyo.
Lal, D. (1991). Cosmic ray labeling of erosion surfaces: In situ nuclide production rates and erosion models. Earth Planet. Sci. Lett. 104, 424–439. doi: 10.1016/0012-821X(91)90220-C
Lambers, H., Shane, M. W., Cramer, M. D., Pearse, S. J., and Veneklaas, E. J. (2006). Root structure and functioning for efficient acquisition of phosphorus: matching morphological and physiological traits. Ann. Bot. 98, 693–713. doi: 10.1093/aob/mcl114
Lang, F., Bauhus, J., Frossard, E., George, E., Kaiser, K., Kaupenjohann, M., et al. (2016). Phosphorus in forest ecosystems: new insights from an ecosystem nutrition perspective. J. Plant Nutr. Soil Sci. 179, 129–135. doi: 10.1002/jpln.201500541
Lang, F., Krüger, J., Amelung, W., Willbold, S., Frossard, E., Bünemann, E. K., et al. (2017). Soil phosphorus supply controls P nutrition strategies of beech forest ecosystems in Central Europe. Biogeochemistry 136, 5–29. doi: 10.1007/s10533-017-0375-0
Lauer, F., Pätzold, S., Gerlach, R., Protze, J., Willbold, S., and Amelung, W. (2013). Phosphorus status in archaeological arable topsoil relicts-Is it possible to reconstruct conditions for prehistoric agriculture in Germany? Geoderma 207–208, 111–120. doi: 10.1016/j.geoderma.2013.05.005
Lebedeva, M. I., Fletcher, R. C., and Brantley, S. L. (2010). A mathematical model for steady-state regolith production at constant erosion rate. Earth Surf. Process Landforms 35, 508–524. doi: 10.1002/esp.1954
Lee, F. Y., and Kittrick, J. A. (1984). Elements associated with the cadmium phase in a harbor sediment as determined with the electron beam microprobe1. J. Environ. Qual. 13, 337–340. doi: 10.2134/jeq1984.00472425001300030002x
Lin, H. (2010). Earth' s Critical Zone and hydropedology : concepts, characteristics, and advances. Hydrol. Earth Syst. Sci. 14:25. doi: 10.5194/hess-14-25-2010
Maher, K. (2010). The dependence of chemical weathering rates on fluid residence time. Earth Planet. Sci. Lett. 294, 101–110. doi: 10.1016/j.epsl.2010.03.010
Maher, K. (2011). The role of fluid residence time and topographic scales in determining chemical fluxes from landscapes. Earth Planet. Sci. Lett. 312, 48–58. doi: 10.1016/j.epsl.2011.09.040
McCulley, R. L., Jobbágy, E. G., Pockman, W. T., and Jackson, R. B. (2004). Nutrient uptake as a contributing explanation for deep rooting in arid and semi-arid ecosystems. Oecologia 141, 620–628. doi: 10.1007/s00442-004-1687-z
Meerts, P. (2002). Mineral nutrient concentrations in sapwood and heartwood: a literature review. Ann. For. Sci. 59, 713–722. doi: 10.1051/forest:2002059
Moore, T. R., Trofymow, J. A., Siltanen, M., Prescott, C., and Canadian Intersite Decomposition Experiment Working Group. (2005). Patterns of decomposition and carbon, nitrogen, and phosphorus dynamics of litter in upland forest and peatland sites in central Canada. Can. J. For. Res. 35, 133–142. doi: 10.1139/x04-149
Murphy, J., and Riley, J. (1962). A modified single solution method for the determination of phosphate in natural water. Anal. Chem. Acta 27, 31–36. doi: 10.1016/S0003-2670(00)88444-5
Oeser, R. A., Stroncik, N., Moskwa, L., Bernhard, N., Schaller, M., Canessa, R., et al. (2018). Catena chemistry and microbiology of the critical zone along a steep climate and vegetation gradient in the Chilean Coastal Cordillera. Catena 170, 183–203. doi: 10.1016/j.catena.2018.06.002
Parniske, M. (2008). Arbuscular mycorrhiza: the mother of plant root endosymbioses. Nat. Rev. Microbiol. 6, 763–775. doi: 10.1038/nrmicro1987
Peltzer, D. A., Wardle, D. A., Allison, V. J., Baisden, W. T., Bardgett, R. D., Chadwick, O. A., et al. (2010). Understanding ecosystem retrogression. Ecol. Monogr. 80, 509–529. doi: 10.1890/09-1552.1
Porder, S., Vitousek, P. M., Chadwick, O. A., Chamberlain, P., and Hilley, G. E. (2007). Uplift, erosion, and phosphorus limitation in terrestrial ecosystems. Ecosystems 10, 158–170. doi: 10.1007/s10021-006-9011-x
Poszwa, A., Dambrine, E., Ferry, B., Pollier, B., and Loubet, M. (2002). Do deep tree roots provide nutrients to the tropical rainforest? Biogeochemistry 60, 97–118. doi: 10.1023/A:1016548113624
Qualls, R. G., Haines, B. L., and Swank, T. (1991). Fluxes of dissolved organic nutrients and humic substances in a deciduous forest. Ecology 72, 254–266. doi: 10.2307/1938919
Raab, T., Leopold, M., and Völkel, J. (2007). Character, age, and ecological significance of pleistocene periglacial slope deposits in germany. Phys. Geogr. 28, 451–473. doi: 10.2747/0272-3646.28.6.451
Resner, K., Yoo, K., Sebestyen, S. D., Aufdenkampe, A., Hale, C., Lyttle, A., et al. (2014). Invasive earthworms deplete key soil inorganic nutrients (Ca, Mg, K, and P) in a Northern Hardwood Forest. Ecosystems 18, 89–102. doi: 10.1007/s10021-014-9814-0
Riebe, C. S., Kirchner, J. W., and Finkel, R. C. (2003). Long-term rates of chemical weathering and physical erosion from cosmogenic nuclides and geochemical mass balance. Geochim. Cosmochim. Acta 67, 4411–4427. doi: 10.1016/S0016-7037(03)00382-X
Scatena, F. N., and Lugo, A. E. (1995). Geomorphology, disturbance, and the soil and vegetation of two subtropical wet steepland watersheds of Puerto Rico. Geomorphology 13, 199–213. doi: 10.1016/0169-555X(95)00021-V
Schaller, M., Von Blanckenburg, F., Veit, H., and Kubik, P. W. (2003). Influence of periglacial cover beds on in situ-produced cosmogenic 10Be in soil sections. Geomorphology 49, 255–267. doi: 10.1016/S0169-555X(02)00189-7
Schuessler, J. A., Kämpf, H., Koch, U., and Alawi, M. (2016). Earthquake impact on iron isotope signatures recorded in mineral spring water. J. Geophys. Res. Solid Earth 121, 8548–8568. doi: 10.1002/2016JB013408
Schuessler, J. A., von Blanckenburg, F., Bouchez, J., Uhlig, D., and Hewawasam, T. (2018). Nutrient cycling in a tropical montane rainforest under a supply-limited weathering regime traced by elemental mass balances and Mg stable isotopes. Chem. Geol. 497, 74–87. doi: 10.1016/j.chemgeo.2018.08.024
Sierra, C. A., Müller, M., Metzler, H., Manzoni, S., and Trumbore, S. E. (2017). The muddle of ages, turnover, transit, and residence times in the carbon cycle. Glob. Chang. Biol. 23, 1763–1773. doi: 10.1111/gcb.13556
Sohrt, J., Puhlmann, H., and Weiler, M. (2018). Phosphorus transport in lateral subsurface flow at forested hillslopes. Soil Discuss. 2018, 1–20. doi: 10.5194/soil-2018-13
Spohn, M., and Sierra, C. A. (2018). How long do elements cycle in terrestrial ecosystems? Biogeochemistry 2018, 1–15. doi: 10.1007/s10533-018-0452-z
Stone, J. O. (2000). Air pressure and cosmogenic isotope production. J Geophys. Res. Solid Earth 105, 23753–23759. doi: 10.1029/2000JB900181
Tessier, A., Campbell, P. G. C., and Bisson, M. (1979). Sequential extraction procedure for the speciation of particulate trace metals. Anal. Chem. 51, 844–851. doi: 10.1021/ac50043a017
Tiessen, H., and Moir, J. O. (1993). Characterization of available P by sequential extraction. Soil Sampl. Methods Anal. 7, 5–229.
Uhlig, D., Schuessler, J. A., Bouchez, J., Dixon, J. L., and von Blanckenburg, F. (2017). Quantifying nutrient uptake as driver of rock weathering in forest ecosystems by magnesium stable isotopes. Biogeosciences 14, 3111–3128. doi: 10.5194/bg-14-3111-2017
Uhlig, D., and von Blanckenburg, F. (2019). Geochemical and Isotope Data on Rock Weathering, and Nutrient Balances During Fast Forest Floor Turnover in Montane, Temperate Forest Ecosystems. GFZ Data Services. doi: 10.5880/GFZ.3.3.2019.004
Vitousek, P., Chadwick, O., Matson, P., Allison, S., Derry, L., Kettley, L., et al. (2003). Erosion and the rejuvenation of weathering-derived nutrient supply in an old tropical landscape. Ecosystems 6, 762–772. doi: 10.1007/s10021-003-0199-8
Vitousek, P. M., Porder, S., Houlton, B. Z., and Chadwick, O. A. (2010). Terrestrial phosphorus limitation: mechanisms, implications, and nitrogen-phosphorsu interactions. Ecol. Appl. 20, 5–15. doi: 10.1890/08-0127.1
von Blanckenburg, F. (2006). The control mechanisms of erosion and weathering at basin scale from cosmogenic nuclides in river sediment. Earth Planet. Sci. Lett. 237, 462–479. doi: 10.1016/j.epsl.2005.06.030
von Blanckenburg, F., Hewawasam, T., and Kubik, P. W. (2004). Cosmogenic nuclide evidence for low weathering and denudation in the wet, tropical highlands of Sri Lanka. J. Geophys. Res. 109, 1–22. doi: 10.1029/2003JF000049
von Blanckenburg, F., Wittmann, H., and Schuessler, J. A. (2016). HELGES: helmholtz laboratory for the geochemistry of the earth surface. J Large Scale Res. Facil. 2, 1–5. doi: 10.17815/jlsrf-2-141
Walker, T. W., and Syers, J. K. (1976). The fate of phosphorus during pedogenesis. Geoderma 15, 1–19. doi: 10.1016/0016-7061(76)90066-5
Wardle, D. A., Bardgett, R. D., Klironomos, J. N., Setälä, H., van der Putten, W. H., and Wall, D. H. (2004a). Ecological linkages between aboveground and belowground biota. Science 304, 1629–1633. doi: 10.1126/science.1094875
Wardle, D. A., Walker, L. R., and Bardgett, R. D. (2004b). Ecosystem properties and forest decline in constrasting long-term chronosequences. Science 305, 509–513. doi: 10.1126/science.1098778
Webster, J. R., Golladay, S. W., Benfield, E. F., D'Angelo, D. J., and Peters, G. T. (1990). Effects of forest disturbance on particulate organic matter budgets of small streams. Am. Benthol. Soc. 9, 120–140. doi: 10.2307/1467446
White, A. F., and Blum, A. E. (1995). Effects of climate on chemical, weathering in watersheds. Geochim. Cosmochim. Acta 59, 1729–1747. doi: 10.1016/0016-7037(95)00078-E
White, A. F., Blum, A. E., Bullen, T. D., Vivit, D. V., Schulz, M., and Fitzpatrick, J. (1999). The effect of temperature on experimental and natural chemical weathering rates of granitoid rocks. Geochim. Cosmochim. Acta 63, 3277–3291. doi: 10.1016/S0016-7037(99)00250-1
Wilcke, W., Velescu, A., Leimer, S., Bigalke, M., Boy, J., and Valarezo, C. (2017). Biological versus geochemical control and environmental change drivers of the base metal budgets of a tropical montane forest in Ecuador during 15 years. Biogeochemistry 136, 167–189. doi: 10.1007/s10533-017-0386-x
Wilcke, W., Yasin, S., Abramowski, U., Valarezo, C., and Zech, W. (2002). Nutrient storage and turnover in organic layers under tropical montane rain forest in Ecuador. Eur. J. Soil Sci. 53, 15–27. doi: 10.1046/j.1365-2389.2002.00411.x
Keywords: mineral nutrients, ecosystem nutrition, chemical weathering, plant litter erosion, dissolved plant litter export
Citation: Uhlig D and von Blanckenburg F (2019) How Slow Rock Weathering Balances Nutrient Loss During Fast Forest Floor Turnover in Montane, Temperate Forest Ecosystems. Front. Earth Sci. 7:159. doi: 10.3389/feart.2019.00159
Received: 26 March 2019; Accepted: 05 June 2019;
Published: 17 July 2019.
Edited by:
Dionisios Gasparatos, Aristotle University of Thessaloniki, GreeceReviewed by:
Beth A. Fisher, University of Minnesota Twin Cities, United StatesGary E. Stinchcomb, Murray State University, United States
Copyright © 2019 Uhlig and von Blanckenburg. This is an open-access article distributed under the terms of the Creative Commons Attribution License (CC BY). The use, distribution or reproduction in other forums is permitted, provided the original author(s) and the copyright owner(s) are credited and that the original publication in this journal is cited, in accordance with accepted academic practice. No use, distribution or reproduction is permitted which does not comply with these terms.
*Correspondence: David Uhlig, d.uhlig@fz-juelich.de orcid.org/0000-0002-0954-689X
‡Friedhelm von Blanckenburg orcid.org/0000-0002-2964-717X
†Present Address: David Uhlig, Institute of Bio- and Geosciences (IBG-3) Agrosphere, Forschungszentrum Jülich, Jülich, Germany