Correlative Visualization of Root Mucilage Degradation Using X-ray CT and MRI
 Arjen van Veelen
 Monique C. Tourell2
  Nicolai Koebernick
 Tiina Roose
- 1Bioengineering Sciences Research Group, Faculty of Engineering and the Environment, University of Southampton, Southampton, United Kingdom
- 2Department of Chemistry, Faculty of Natural and Environmental Sciences, University of Southampton, Southampton, United Kingdom
Root exudates are a crucial component of the rhizosphere. Often, they take a form of a gel exuded by the plant roots and are thought to influence the soil aggregation, root penetration into soil, soil nutrient availability, immobilization of toxic cations, and microbial activity amongst other things. In addition, the capacity of exudates to store water makes the plants potentially less susceptive to drought. Major components of root exudates are high molecular weight organic compounds consisting of predominantly polysaccharides and proteins, which makes it challenging to visualize using current rhizosphere visualization techniques, such as X-ray computed tomography (CT). In this contribution, we use correlative X-ray CT (resolution ~20 μm) in combination with Magnetic Resonance Imaging (MRI, resolution ~120 μm) to set up groundwork to enable in situ visualization of mucilage in soil. This multimodal approach is necessary because mucilage density closely matches that of water. We use chia seeds as mucilage analog, because it has been found to have a similar consistency to root mucilage. Moreover, to understand mucilage development in time, a series of samples made by chia seeds placed in different porous media were prepared. Structurally and chemically, mucilage breaks down toward a water-like substance over a course of 2 weeks. Depending on its relative concentration, these changes were found to be less dominant when seeds were mixed in porous media. Having set up the groundwork for correlative imaging of chia seeds in water and an artificial soil (Nafion and sand/beads) this enables us to expand this imaging to deal with plant root exudates under natural conditions.
Introduction
We rely on soil to support the crops on which we depend. Less obviously we also rely on soil for a host of “ecosystem services”: for example, soil contains large quantities of carbon which would otherwise be released into the atmosphere where it would contribute to climate change, and soil buffers the hydrological system, greatly reducing the risk of flooding after heavy rain. Given its importance it is not surprising that soil, especially its interaction with plant roots, has been a focus for many researchers. However, the complex and optically opaque nature of soil has always made it a difficult medium to study. Soil is a complex medium. It is composed of different materials (minerals, organic matter, water, microorganisms) of diverse morphologies and length-scales (from centimeters to nanometers), which aggregate together to form an intricate porous material. While many key properties of soil are determined by processes taking place at the micrometer-scale (often called pore scale), within this complex material we have traditionally only been able to measure and observe soil function at the larger, meter-scale (usually referred to as the macroscale or field scale). We can manipulate soil systems at the macroscale and empirically observe what occurs, and this empirical description is useful, but it offers no scope to truly predict how the system would respond to modification. Critical to soil function are processes (nutrient cycling, carbon storage, water movement etc.) that occur at the pore scale and root scale. This is important because we have the potential, and most likely the future need, to manipulate the underlying soil processes at the microscale.
The role of root mucilage in the rhizosphere is manifold: it can aid in the contact between plant roots and rock mineral phases in the changing soil hydration situation; it can be important for nutrient solubilization reactions on the soil mineral surfaces; it can immobilize heavy metals; and it has been hypothesized to be an important habitat for other soil microorganisms (Bais et al., 2006; Watanabe et al., 2008; Carminati et al., 2010; Fox et al., 2012; Ahmed et al., 2016). Thus, it is important to learn how mucilage influences the root-soil interface physically. Root cap derived mucilage is usually in the form of a viscoelastic substance that is exuded by the roots, primarily by the root cap cells into the rhizosphere. Chemically, mucilage is a high molecular weight (HMW) carbohydrate, consisting predominantly of polysaccharides, organic acids, amino acids, fatty acids, and alcohols (Knee et al., 2001; Watanabe et al., 2008; Naveed et al., 2017). The sugar, amino acid, and glycosidic linkage composition of mucilage is complex and quite similar between different plant species. These glycosidic compositions, which are comparable to kinds found in arabinogalactan proteins (AGP), are known for high-water-binding and gel-forming properties (Fincher et al., 1983). Therefore, mucilage, when fully hydrated, can achieve a water retention of 27–589 times its weight (McCully and Boyer, 1997; Huang and Gutterman, 1999; Capitani et al., 2013). Hydration of mucilage is thought to happen quickly with rapid root surface hydration and diffusion of the exudate gel into the soil (McCully and Boyer, 1997; Salgado-Cruz et al., 2013). In addition, the carbohydrate nature makes it possible to form a dense three-dimensional micro to nano-sized fibril network. These characteristics make it especially useful for the adsorption of cations due to its high concentration of active binding sites (Watanabe et al., 2008; Goh et al., 2016). Therefore, the rhizosphere is potentially at least a four-phase domain, i.e., mineral, water with colloidal microparticles, air, and mucilage.
Plant roots exude ~20–25% of the total reduced carbon in the rhizosphere with roughly half of it in the form of mucilage, which therefore acts as a major carbon source for soil biota (Chaboud, 1983; Knee et al., 2001; Walker et al., 2003). The extent and rate of root mucilage degradation or mineralization by soil microbes is unclear, although the ability of biota to utilize root mucilage as a carbon source may be an important factor in successful root colonization in soils (Knee et al., 2001; Carminati and Vetterlein, 2013). Polysaccharides in mucilage are harder to hydrolyse by microbes in order to gain access to monomers that induce growth than soluble root exudates. Therefore, the make-up of the microbial community and the level of microbes in the direct vicinity of roots is thought to be directly influenced by root exudates, such as mucilage, and root border cells (Benizri et al., 2007). As a result, microbes that are capable to mineralize polysaccharides will therefore alter the structure and water holding properties of the rhizosphere, which can have detrimental effects on plant function (Mary et al., 1993; Knee et al., 2001; Naveed et al., 2017).
1H Magnetic Resonance Imaging (1H-MRI) relaxometry has a potential to be used to study the state of water in soil-root-mucilage interactions in-situ (Jaeger et al., 2006). The relaxation rate (both T1 and T2) of the 1H-NMR signal acquired in any sample (soil, root, or mucilage) varies as a result of the different molecular environments experienced by water molecules (Jaeger et al., 2006; Brax et al., in press). These differences can be measured and manifest as a shift of relaxation rates. Likewise, the changes in the mucilage structure, i.e., during degradation, can potentially cause shifts in these relaxation rates and can be useful in studying the progress of mucilage aging and decomposition in the rhizosphere in situ. In this paper, we set out to establish the groundwork for further experimental imaging techniques to enable imaging of mucilage in the soil. We will do this by utilizing correlative X-ray computed tomography and NMR imaging which, in combination, are suited for imaging soft biological materials in 4D, i.e., in 3D space and in time.
Materials and Methods
Sample Preparation
Three different samples were prepared, (i) pure chia seeds, (ii) chia seeds with Nafion artificial soil, and (iii) chia seeds with quartz sand (Figure 1). As to mimic mucilage release under “soil” conditions, Nafion and quartz were chosen as model soils for this exploratory study. Analytical grade sand (quartz, Sigma Aldrich, 212–300 μm) was used as received. Nafion was prepared by first washing Nafion beads (NR50 and R1100) in 2% HNO3 and MilliQ and then subsequently mixing NR50 and R1100 precursor beads in a 1:1 ratio. Finally, the mixture was cryo-milled using liquid nitrogen and subsequently sieved between 105 and 850 μm ending up with a mean particle size of 152 μm (determined from CT).
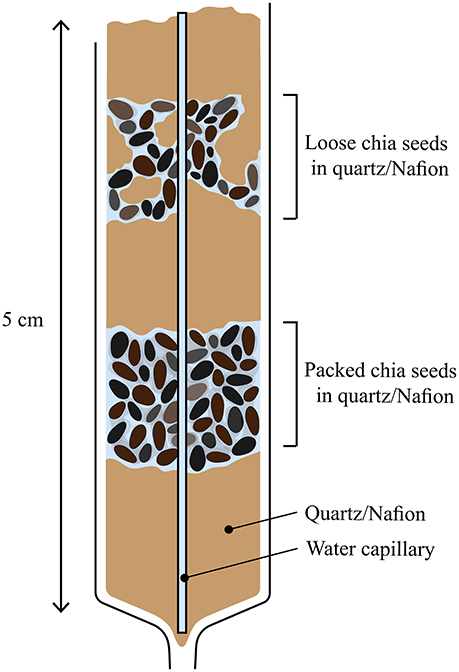
Figure 1. Sample design of chia in Nafion and quartz.
Chia mucilage (Salvia hispanica L.) was chosen as model mucilage in this study since it has been investigated as a model compound in various rhizosphere studies (Kroener et al., 2014; Benard et al., 2017). In addition, chia seeds are known for their relatively high yield of mucilage. Chia seed samples were prepared in three separate 2.5 mL syringes which contained a rectangular capillary. The long axis of the capillary was placed parallel to the long axis of the syringe (Figure 1) to be used as internal bulk water reference (MilliQ). For sample (i), the syringe contained only chia seeds and was prepared as a control. As to test the behavior of different mucilage concentrations in different environments, two distinct chia regions were created in the sand and Nafion treatment (Figure 1) which were prepared as follows, (i) loose chia which consisted of chia mixed in a 1:1 ratio with either Nafion or quartz, and (ii) packed chia which consisted of just chia seeds. The interlayers consisted of either Nafion or quartz as to separate out these layers. This resulted in a total of five chia regions across all samples (one pure chia, two chia and Nafion, and two chia and quartz). All samples were then wetted and saturated (matric potential 0 MPa) and left to equilibrate in a beaker with ultra-pure water (MilliQ, 18 Ω) for 6 h (±0.5 h) prior to the first NMR imaging session. The start of these imaging time series was chosen to be the first NMR imaging session, set at t = 0 h. Prior to the start of the NMR imaging series, both ends of the syringes were sealed with parafilm and agarose at the bottom and top, respectively as to prevent sample dehydration.
MRI
All MRI experiments were carried out on a 7 T Bruker Avance III spectrometer equipped with a micro-imaging probe carrying a 1H/13C 10 mm resonator with a triple-axis gradient set able to deliver a maximum gradient amplitude of 1.5 T/m. The syringes were placed in the instrument such that the long axis of the syringe was parallel to the static magnetic field, and the smallest axis of the water-containing rectangular capillary was aligned parallel to the coronal slice direction. A series of T2-weighted images for each of the five chia regions (pure chia, Nafion packed, Nafion loose, quartz packed, and quartz loose) at six different time points (0, 42, 97, 168, 284, and 325 h) were acquired using a CPMG pulse sequence. These consisted of 40 echoes for 8 adjacent coronal slices within each chia region, slice thickness 0.5 mm, with the parameters: TE = 12–480 ms; TR = 4,000 ms; matrix size (NP × NR) = 128 × 256; in-plane resolution of 120 × 120 μm; and N = 2 image averages. The total acquisition time for each scan was under 15 min. As a reference for pore water, we also measured T2 of packed Nafion and quartz saturated with ultra-pure water, respectively. Post-processing of the images was completed in Mathematica (Wolfram Inc., Illinois) using an analysis code written in-house. Briefly, three regions of interest (ROIs) were selected manually: 1. Regions of water-only within the capillaries were used as a reference; 2. Regions on either side of the capillary, containing chia seeds, surrounding gel and any soil substitutes; and 3. Regions of just chia seed. A three-parameter least-squares fit was performed on the intensity S from each voxel in an ROI to the function
where R2 is the transversal relaxation rate given by , S0 is the initial signal, t is time, and c is the final noise level. From this data R2 maps and histograms were constructed.
Finally, to measure the degradation rate of chia mucilage, the R2 of each time step was measured and averaged by carefully segmenting regions of mucilage. Although the voxel sizes are big (120 μm) and there might be an error associated with this, the regions were chosen in such a way that the bulk of the 1H signal is from water trapped in the mucilage. Hydrated mucilage contains 99.9% H2O compared to 5–10% H2O in the seed cellular structure (Muñoz et al., 2012). The R2 values are used to measure the changes of both physical and chemical properties of mucilage in time. As such, the resulting data was averaged over each sample per time point and fitted against a simple degradation rate model, described as
where K is the degradation constant of mucilage, C0 is the initial signal, and t is time expressed in hours.
X-ray CT
All X-ray computed tomography (XCT) measurements were carried out in the μ-VIS X-ray Imaging Centre at the University of Southampton using a X-Tek 160 kV Benchtop Micro-CT scanner (X-Tek Systems Ltd, Tring, Hertfordshire, UK) equipped with a 1 248 × 1 248 pixels flat panel detector. Each of the samples was scanned within 24 h after the first MRI measurement, and after the total series of MRI scans was finished spaced 325 h apart (t = 349 h). Each syringe was scanned separately at two different heights, which corresponded to the conditions “packed” and “loose” in the samples. Samples were scanned using a tube voltage of 120 kV and a current of 131 μA. A series of 2001 projections were recorded at an exposure time of 534 ms. Volume reconstructions were carried out using the CT Pro software package. The resulting volumes had an isotropic voxel side length of 20.8 μm. Images were processed and analyzed using the open source image analysis platform ImageJ (Schindelin et al., 2012) except for the correlation of CT and MRI scans, which was performed in VGStudio Max (Volume Graphics GmbH, Heidelberg, Germany). Images were cropped to a cylindrical region with a radius of 8 mm to remove the syringe wall. The glass capillary was segmented using a manual threshold followed by a dilation and a “Fill holes” operation in ImageJ. A seeded region growing was applied to remove any quartz/Nafion particles that were erroneously segmented during this step. Contrast of the remaining materials was enhanced manually based on the gray value histograms. In the pure chia seed sample a single threshold was computed with the default histogram based thresholding algorithm (also known as iterative intermeans) in ImageJ to segment air-filled voids. The remaining volume consisted of the chia seeds and hydrated mucilage. In the images containing porous media no robust automated thresholding method was found to classify the image into three different phases. Therefore, two thresholds were defined manually: A lower threshold separating air-filled voids from the seeds and hydrated mucilage and an upper threshold separating seeds and hydrated mucilage from solid quartz/Nafion particles, respectively. Volume fractions of the different materials were computed within ROI which were manually defined to match ROI on either side of the capillary used in the processing of the NMR scans. To this end, CT images and the corresponding NMR images taken at the nearest time point were co-registered using the “simple registration” tool in VG Studio Max. The volume fraction of any material was defined as the volume of said material divided by the total volume of the ROI. The pore size distribution of the liquid phase was estimated using the local thickness plugin in ImageJ. Local pore diameter was evaluated for the Chia loose regions in both Nafion and quartz at t = 325 h. A rough classification into soil pores and pores containing chia seeds was done by manually thresholding the local thickness map with threshold that segmented all the chia seeds (see Figure S2 in Supplementary Information).
Results
MRI
By using the 1H transverse relaxation rates (R2 = 1/T2) from MRI images, it was possible to distinguish between (i) the water phase by using an internal standard in the capillary, (ii) the mucilage gel phase, and (iii) the chia seeds. Due to the relatively small pore sizes between the seeds and relative large voxel sizes required by MRI experiments, the probability diagrams are presented as (i) seeds separate, and (ii) total signal from seeds and gel together (Figures 2–5, and also Figure S1 in Supporting Information).
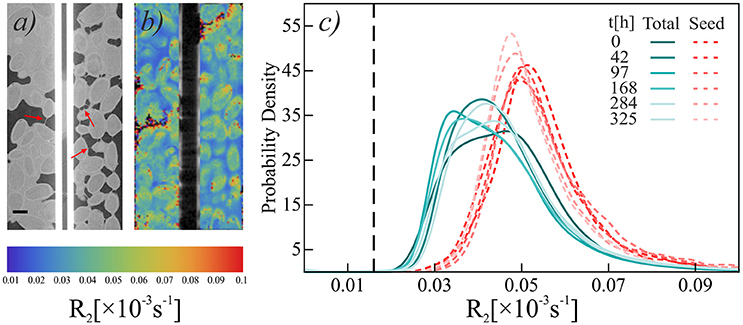
Figure 2. Aligned CT (a) and NMR (b) scans of pure chia seeds at t = 325 h. Scale bar at bottom left of the CT image is 1 mm. X-ray CT images show filaments spanning across air-filled voids (red arrows). Colors in the NMR image indicate relaxation rate R2. (c) Histograms of relaxation rate R2 of pure chia. Blue-green solid lines show R2 in “Total” region, red dashed lines show R2 in “Seed” region. Black dashed reference line shows mean R2 of water in the capillary. Note that the thickness of a single MRI slice is 500 μm compared to 20 μm of X-ray CT, which results in a perceived misalignment of geometrical features.
Across all five regions investigated (chia pure, Nafion/sand loose, and Nafion/sand packed) the relaxation rates measured differ from (a) the rate of bulk water in the glass capillary (R2 = 0.016 ± 0.009 ms−1), (b) the rate of water in the pore space of the Nafion-only sample (0.016 ± 0.002 ms−1), and (c) the rate of the water measured in the quartz-only sample (0.0595 ± 0.004 ms−1). Since mucilage excretion will change the relaxation rate, the results presented here in combination with the CT images, confirm the successful mucilage release from chia seeds in all five samples regions.
In the chia-only sample, the region containing both seeds and mucilage shows, in general, a slower relaxation rate compared to that measured in the seeds alone. This suggests that the water molecules present in the mucilage itself have a slower relaxation rate than those in the seeds. When compared to X-ray CT, these phases can generally be distinguished easier by NMR (Figures 2a,b). Moreover, the total NMR signal has a range of relaxation times, which is composed of more concentrated mucilage at the seed surface, dilute mucilage in the pores, and pore water. Although not significant, the overall R2 value seems to shift toward that of bulk water (vertical dashed line in Figure 2c) and back. The seeds, on the other hand, seem to hydrate from 284 h and follow an opposite trend. The fact that this is not represented in the total signal suggests that this is a small fraction of the total 1H signal.
The overall NMR relaxation rates of mucilage in the loose and packed Nafion regions differ substantially (Figure 3). The loose chia layer (Figures 3a,c) has an overall R2 similar to that of bulk capillary water. Figures 3b,d show that the packed layer has a higher R2, similar to the pure chia sample, which is consistent with the formation of a densely formed mucilage network and more tightly bound water molecules. In both layers the overall signal, is again predominantly affected by mucilage and pore water. In the loose layer, where the gel:water ratio is lower, the overall signal is similar to that of water and no significant changes occur over time. In contrast, the packed layer shows unequivocally a continuous shift toward lower R2 values with increasing time. Moreover, the degradation constant (Table 1, Figure 4) is bigger, which means that the R2 from mucilage changes significantly. In this region, the R2 values of mucilage decreases rapidly within the first 97 h.
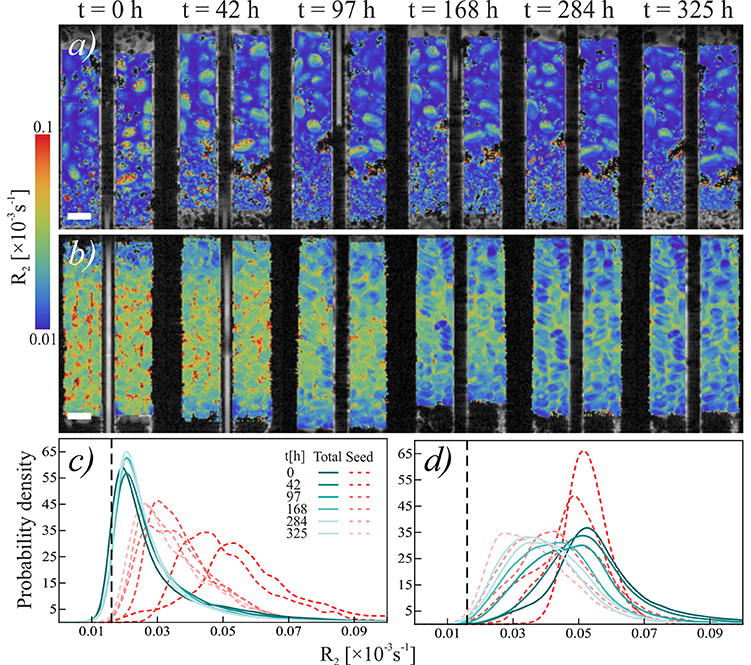
Figure 3. Temporal development relaxation rate R2 of chia seeds in Nafion. (a,b) Temporal sequence of NMR scans of (a) loose chia in Nafion and (b) packed chia in Nafion. Colors indicate relaxation rate R2. Scale bars are 2 mm. (c,d) Histograms of relaxation rate R2 of (c) loose chia in Nafion and (d) packed chia in Nafion. Blue-green solid lines show R2 in “Total” region, red dashed lines show R2in “Seed” region. Black dashed reference line shows mean R2 of water in the capillary, which is equal to the mean R2 of water in Nafion pores (R2 = 0.016).
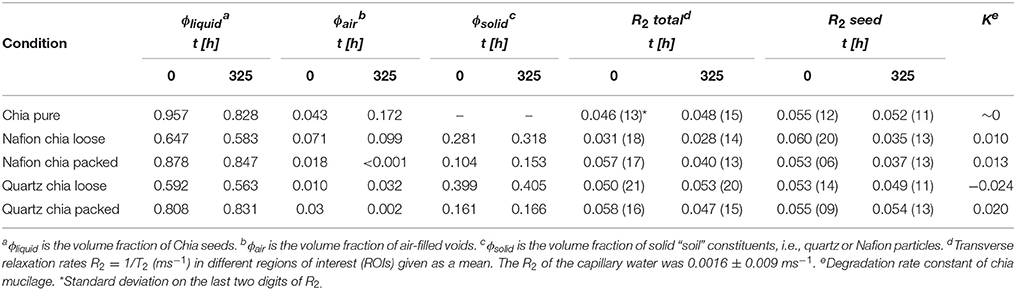
Table 1. Estimated volume fractions of the different materials within the XCT imaged regions of interest at time points t = 0 h and t = 325 h.
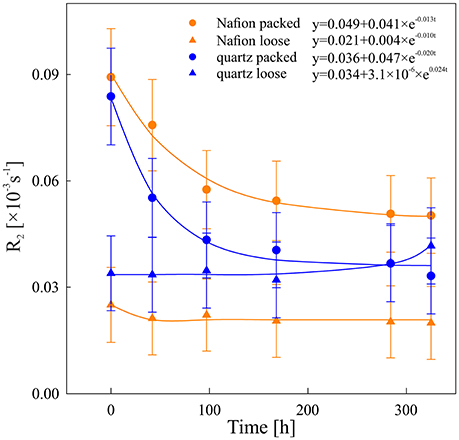
Figure 4. Degradation kinetics of chia mucilage in Nafion packed (orange circles), Nafion loose (orange triangles), quartz packed (blue circles), and quartz loose (blue triangles). Data was fitted against an exponential degradation rate y = a + C0 exp (−kt), see Equation (2).
Similar to the Nafion regions, the packed and loose chia layers in quartz differ significantly (Figures 4, 5) and degradation is slightly faster than in the Nafion treatment. Mucilage in the loose quartz region (Figures 5a,c) shows a broader range of R2 values compared to the other samples (Table 1). This is indicative of a wider range of gel concentrations throughout this region. At 97 h, the R2 in this region shifts toward higher values, away from bulk water reference (0.016 ± 0.009 ms−1; black dashed line Figure 5c), but toward the value for pore water measured in pores of quartz particles (0.0595 ± 0.004 ms−1; gray dashed line Figure 5c). In addition, the degradation curve of mucilage shows a slight R2 increase over time (Figures 4, 5c). In the packed region, the same evidence of mucilage degradation occurs. The packed region shows a continuous shift in the opposite direction toward that of bulk water. Similar to Nafion, also in this region a rapid decrease in the mucilage R2 occurs in the first 97 h. However, compared to the loose packed region, the gel:water ratio remains higher.
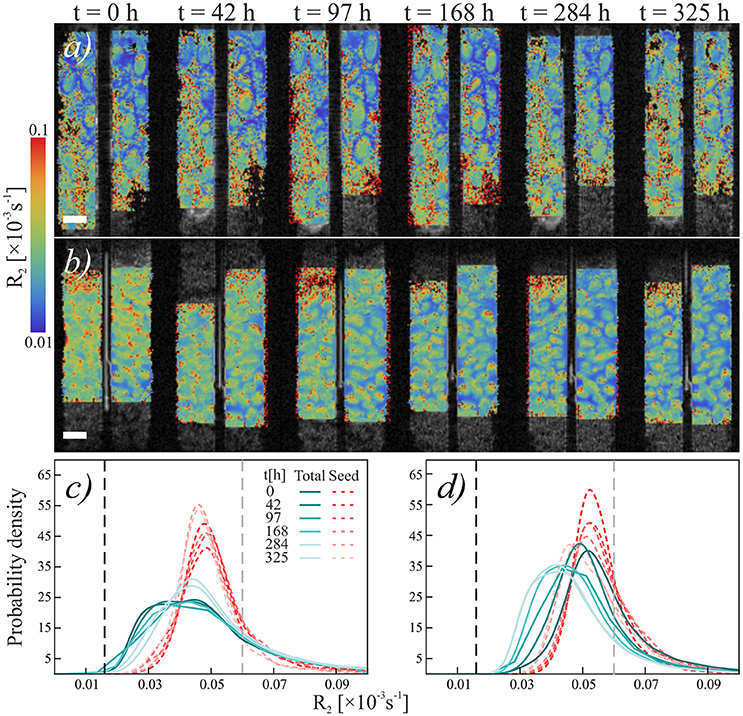
Figure 5. Temporal development relaxation rate R2 of chia seeds in quartz sand. (a,b) Temporal sequence of NMR scans of (a) loose chia in sand and (b) packed chia in sand. Colors indicate relaxation rate R2. Scale bars are 2 mm. (c,d) Histograms of relaxation rate R2 of (c) loose chia in sand and (d) packed chia in sand. Blue-green solid lines show R2 in “Gel” region, red dashed lines show R2 in “Seed” region. Black dashed reference line shows mean R2 of water in the capillary, gray dashed reference line shows mean R2 of water in quartz sand (R2 = 0.0595).
Seed hydration changes are minimal in chia and chia-quartz treatments and changes are only observed in the chia-Nafion treatment (Figures 3, 5). The hydration in these samples sets in immediately and seems to increase over time. In contrast, in the other samples changes are only observed from 284 h onwards.
X-ray CT Imaging
In the CT images, it was possible to distinguish between three different phases: (i) a solid phase made up by the porous material, i.e., either Nafion or sand, (ii) a liquid phase consisting of hydrated chia seeds, mucilage, and pore water, and (iii) an air phase containing air-filled voids. Change in the volume fraction (ϕi, where i denotes the material) of the materials between the start and the finish of the experiment is shown in Table 1. Most prominently, in the chia pure sample, ϕair increased by ~12%. Moreover, in both the Nafion and quartz samples, ϕair increased in the chia loose regions, while it decreased in the chia packed regions. Change of ϕair is in most cases accompanied by a change of ϕliquid with opposite sign, except for Nafion chia packed, where both ϕliquid and ϕair decreased over the course of the experiment. This was explained by an increase of ϕsolid. Change of ϕsolid, which was deemed constant, was < 5% in the Nafion sample and < 1% in the quartz sample and was likely caused by the shrinkage of mucilage.
A portion of the air-filled void volume at t = 325 h was occupied with a dense network of slightly sub-resolution filaments. Segmentation of these filaments was not possible at the given resolution and signal/noise ratio. However, projection of the maximum gray value over 200 μm (10 voxels) along the z-axis (longitudal) enabled the visualization of this network in a portion of the air-filled voids (Figure 6a). The network consisted of long filaments with diameters of ~20 μm, and irregularly shaped agglutinations of hydrated material at the junctions of multiple filaments (red arrows in Figure 6a). The diameter of these agglutinations varied between ~40 and 200 μm. After the experiment, images recorded with a light microscope, confirmed the formation of filaments and a branched network of filaments from the degraded gel (Figures 6b–d).
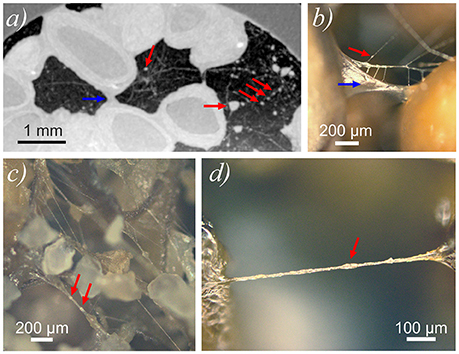
Figure 6. (a) Cutout of a horizontal slice of CT scan (chia pure) showing the filamentous network within air-filled voids including agglutinations (red arrows) of hydrated material. Larger hydraulic bridge indicated by blue arrow. Filamentous network was visualized by projecting the maximum gray value over 208 μm along the z-axis. Hydraulic bridge between chia seeds indicated by blue arrow. Pixel size in x- and y-direction is 20.8 μm. (b–d) Light microscope images of dehydrated chia mucilage in Nafion (b) and in sand (c,d).
The local thickness measure of the liquid fraction in Nafion loose and chia loose in sand at t = 325 h showed marked differences in pore size distribution (Figure S3 in Supplementary Information). Both histograms showed a clear separation of local thickness into a soil pore fraction and a fraction containing chia seeds. Total fraction of pores classified as soil pores was similar in Nafion (0.39) and in sand (0.38), while the sand contained a greater fraction (0.12) of meso- and micro-pores (Brewer, 1964) than the Nafion (0.07).
Discussion
The purpose of this paper was to image chia seed mucilage in soil in situ and demonstrate how it is changing with time; this provides a way forward for further studies using plant derived mucilage.
We were able to successfully image the gel-phase around the Chia seeds. The broad range of observed relaxation times of mucilage at the start of the experiment are consistent with mucilage data published by Muñoz et al. (2012). Their research showed that there is a concentration gradient of mucilage right at the interface of the chia seed. After 42 h, the degradation of mucilage gel manifests as a shift in 1H transverse relaxation rate from faster to slower values, with the exception of the loosely packed quartz sample. In the loosely packed quartz sample, partly due to the smaller pore sizes (see Figure S3), this R2 value is increasing to that of quartz pore water. Therefore, this implies a change in the mucilage molecular structure from a higher to a lower viscosity, which is consistent with degradation of mucilage to a more aqueous gel. Moreover, in both loosely packed regions there was less gel produced compared to the pure regions. Therefore, the starting R2 and changes in the relaxation time were much smaller in these regions. The results here are consistent to those of Brax et al. (in press), where it is shown that a decrease in mucilage concentration decreases the R2. X-ray CT results corroborate this finding, also showing that degradation of mucilage is accompanied by an increase in the air-filled void fraction, likely due to the breakdown by-product CO2. Changes in hydraulic and mechanical properties of chia mucilage from gel-like to water-like properties have previously been reported by Naveed et al. (2017). The key difference of chia mucilage, when compared to root mucilage, is the relatively high content of polysaccharides. This component of chia seed mucilage is responsible for the gel formation and higher viscosity (Read and Gregory, 1997; Goh et al., 2016). The decomposition of these sugar chains will cause a release of both trapped water in the dense fibril network and structurally absorbed water. In the present experimental setup this led to an increase of the matric potential and decrease of the viscosity of decomposed mucilage, and caused it to drain toward the lower compartment in the sample due to gravity. This is corroborated by the decrease in air-filled and increase in water-filled void fraction in the lower packed regions.
Structurally, at t = 325 h the remainder of the mucilage will consist of the more insoluble and slow-degrading long chain sugar fraction. These dehydrated long chain fibril structures form large bridging features between soil particles and seeds which are very similar to those described in Benard et al. (2017). These fibrils are found to be very stable and persist for over a month after the experiment. In the loosely packed regions in both Nafion and quartz, this degraded network of fibrils would have a lower capacity to retain water in the direct vicinity of the seeds, which is due to the relatively higher porosity in the gel-phase. These filaments do not represent the shape of the porous polymer network in a hydrated state, but may still play an important role in aggregate stability.
Although this is a first attempt in visualizing and quantifying the properties of mucilage in situ in 3D, more data under more realistic conditions is needed and this study should be viewed as a first step toward root exudate imaging. Many challenges, such as problems with salts and paramagnetic effects in soil, still remain. Although our study has shown the potential of NMR in visualizing organic material in a porous medium, more data under natural conditions is necessary. In this study, Nafion, which has been previously used in rhizosphere imaging studies (Downie et al., 2012), and quartz (to enhance contrast in CT scanning) were chosen to prevent the effects of high salts and paramagnetic effects, but data on real soil would be necessary to corroborate our observed results. Nevertheless, a correlative NMR imaging and CT study of bean roots within a mixed agricultural topsoil have been successfully applied and enabled the visualization of a dense root network (Zappala et al., 2013; Metzner et al., 2015). Depending on sample size, MRI in Metzner's study generally yielded a higher density of roots, compared to CT, where challenges remain with limited contrast between soil water and roots. Due to the big differences in the molecular environment of water between soil-water and root-moisture, the root architecture was made visible in NMR relaxometry. Furthermore, Schaumann et al. (2005) investigated the differences in wetting and swelling kinetics of an organic-rich soil sample. 1H-NMR relaxometry was successfully used in this contribution to distinguish between both swelling and wetting phenomena, which fundamentally investigated changes in pore size distribution in easily wettable pores and slowly wettable pores within soil organic matter (SOM). Additionally, Jaeger et al. (2006) investigated the effects of microbial activity on the relaxation time shifts within humous soil material. Even though in these studies no imaging was performed, it was found that hydration of organic matter and the formation of biofilms caused lower relaxation times and could be used to separate out different phases. However, it was stated that more investigation is needed on the exact effects of biofilms as well as paramagnetic substances, e.g., Fe and Mn, have on the relaxation times. Since mucilage is effectively a “humous” and porous medium, 1H-NMR imaging might be potentially an effective tool to image rhizosphere processes in situ and in vivo. The combination with X-ray CT additionally allows to disentangle the effect of changing chemical properties of mucilage and pore geometry on the resulting relaxation rates. Nevertheless, challenges such as natural abundant artifacts and the differences between different mucilage types and concentrations need to be overcome. However, the information of mucilage provided by this technique might be paramount in understanding key processes in the rhizosphere and direct vicinity, which is currently not clearly understood.
Author Contributions
AvV, MT, NK, GP, and TR all co-designed the study, analyzed the data, and co-wrote the manuscript.
Funding
AvV was funded by ERC Consolidator grant DIMR 646809DIMR. NK is funded by BBSRC SARISA BB/L025620/1. TR is funded by BBSRC SARISA BB/L025620/1, EPSRC EP/M020355/1, ERC 646809DIMR, BBSRC SARIC BB/P004180/1, and NERC NE/L00237/1. MT and GP were funded by EPSRC EP/N033558/1.
Conflict of Interest Statement
The authors declare that the research was conducted in the absence of any commercial or financial relationships that could be construed as a potential conflict of interest.
Acknowledgments
AvV, NK, and TR would like to acknowledge the members of the Rooty Group at the Faculty of Engineering and Environment, University of Southampton for useful discussions and support.
Supplementary Material
The Supplementary Material for this article can be found online at: https://www.frontiersin.org/articles/10.3389/fenvs.2018.00032/full#supplementary-material
Figure S1. Three-dimensional segmentation of chia mucilage degradation in quartz loose region at t = 0 h and t = 168 h.
Figure S2. Three major image processing steps on CT images. (a) Vertical raw CT slice after removal of capillary (black vertical stripe), (b) classification result of solid particles (red) and liquid phase (blue) and airfilled voids (black), and (c) pore-size distribution of the liquid phase, warmer colors indicate bigger pore-sizes and cluster bigger than 0.3 are colored white.
Figure S3. Histograms of local radius of the liquid phase in Nafion loose and sand loose at t = 325 h. Histogram bins are 20 μm, smallest detectable pore size is 40 μm. The red shaded area indicates the range of soil pores, the blue shaded area indicates the range covered by chia seeds.
References
Ahmed, M. A., Kroener, E., Benard, P., Zarebanadkouki, M., Kaestner, A., and Carminati, A. (2016). Drying of mucilage causes water repellency in the rhizosphere of maize: measurements and modelling. Plant Soil 407, 161–171. doi: 10.1007/s11104-015-2749-1
Bais, H. P., Weir, T. L., Perry, L. G., Gilroy, S., and Vivanco, J. M. (2006). The role of root exudates in rhizosphere interactions with plants and other organisms. Annu. Rev. Plant Biol. 57, 233–266. doi: 10.1146/annurev.arplant.57.032905.105159
Benard, P., Zarebanadkouki, M., Hedwig, C., Holz, M., Ahmed, M. A., and Carminati, A. (2017). Pore-scale distribution of mucilage affecting water repellency in the rhizosphere. Vadose Zone J. 17:170013. doi: 10.2136/vzj2017.01.0013
Benizri, E., Nguyen, C., Piutti, S., Slezack-Deschaumes, S., and Philippot, L. (2007). Additions of maize root mucilage to soil changed the structure of the bacterial community. Soil Biol. Biochem. 39, 1230–1233. doi: 10.1016/j.soilbio.2006.12.026
Brax, M., Buchmann, C., and Schaumann, G. E. (in press). Effect of mucilage on water properties in the rhizosphere monitored by 1H-NMR relaxometry. Microporous Mesoporous Mater. doi: 10.1016/j.micromeso.2017.07.044
Capitani, M. I., Ixtaina, V. Y., Nolasco, S. M., and Tomás, M. C. (2013). Microstructure, chemical composition and mucilage exudation of chia (Salvia hispanica L.) nutlets from Argentina. J. Sci. Food Agric. 93, 3856–3862. doi: 10.1002/jsfa.6327
Carminati, A., Moradi, A. B., Vetterlein, D., Vontobel, P., Lehmann, E., Weller, U., et al. (2010). Dynamics of soil water content in the rhizosphere. Plant Soil 332, 163–176. doi: 10.1007/s11104-010-0283-8
Carminati, A., and Vetterlein, D. (2013). Plasticity of rhizosphere hydraulic properties as a key for efficient utilization of scarce resources. Ann. Bot. 112, 277–290. doi: 10.1093/aob/mcs262
Chaboud, A. (1983). Isolation, purification and chemical composition of maize root cap slime. Plant Soil 73, 395–402. doi: 10.1007/BF02184316
Downie, H., Holden, N., Otten, W., Spiers, A. J., Valentine, T. A., and Dupuy, L. X. (2012). Transparent soil for imaging the rhizosphere. PLoS ONE 7:e44276. doi: 10.1371/journal.pone.0044276
Fincher, G. B., Stone, B. A., and Clarke, A. E. (1983). Arabinogalactan-proteins: structure, biosynthesis, and function. Annu. Rev. Plant Physiol. 34, 47–70. doi: 10.1146/annurev.pp.34.060183.000403
Fox, D. I., Pichler, T., Yeh, D. H., and Alcantar, N. A. (2012). Removing heavy metals in water: the interaction of cactus mucilage and arsenate (As (V)). Environ. Sci. Technol. 46, 4553–4559. doi: 10.1021/es2021999
Goh, K. K., Matia-Merino, L., Chiang, J. H., Quek, R., Soh, S. J., and Lentle, R. G. (2016). The physico-chemical properties of chia seed polysaccharide and its microgel dispersion rheology. Carbohydr. Polym. 149, 297–307. doi: 10.1016/j.carbpol.2016.04.126
Huang, Z., and Gutterman, Y. (1999). Germination of Artemisia sphaerocephala (Asteraceae), occurring in the sandy desert areas of Northwest China. South Afr. J. Bot. 65, 187–196. doi: 10.1016/S0254-6299(15)30972-8
Jaeger, F., Grohmann, E., and Schaumann, G. E. (2006). 1H NMR relaxometry in natural humous soil samples: insights in microbial effects on relaxation time distributions. Plant Soil 280, 209–222. doi: 10.1007/s11104-005-3035-4
Knee, E. M., Gong, F. C., Gao, M., Teplitski, M., Jones, A. R., Foxworthy, A., et al. (2001). Root mucilage from pea and its utilization by rhizosphere bacteria as a sole carbon source. Mol. Plant-Microbe Interact. 14, 775–784. doi: 10.1094/MPMI.2001.14.6.775
Kroener, E., Zarebanadkouki, M., Kaestner, A., and Carminati, A. (2014). Nonequilibrium water dynamics in the rhizosphere: how mucilage affects water flow in soils. Water Resour. Res. 50, 6479–6495. doi: 10.1002/2013WR014756.
Mary, B., Fresneau, C., Morel, J. L., and Mariotti, A. (1993). C and N cycling during decomposition of root mucilage, roots and glucose in soil. Soil Biol. Biochem. 25, 1005–1014. doi: 10.1016/0038-0717(93)90147-4
McCully, M. E., and Boyer, J. S. (1997). The expansion of maize root-cap mucilage during hydration. 3. changes in water potential and water content. Physiol. Plant. 99, 169–177. doi: 10.1111/j.1399-3054.1997.tb03445.x
Metzner, R., Eggert, A., van Dusschoten, D., Pflugfelder, D., Gerth, S., Schurr, U., et al. (2015). Direct comparison of MRI and X-ray CT technologies for 3D imaging of root systems in soil: potential and challenges for root trait quantification. Plant Methods 11:17. doi: 10.1186/s13007-015-0060-z
Muñoz, L. A., Cobos, A., Diaz, O., and Aguilera, J. M. (2012). Chia seeds: microstructure, mucilage extraction and hydration. J. Food Eng. 108, 216–224. doi: 10.1016/j.jfoodeng.2011.06.037
Naveed, M., Brown, L. K., Raffan, A. C., George, T. S., Bengough, A. G., Roose, T., et al. (2017). Plant exudates may stabilize or weaken soil depending on species, origin and time. Eur. J. Soil Sci. 68, 806–816. doi: 10.1111/ejss.12487
Read, D. B., and Gregory, P. J. (1997). Surface tension and viscosity of axenic maize and lupin root mucilages. New Phytol. 137, 623–628. doi: 10.1046/j.1469-8137.1997.00859.x
Salgado-Cruz, M. d. l. P., Calderón-Domínguez, G., Chanona-Pérez, J., Farrera-Rebollo, R. R., Méndez-Méndez, J. V., and Díaz-Ramírez, M. (2013). Chia (Salvia hispanica L.) seed mucilage release characterisation. a microstructural and image analysis study. Indust. Crops Prod. 51, 453–462. doi: 10.1016/j.indcrop.2013.09.036
Schaumann, G. E., Hobley, E., Hurrab, J., and Rotard, W. (2005). H-NMR relaxometry to monitor wetting and swelling kinetics in high-organic matter soils. Plant Soil 275, 1–20. doi: 10.1007/s11104-005-1708-7
Schindelin, J., Arganda-Carreras, I., Frise, E., Kaynig, V., Longair, M., Pietzsch, T., et al. (2012). Fiji: an open-source platform for biological-image analysis. Nat. Methods 9, 676–682. doi: 10.1038/nmeth.2019
Walker, T. S., Bais, H. P., Grotewold, E., and Vivanco, J. M. (2003). Root exudation and rhizosphere biology. Plant Physiol. 132, 44–51. doi: 10.1104/pp.102.019661
Watanabe, T., Misawa, S., Hiradate, S., and Osaki, M. (2008). Characterization of root mucilage from Melastoma malabathricum, with emphasis on its roles in aluminum accumulation. New Phytol. 178, 581–589. doi: 10.1111/j.1469-8137.2008.02397.x
Keywords: chia, mucilage, 1H-MRI, X-ray CT, root-exudate, polysaccharides, rhizosphere
Citation: van Veelen A, Tourell MC, Koebernick N, Pileio G and Roose T (2018) Correlative Visualization of Root Mucilage Degradation Using X-ray CT and MRI. Front. Environ. Sci. 6:32. doi: 10.3389/fenvs.2018.00032
Received: 01 March 2018; Accepted: 07 May 2018;
Published: 25 May 2018.
Edited by:
Philippe C. Baveye, AgroParisTech Institut des Sciences et Industries du Vivant et de L'environnement, FranceReviewed by:
Pascal Benard, University of Bayreuth, GermanyEva Kroener, Universität Koblenz Landau, Germany
Eleonore Beckers, University of Liege—Gembloux AgroBio Tech—BioSE, Belgium
Copyright © 2018 van Veelen, Tourell, Koebernick, Pileio and Roose. This is an open-access article distributed under the terms of the Creative Commons Attribution License (CC BY). The use, distribution or reproduction in other forums is permitted, provided the original author(s) and the copyright owner are credited and that the original publication in this journal is cited, in accordance with accepted academic practice. No use, distribution or reproduction is permitted which does not comply with these terms.
*Correspondence: Tiina Roose, t.roose@soton.ac.uk