Comprehensive assessment of climate extremes in high-resolution CMIP6 projections for Ethiopia
 Fasil M. Rettie
 Sebastian Gayler1
  Tobias K. D. Weber
- 1Institute of Soil Science and Land Evaluation, Biogeophysics, University of Hohenheim, Stuttgart, Germany
- 2Ethiopian Institute of Agricultural Research (EIAR), Melkasa, Ethiopia
- 3Soil Science Section, Faculty of Organic Agricultural Sciences, University of Kassel, Witzenhausen, Germany
- 4International Maize and Wheat Improvement Center (CIMMYT), Addis Ababa, Ethiopia
Climate extremes have more far-reaching and devastating effects than the mean climate shift, particularly on the most vulnerable societies. Ethiopia, with its low economic adaptive capacity, has been experiencing recurrent climate extremes for an extended period, leading to devastating impacts and acute food shortages affecting millions of people. In face of ongoing climate change, the frequency and intensity of climate extreme events are expected to increase further in the foreseeable future. This study provides an overview of projected changes in climate extremes indices based on downscaled high-resolution (i.e., 10 × 10 km
1 Introduction
There is unequivocal and overwhelming evidence for the ongoing climate change. The projected 1.5°C increase in global average temperature by 2050s poses risks to humans and ecosystems (IPCC, 2022). The changing climate has manifested itself in higher climate extremes events (Myhre et al., 2019; Madakumbura et al., 2021). Climate extremes usually have more devastating effects than the mean shift in the climate. Expected increases in flash flood events following more frequent and extreme precipitation events, or droughts as a result of prolonged periods of extremely low precipitation are situations that may cost countries a huge price (IPCC, 2022). Extreme heat or cold waves have far-reaching socioeconomic and mental effects on the most vulnerable societies (IPCC, 2022). Since 2005, the world has witnessed 9 warmest years, and 2019 has been recorded as one of the three warmest years since the records have begun. This global phenomenon has significant implications, particularly for the most vulnerable part of the world’s economy. Kemp et al. (2022) suspect that, together with other global threats, the changing climate may become catastrophic even at modest levels of warming.
Ethiopia’s economy depends largely on agriculture and it is considered to be among the countries that are most vulnerable to climate extremes. The agricultural sector second contributes ∼ 38% to the GDP (Gross Domestic Product) of the country but employs 67% of the population and contributes about 86% of export earnings (Eshetu and Mehare, 2020; World Bank, 2022b; World Bank, 2022c). Moreover, the largely subsistence agriculture relies on seasonal rains. The proportion of irrigated land was only 2.1% in 2018 (World Bank, 2022a) and agricultural mechanization was below 1% (Berhane et al., 2017). Ethiopia has faced recurrent climate extreme effects for a long period usually resulting in a devastating impact and leaving millions in acute food shortage (Kiros, 1991; Mohammed et al., 2018). The 2022 drought was one of the worst in 50 years, leaving 2.2 million livestock dead (FEWS NET, 2022). Considering the projected population of > 200 million by 2050 (World Bank, 2022d), the challenge of comparable drought periods for the already vulnerable economy would be enormous. Against this background, detailed quantification of climate extremes is particularly relevant for Ethiopia.
For the past climate, studies have documented consistent increasing temperature trends both in mean and extremes in East Africa in general (Gebrechorkos et al., 2019b; Muthoni et al., 2019; Afuecheta and Omar, 2021) and Ethiopia in particular (Gummadi et al., 2018; Gebrechorkos et al., 2019b; 2019a). However, precipitation has been reported as inconsistent across the region (Viste et al., 2013; Tierney et al., 2015; Cattani et al., 2018; Gummadi et al., 2018). For instance, Tierney et al. (2015) documented unusual drying of March-May rainfall in East Africa during the past century. Meanwhile, their assessment based on 23 CMIP5 models by the end of the 21st century show largely increasing seasonal as well as annual precipitation totals under high emission (RCP 8.5) scenario (Tierney et al., 2015). Drying spring and summer seasons have also been reported for southern Ethiopia. The drying springs have affected most parts of the country (Viste et al., 2013). However, local scale studies identified higher spatial variability both in the observed and projected climate trends, particularly for precipitation (Brown et al., 2017; Muthoni et al., 2019; Alaminie et al., 2021; Bayable et al., 2021). High spatial variability was also visible in past climate extremes (Cattani et al., 2018; Esayas et al., 2018; Ademe et al., 2020; Gemeda et al., 2021; Ali Mohammed et al., 2022; Birhan et al., 2022; Dendir and Birhanu, 2022). Understanding the time evolution of extreme climate events is of large interest for designing potential adaptation options and informed decision-making (Kemp et al., 2022). Ethiopia is characterized by diverse climate regimes modulated by its complex topography exerting strong elevation gradients (Diro et al., 2011; Van den Hende et al., 2021), which require finer spatial resolution to produce relevant results (El Kenawy et al., 2016).
The basic sources of projected climate data are the Global Climate Models (GCMs) running on coarse spatial resolution at > 70 × 70 km
The present study provides an overview of observed and projected changes in climate extremes indices derived from the downscaled high-resolution daily climate data by Rettie et al. (2023). For this, we compared the historical simulation of the CMIP6 models and analyzed the temporal and spatial distributions of projected changes. The skill of the individual models in reproducing the observed trends of climate extremes in the base period (i.e., 1983–2012) was evaluated, and the uncertainties associated with the projected (i.e., 2020–2100) trends were quantified.
2 Materials and methods
2.1 Climate data
The climate hazards group database provides free daily climate data with a 5 × 5 km
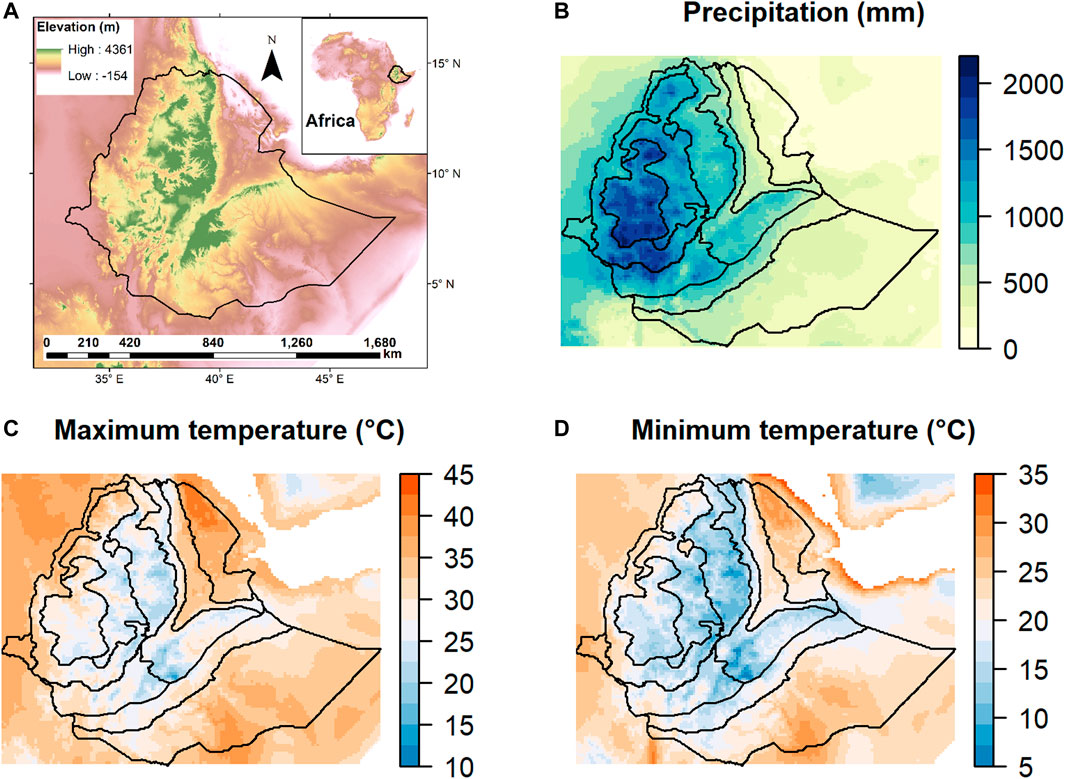
FIGURE 1. Maps of Ethiopia showing elevation (A), annual total precipitation in mm (B), and annual maximum (C) and minimum (D) temperatures based on observation data (1982–2012).
This work was conducted based on previously downscaled climate projections covering the period of 2020–2100 from a list of CMIP6 GCMs under three emission scenarios known as shared socioeconomic pathways (SSPs) (Rettie et al., 2023). The data was produced by applying a geospatial statistical downscaling technique to downscale the original coarse spatial resolution (i.e., > 70 × 70 km2) GCM outputs to 10 × 10 km2 spatial resolution covering entire Ethiopia (3oN—15oN and 32oE—48oE). The data includes projections of temperature and precipitation from 13 to 9 CMIP6 GCMs, respectively (Table 1). For a detailed description of the downscaling procedure and evaluation see there. In this study, we considered the downscaled climate projections datasets under three SSPs. The selected SSPs are SSP2-4.5, SSP3-7.0, and SSP5-8.5, which represent medium, medium-high, and high-forcing scenarios based on middle-of-the-road, regional rivalry, and fossil-fueled socioeconomic development scenarios, respectively (O’Neill et al., 2017; Meinshausen et al., 2020). The emission scenarios span a broad range of CO
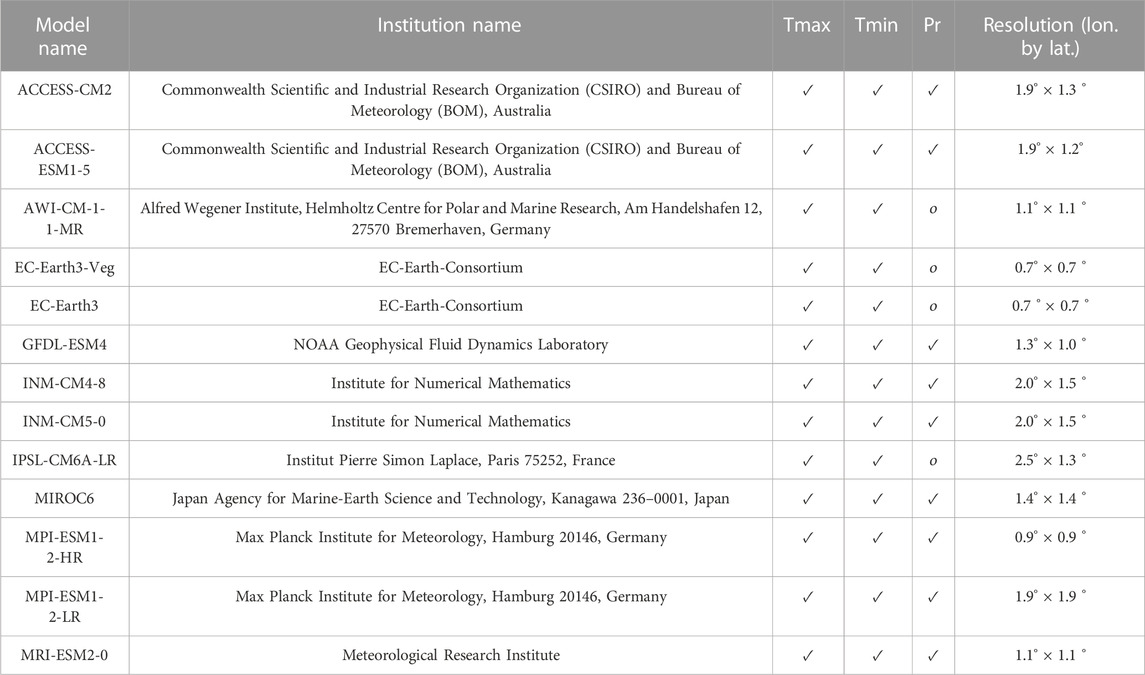
TABLE 1. List of GCMs and availability of data with respect to maximum (Tmax) and minimum (Tmin) temperatures and precipitation (Pr).
2.2 Climate extreme indices
Table 2 lists the 23 climate extreme indices investigated in this study. The indices were among the 27 climate change indicators which were developed by the Expert Team on Climate Change Detection, Monitoring Indices (ETCCDMI) and have been recommended by the World Meteorological Organization (WMO) (Zhang et al., 2011). The R package climdex.pcic (Pacific Climate Impacts Consortium (2020), http://cran.r-project.org/web/packages/climdex.pcic/index.html) was used to derive the climate indices at 10 × 10 km
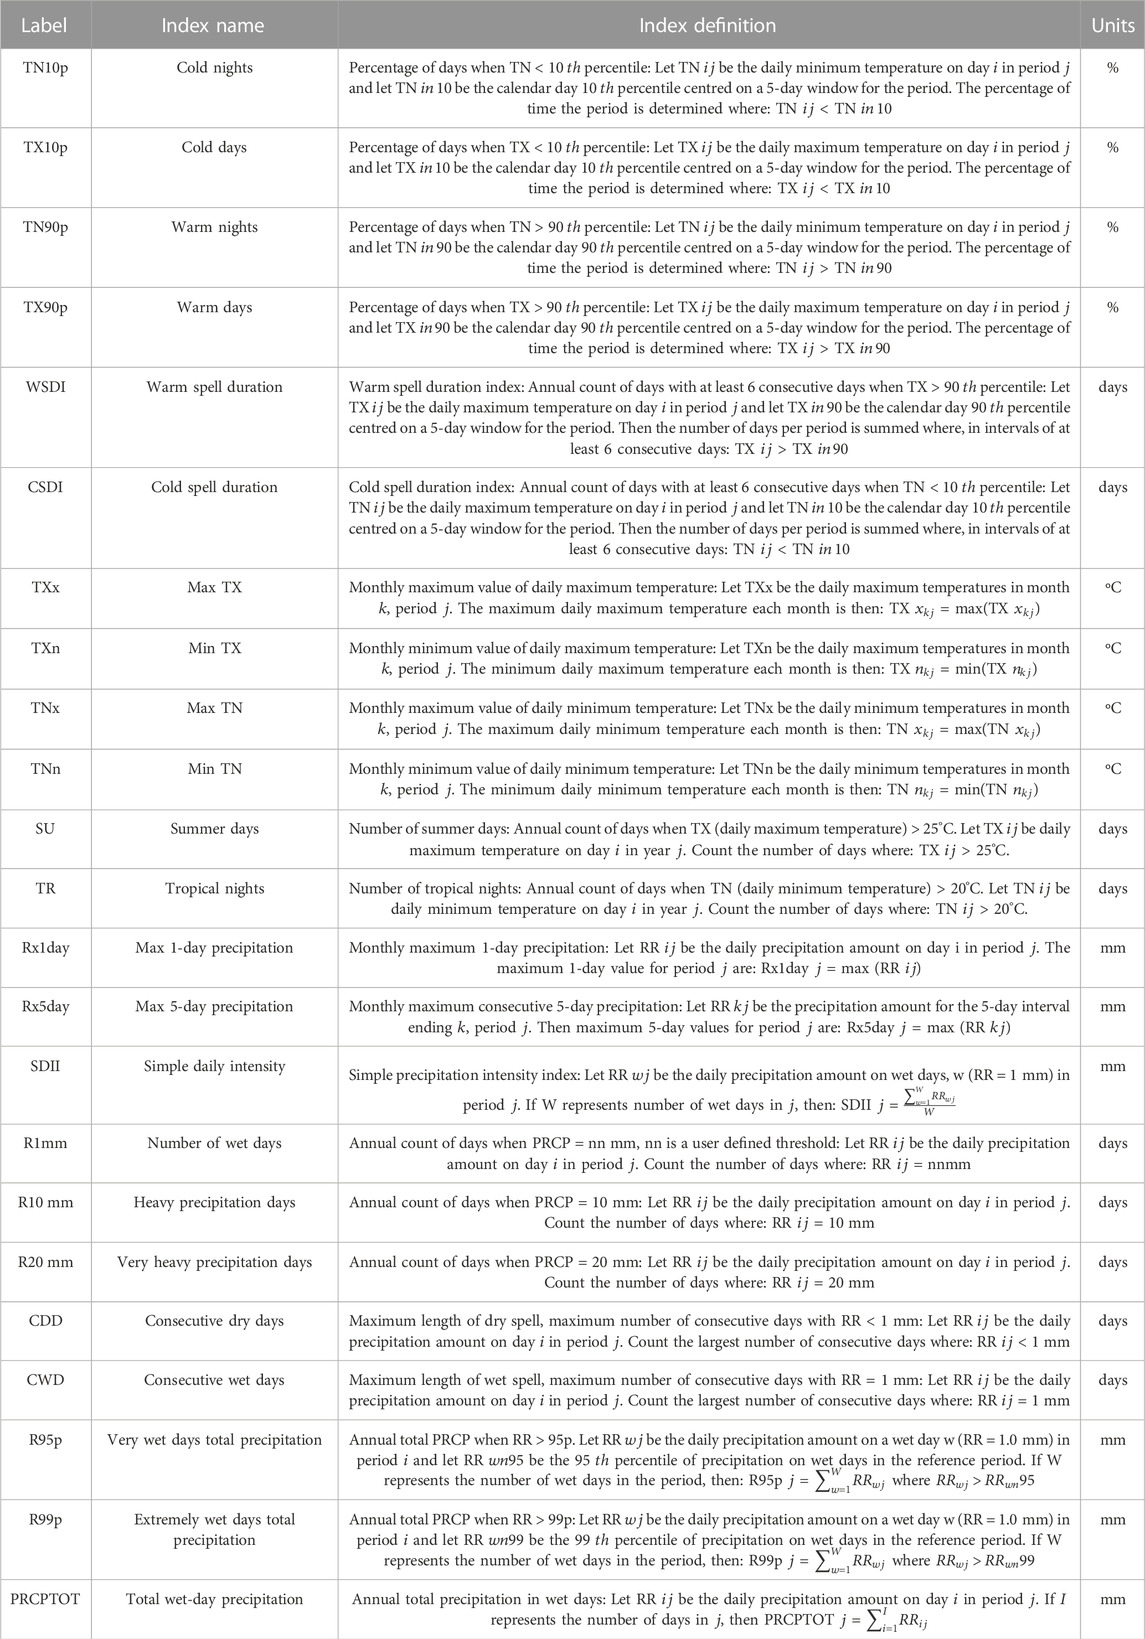
TABLE 2. List of ETCCDMI-defined precipitation and temperature extreme indices computed and evaluated in this study.
2.3 Evaluation of models’ skill
The performance of the GCMs in reproducing the observed climate extremes was evaluated based on the Taylor diagram (Taylor, 2001). Taylor diagram is a widely used tool to evaluate how well a model matches observed climate states (Guo et al., 2018; Rao et al., 2019; Li et al., 2021; Yang et al., 2021; Liu et al., 2022). A Taylor diagram simultaneously visualizes three summary statistics: the standard deviation (
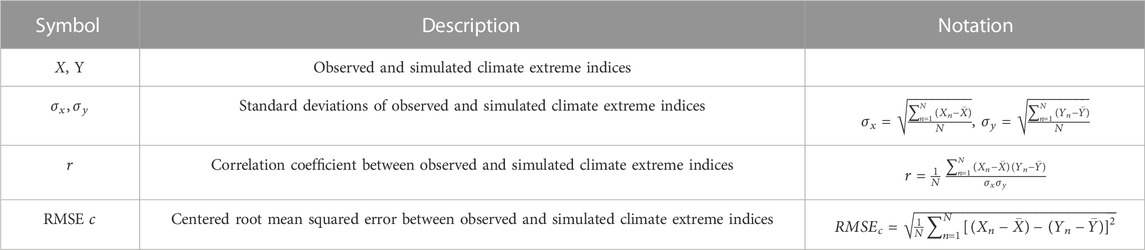
TABLE 3. Performance statistics on which the Taylor diagrams are based.
2.4 Trend estimation and test
We used the Mann-Kendall (MK) method (Mann, 1945; Kendall, 1962; Pohlert, 2020) to test the trends in the respective climate extreme indices for both the baseline climate and future projections. The MK is a non-parametric test (i.e., the data does not have to meet the normality assumption) and widely used method because of its simplicity (Cattani et al., 2018; Esayas et al., 2018; Afuecheta and Omar, 2021; Li et al., 2021; Simanjuntak et al., 2022). The MK test determines the presence of monotonic (i.e., consistent) increasing or decreasing tendency of data in a given time. The magnitude of the trend is determined by using Sen’s slope estimator (Sen, 1968) which is a non-parametric approach to estimate the overall slope in a data series (Beyene et al., 2022; Malaekeh et al., 2022; Pervin and Khan, 2022). All the MK tests and slope estimates were computed using the “trend” R software package (Pohlert, 2020).
2.5 Partitioning sources of uncertainty in the projected climate extremes
Climate change projections usually involve three main sources of uncertainty, namely: uncertainty due to GCMs (M
The decomposition of the uncertainty was computed on the changes (denoted as
and the changes in precipitation-related extreme indices are defined as percentage ratio:
where s = 1, … ,
Subsequently, the resulting changes (
The respective means of
The component of the uncertainty due to the GCMs was then estimated as the variance of the multi-scenario averages:
Likewise, the component of the uncertainty due to the SSPs was then estimated as the variance of the multi-model averages:
On the other hand, the uncertainty due to the internal climate variability corresponds to the variance of the residuals from the fits over all GCMs, SSPs, and projection period (i.e., 2020–2095,
In our present study, we assumed no interaction effects between GCMs and SSPs, and equal weights were given for all GCMs despite the different performances (Zhang and Chen, 2021). The total uncertainty (
The signal-to-noise (S/N) ratio was calculated to understand the influence of uncertainties on projected climate extreme indices over time (Hawkins and Sutton, 2009).
A larger S/N ratio implies that the projected uncertainties are smaller relative to the average climate change signal (Hawkins and Sutton, 2011; Zhang et al., 2011). The uncertainty of projected climate extreme indices was analyzed for the nine sub-regions (denoted as R1-R9) of Ethiopia that were identified based on homogeneous rainfall zones by Rettie et al. (2023).
3 Results and discussion
3.1 Temperature indices
Measuring the performance of the climate models in capturing the observed climate extreme indices is an important part of climate studies. Figure 2 shows the Taylor diagrams comparing the performance of the GCMs and their ensemble average in reproducing the different temperature extreme indices in the observation data (i.e., CHIRPS and CHIRTS) during 1983–2012. For most of the temperature-related extreme indices, the correlation coefficients range from 0.2 to 0.60. A larger range of correlation coefficients is found for extremes such as TN10p, TX90p, TN10p, TN90p, SU, and TR (refer Table 2). For absolute temperature indices like TNn, TXn, WSDI, and CSDI, the correlation coefficients (r) are very low. However, the interannual variation expressed by the standard deviations (SD) of the observation was well reproduced by most of the GCMs. Most of the indices simulated were well below 1.5 SD relative to the SD of the observations. For TX10p, WSDI and CSDI indices, many of the GCMs produced lower variability compared to the observations. The diagrams also show that the centered RMSE is well below 1.5 units relative to the SD of observations. The smallest error was found for TX90p and TX10p. The centered RMSE quantified the differences in two fields, in our case the indices in the observation data and the indices simulated by the GCMs. The diagram further shows that the GCMs ensemble average reduced both the errors (centered RMSE) and the interannual variability (SD) while the correlation coefficients (r) were increased for majority of the temperature-related indices indicating that the GCMs ensemble average performance was better than individual GCMs. The individual model as well as their ensemble average performance also varied at the regional level (Supplementary Figures S1, S2). In their multi-model study in China, Wei et al. (2022) also reported that GCMs ensemble averages of climate extreme outperform those by individual models. The models’ skill was much better for the drier and hotter sub-regions (i.e., R1, R2, and R4) compared to the cooler highland regions. More importantly, the improvement from the GCMs ensemble average was more pronounced at the regional scale (Supplementary Figure S2).
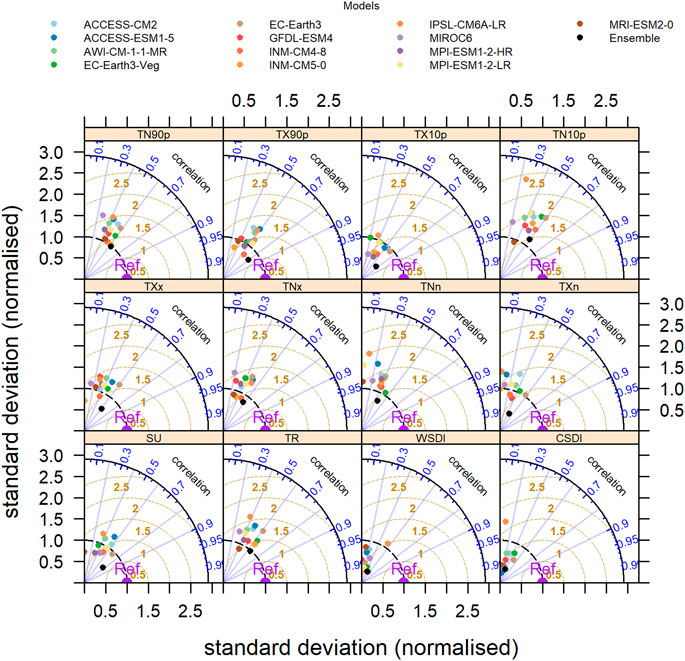
FIGURE 2. Taylor diagrams comparing the skill of the Global Climate Models (GCMs) in reproducing the observed (1983–2012) temperature related indices. The azimuthal axis shows the correlation coefficients. The radial distance from the origin represents the variability (SD), while the distance from the “Ref” point is the centered RMSE (brown dashed lines) difference between the GCMs and observed temperature related indices.
Figures 3–5 show the spatial distribution of annual trends in temperature-related extreme indices in the projected climate (2020–2100) under the three SSPs in comparison to the corresponding trends in the observed climate (1982–2012). The figures clearly show significant trends in both observations and projections for all indices except for projected cold spell duration indices (CSDI). Looking at the percentile indices, higher warm extreme indices (TX90p and TN90p) are expected in future climate ranging from 4% (SSP2-4.5) to 10% (SSP5-8.5) per decade compared to approximately 3% per decade increase in the observation period. Based on the CHIRPS data (i.e., the same observed data as in our study), Gebrechorkos et al. (2019b) reported similar patterns of extreme temperature trends for the pasty climate (1979–2010). Changes of higher magnitude of temperature extremes were reported at local level studies (Birhan et al., 2022). The increasing trend in warm extreme indices is confirmed by increasing trends in other warming indicators such as summary days (SU), tropical nights (TR), and warm spell duration (WSDI). The number of summer days (SU) and tropical nights (TR) are expected to increase by up to 35 days and 50 days, respectively, particularly in the highland regions under the SSP5-8.5 scenario. Similar increasing trends are expected for the warm spell duration index (WSDI), which could increase by up to 45 days per decade under the SSP5-8.5 scenario. The results also indicate that the magnitude the warm percentile indices expected to increase would be higher than the magnitude the cold percentile indices are expected to decrease. The relatively stronger downward trend of cold extreme indices (i.e., TX10p and TN10p) over the observation period (∼4% per decade) is expected to decrease in future climate by ∼1% per decade under the SSP5-8.5 scenario. On the other hand, the absolute extreme maximum and minimum temperature indices (TXx, TXn, TNn, and TNx) show spatially heterogeneous patterns, not solely, but particularly in the observations. However, largely significant increasing trends of the absolute extreme maximum and minimum temperature indices are expected in the future climate, especially under the higher emission scenarios (SSP3-7.0 and SSP5-8.5). For instance, under the SSP5-8.5 emission scenario, the predicted absolute maximum of maximum temperature (TXx) and minimum of minimum temperature (TNn) trends could reach up to 6
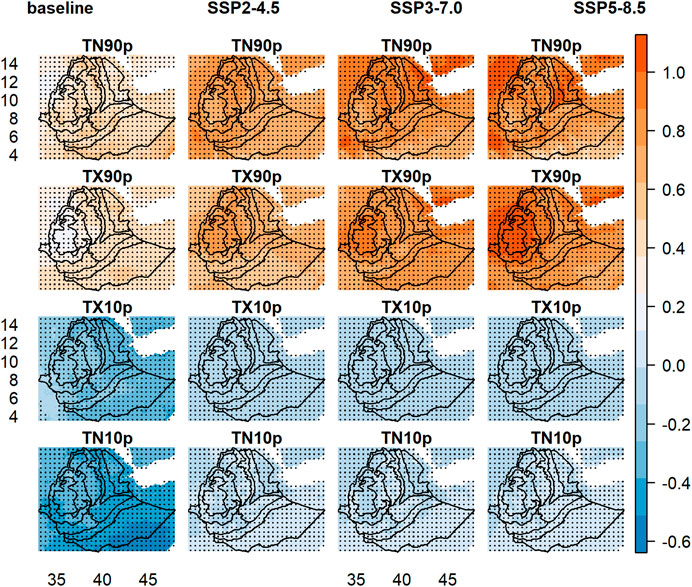
FIGURE 3. Spatial distribution of annual historical (1983–2012) and projected (2020–2100) trends (Sen’s slope) in multi-GCMs averaged temperature indices (TN90p, TX90p, TX10p, and TN10p in % units) under the three SSPs. The areas under patches (depicted as signs) show significant (p < 0.05, MK test) trends.
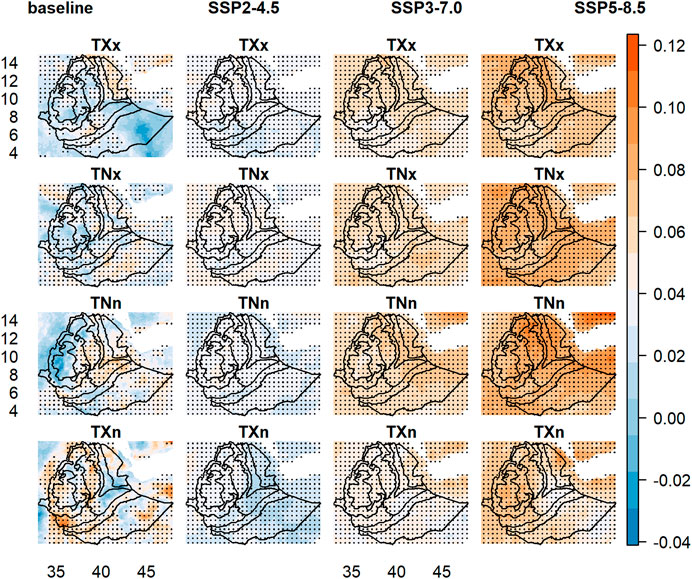
FIGURE 4. Same as Figure 3 but for indices: TXx, TNx, TNn and TXn in °C.
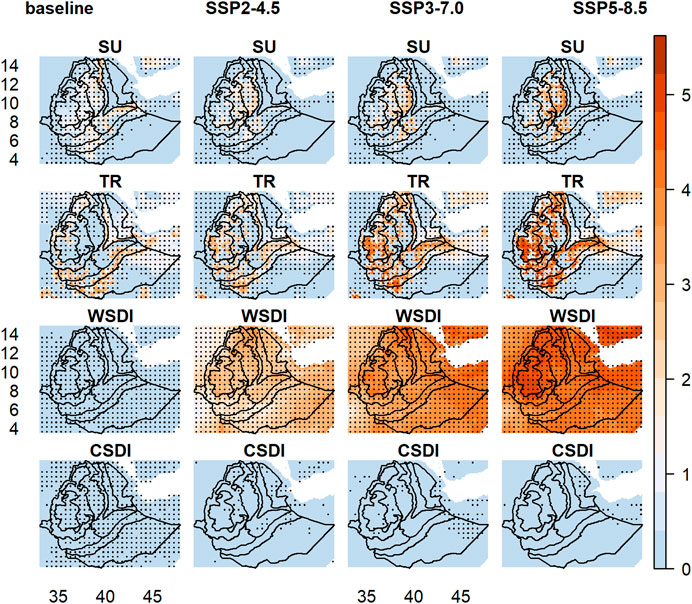
FIGURE 5. Same as Figure 3 but for indices: SU, TR, WSDI and CSDI in days.
3.2 Precipitation indices
The Taylor diagrams in Figure 6 indicate the performance of the individual GCMs with respect to the precipitation-related extreme indices in the observation data (i.e., CHIRPS) during 1983–2012. The GCMs had difficulties reproducing the observed data even at the sub-regional level (Supplementary Figures S3, S4). The correlation coefficients (r) of most precipitation-related extreme indices were below 0.4. The simulated variability in precipitation was considerably higher than the observed one where the standard deviations normalized to the observations are mostly around 2, with R20mm, R95pTOT, and R99pTOT showing values up to 3. The errors between the GCMs and the observation (centered RMSE) were within 2 units. The diagrams reveal that the GCMs ensemble average reduced both the error (centered RMSE) and the interannual variability (SD). However, for the majority of the indices, the correlation coefficients did not improve. Overall, regarding the precipitation-related indices, the GCMs performed much less well than for the temperature-related indices. The spatial distribution of the trend in precipitation-related extreme indices in the observed climate (1982–2012) and the projected climate (2020–2100) under the three SPSs are presented in Figures 7–9. The spatial patterns show that the observed trends were largely statistically significant (i.e., shown as areas with patches) across most of the indices except for R1mm, R10mm, R20mm, and Rx5day for some pocket areas in the western and southeastern parts of the country. The southeastern part of the country which belongs to the driest regions of the country [see Figure 1A; also refer to Rettie et al. (2023)] exhibited a significant increase in maximum 5-day precipitation (Rx5day), which is equivalent to an increase of 10 days per decade. Beyene et al. (2022) also found a significantly increasing trend in Rx5day the southern region, mainly Omo-Gibe and Rift Valley lake basins. Whereas the western part bordering Sudan showed a significantly increasing number of wet days (R1mm) by roughly 5 days per decade. The trends in number of wet days were however not significant in all scenarios. Largely increasing trends were also reported in Beyene et al. (2022) for R10 mm indices for Ethiopia of which 20% of the grids were statistically significant. Cattani et al. (2018) analyzed seasonal rainfall variability and trends over East Africa for 1983–2015. They found that R1mm and R20 mm show decreasing trend during October-December and an increasing trend during March-May seasons for the larger part of East Africa. On the other hand, as in the observed climate, significantly increasing trends are projected for maximum 5-day precipitation (Rx5day) where the trends were significant across the large parts of the country. Likewise, generally increasing trends were projected for number of days with more than 10 mm (R10 mm) and 20 mm (R20 mm) indices. They were significant across large parts of the country. Regarding the precipitation totals and wet days, exceptionally higher increases were projected under SSP3-7.0 in a small pocket region in the northwestern part of the country, which was statistically significant as well (Figure 9). The projected change for the indicated pocket region was more than 25 days per year increase both for very wet (R95pTOT) and extremely very wet (R99pTOT) days. Our results are in line with Gebrechorkos et al. (2019a), who found a significantly increased trend in R99pTOT and R99pTOT in southern Ethiopia for the period of 1981–2010. Unlike the temperature indices, the trends in precipitation are generally heterogeneous in terms of spatial distribution, magnitude, and statistical significance as well as across the different emission scenarios (SSPs). Despite the large spatial inconsistency, the overall results suggested that there are indications for an increase in the frequency of the most intense precipitation events.
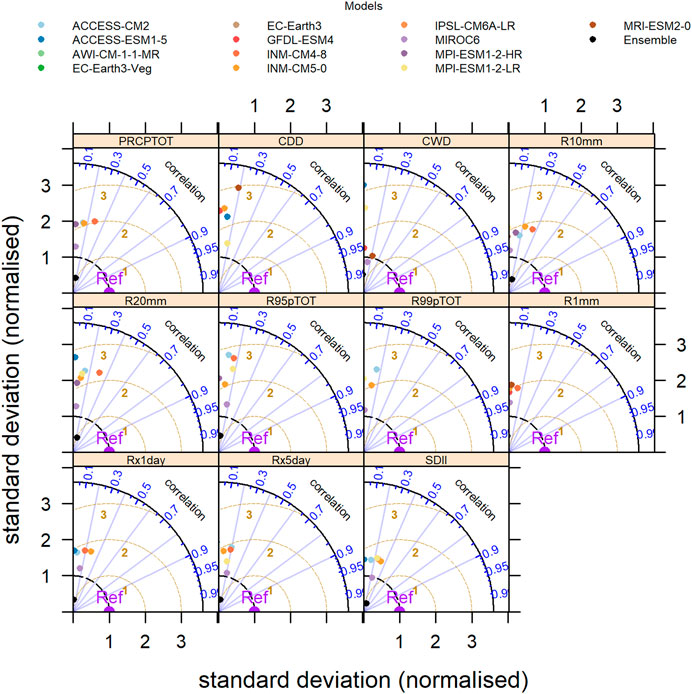
FIGURE 6. Taylor diagrams comparing the skill of the Global Climate Models (GCMs) in reproducing the observed (1983–2012) precipitation related indices. The azimuthal axis shows the correlation coefficients. The radial distance from the origin represents the variability (SD), while the distance from the “Ref” point is the centered RMSE (brown dashed lines) difference between the GCMs and observed precipitation related indices.
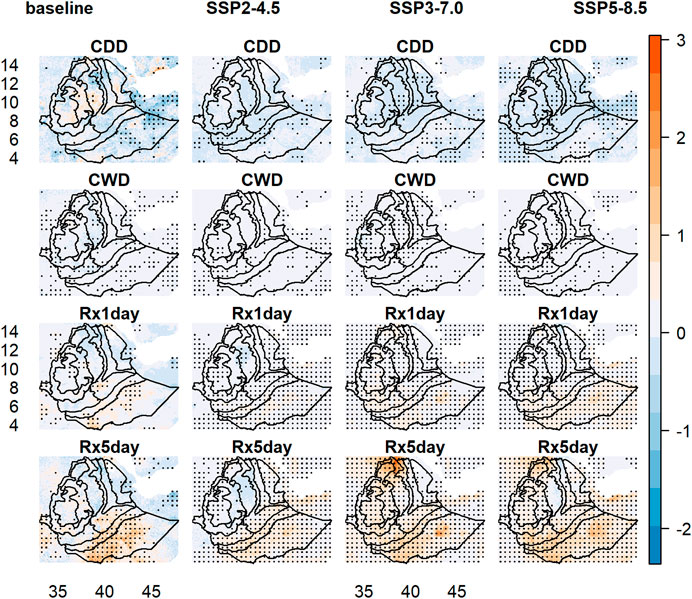
FIGURE 7. Spatial distribution of observation (1983–2012) and projected (2020–2100) trends (Sen’s slope) in multi-GCMs averaged precipitation indices (CDD and CWD in days, and Rx1day and Rx5day in mm) under the three SSPs. The patches show significant (p < 0.05, MK test) trends.
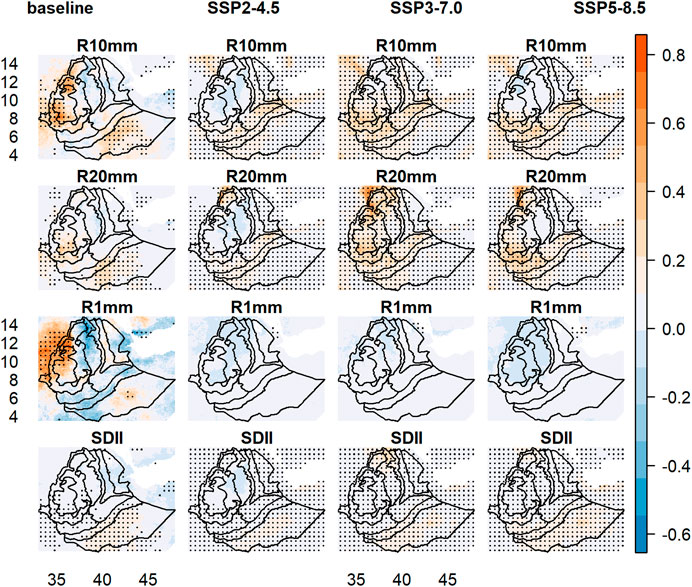
FIGURE 8. Same as Figure 7 but for indices: Number of heavy precipitation days with at least 10 mm (R10 mm) and 20 mm (R20 mm), number of wet days (R1mm), and simple daily intensity (SDII, mm).
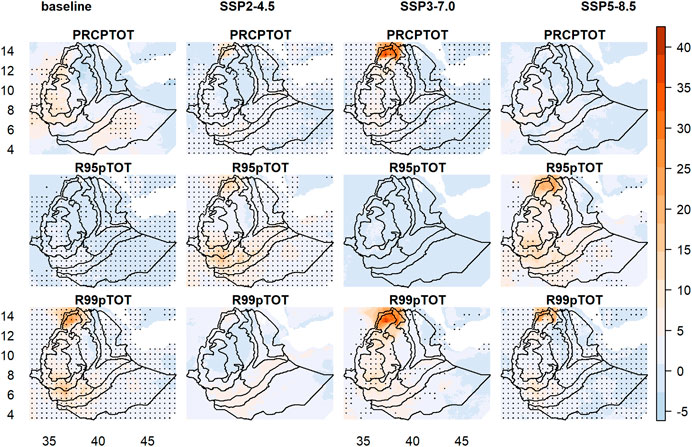
FIGURE 9. Same as Figure 7 but for indices: Total wet-day precipitation (PRCPTOT), very wet days total (R95pTOT), and extremely wet days total (R99pTOT) all in mm.
3.3 Projection uncertainty
We assessed the three components of climate change uncertainty (i.e., model (GCM), scenario (SSP), and internal climate variability) for all climate extreme indices for the 9 sub-regions defined by Rettie et al. (2023); Figures 10–13 present the evolution of the three components over time for the temperature-related indices (Figure 10; Figure 11) and precipitation-related indices (Figure 12; Figure 13). The figures show that, for temperature-related indices, a general decreasing contribution of uncertainties from the GCMs and internal variability to the total uncertainty while the reverse was true for the uncertainty from SSPs. These findings were largely consistent across the different regions of the country. Accordingly, the uncertainty from the GCMs accounts for about 64%–88% of the total uncertainty at the beginning of the projection period (i.e., 2020). This proportion decreased to about 45%–67% by the end of the projection period (i.e., 2100). Meanwhile, the contribution from the internal variability decreased from about 11%–32% at the beginning of the projected climate to less than 15% by the end of the century. Summer days (SU) are an exception here, with a slight projected increase. On the other hand, the fraction of uncertainty from the SSPs increased from less than 1% in 2020 to 18%–54% by the end of the century. Our results are consistent with previous studies that in the beginning projections are usually dominated by uncertainties from GCMs and internal variability (Zhang and Chen, 2021). The results were consistent across the temperature indices except for the cold spell duration index (CSDI) where the SSPs’ contribution to the total uncertainty remained negligible.
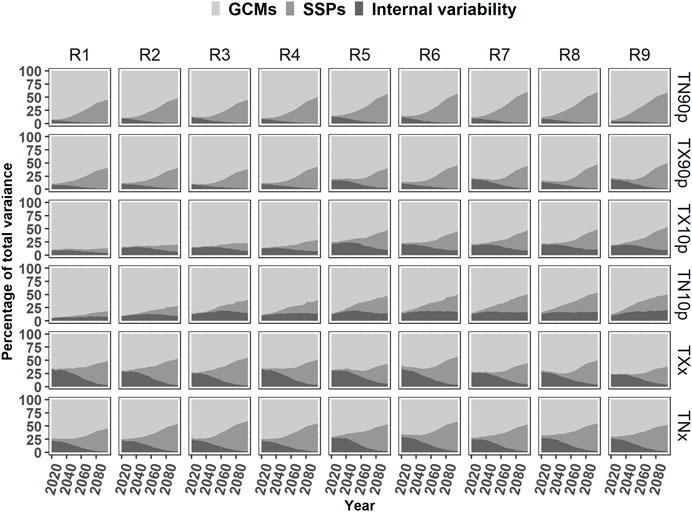
FIGURE 10. Percentage share of uncertainty for temperature indices depicted by sub-regions over 2020–2100.
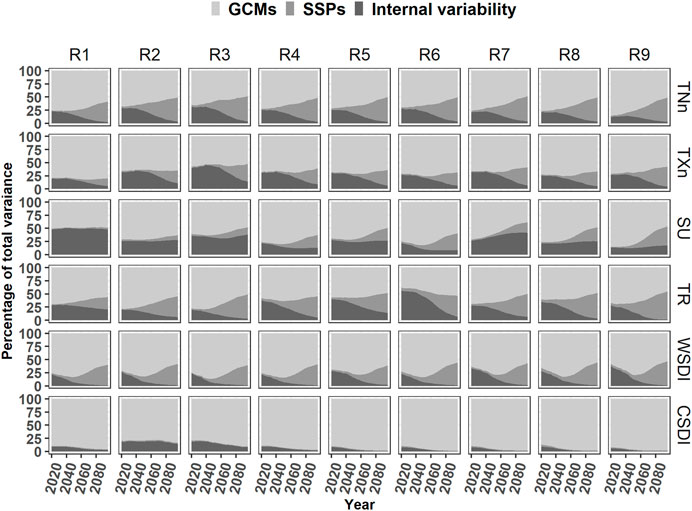
FIGURE 11. Same as Figure 10 but for indices: TNn, TXn, WSDI, CSDI, SU, and TR.
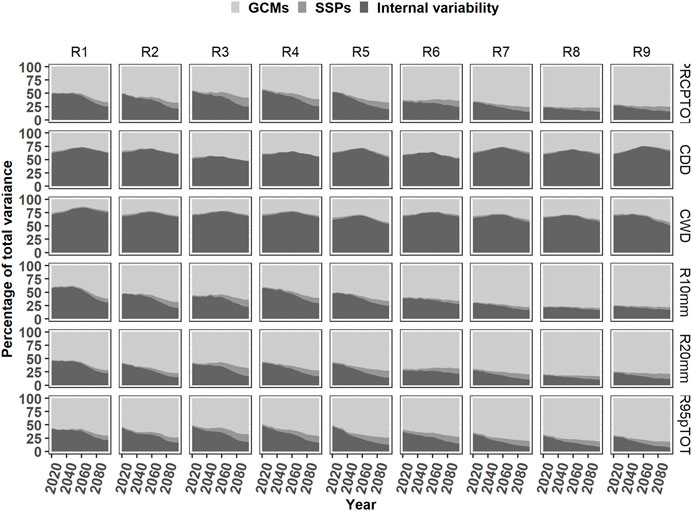
FIGURE 12. Percentage share of uncertainty for precipitation indices depicted by sub-regions over 2020–2100.
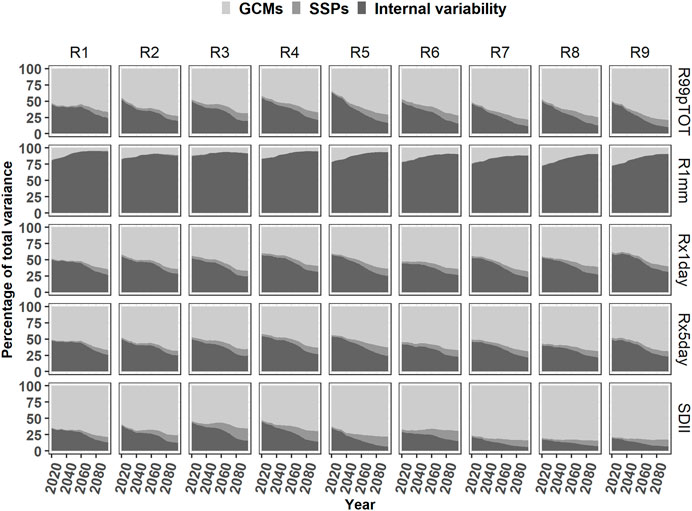
FIGURE 13. Same as Figure 12 but for indices: SDII, Rx1day, Rx5day, CDD, and CWD.
In contrast to the temperature indices, the total projection uncertainty of precipitation-related indices was dominated by the contribution from the GCMs and the internal climate variability, with marginal contribution from the SSPs. However, the fractional contribution from the GCMs and internal variability varies among the different indices. For CDD, CWD, R1mm, and Rx1day, a large proportion (∼57–87%) of the total uncertainty was due to the internal climate variability whereas, for the rest of the precipitation indices, the contribution from the GCMs is considerable. Mendoza Paz and Willems. (2022) also found that the larger proportions of the uncertainty in the projected precipitation extremes were related to the GCMs. In addition, the contribution of model uncertainty increases with a lead time for most of the precipitation indices except for CDD, CWD, R1mm, and Rx1day. Results were consistent across the different sub-regions. Compared to the temperature indices, internal climate variability was an important source of uncertainty for precipitation-related indices. Previous studies also showed the relative importance of the uncertainty from the internal climate variability for precipitation-related indices (e.g., Hawkins and Sutton, 2011; Fatichi et al., 2016; Gu et al., 2018).
To reduce the high uncertainty associated with the precipitation indices, we suggest further investigation based on multiple reference data sets (Grusson and Barron, 2021; Madakumbura et al., 2021) and as far as possible, station-based observation data (Cattani et al., 2018; Kim et al., 2019). Fatichi et al. (2016) claimed that the rigorous assessment of historic climate variability may give sufficient information about future changes in precipitation extremes. In addition, seasonal level analysis (Cattani et al., 2018; Ademe et al., 2020; Gemeda et al., 2021; Ali Mohammed et al., 2022; Beyene et al., 2022; Teshome et al., 2022) could also help to reduce the uncertainty compared to annual level analysis (this study) given the high spatial variability in the country.
3.4 Robustness of the projections
Finally, we quantified the signal-to-noise ratio (S/N) to demonstrate the influence of uncertainties on projected climate extreme indices over time (Hawkins and Sutton, 2009) and hence to evaluate the robustness of the projected changes in climate extremes (Hawkins and Sutton, 2009; 2011; Zhang et al., 2011). Figure 14 and Figure 15 present the S/N ratio for the temperature and precipitation-related indices, respectively, for the different sub-regions.
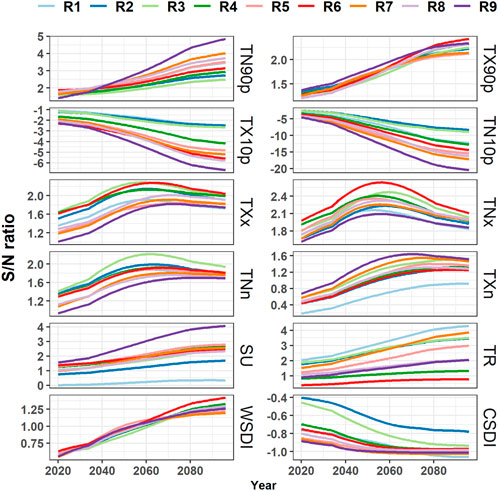
FIGURE 14. Signal-to-noise ratios for temperature indices depicted by sub-regions over 2020–2100.
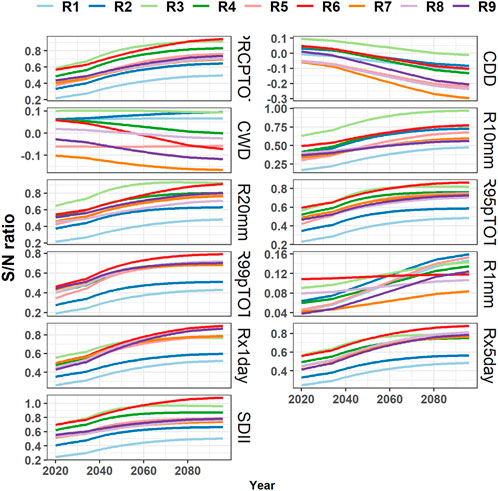
FIGURE 15. Signal-to-noise ratios for precipitation indices depicted by sub-regions over 2020–2100.
Largely consistent across the temperature-related indices, the signal-to-noise values increased in general with time, but with considerable regional variation (Figure 14). This implies that the magnitude of projected changes was greater than the magnitude of the associated uncertainty and hence the projected changes are reliable. However, the S/N ratio reaches peak values by the mid of the century (i.e., between 2050–2060) for temperature intensity indices (TXx, TXn, TNx, and TNn) with slightly decreasing values with projection time. The peaks around the mid of the century could be related to the shift in the contribution of uncertainties from the different sources (i.e., GCMs, SSPs, and internal climate variability). Zhang et al. (2011) reported a similar period where the shift in the contribution of uncertainty among the various sources occur. Regional comparisons show that sub-region R8 (which is the wettest region in the country, cf. Rettie et al. (2023)) shows a higher S/N ratio for most of the temperature-related indices while sub-region R1 (which belongs to the driest regions in the country) shows relatively lower S/N, particularly for coldness indices (i.e., CSDI, and TX10p).
Precipitation-related extremes are key for climate change adaptation as the country’s economy is heavily dependent on rainfed agriculture. The S/N ratio was below unity despite a slight increment with projection time (Figure 15) for most of the precipitation indices indicating that the magnitude of projected changes was smaller than the associated uncertainty. This implies that the projected changes are associated with high uncertainty and make the projection less reliable and not well-suited as a basis for decision-making. Achieving reliable projections for precipitation has been a challenge due to its associated higher uncertainties compared to temperature (Madakumbura et al., 2021; Zhang and Chen, 2021; Birhan et al., 2022). On the other hand, located near the equator and the Indian Ocean, the effects of the bi-annual migration of the Inter-Tropical Convergence Zone (ITCZ) and the El Niño–Southern Oscillation (ENSO) are the most important climate systems governing precipitation across Ethiopia (Korecha and Barnston, 2007). In this regard, one of the limitations of the current study is attributed to the structural deficiency of the climate models used in the study in reasonably simulating these major climate systems. The majority of state-of-the-art GCMs fail to simulate realistic ENSO characteristics (Beobide–Arsuaga et al., 2021) and the double- ITCZ bias remains one of the most outstanding errors in the models (Tian and Dong, 2020). Given these model deficiencies, their long-term prediction of climate extremes might be affected as well. Therefore, the results of our study particularly those of precipitation-derived extreme indices should be taken with caution. Despite these limitations, the regional comparisons suggest that fewer homogeneous clusters could be sufficient for the kind of studies treated in this paper (Ware et al., 2022).
4 Conclusion
Climate extremes in Ethiopia were comprehensively assessed until the end of the 21st century by producing and evaluating a large set of extreme climate indicator indices. The study constitutes a large number of state-of-the-art CMIP6 models covering a spectrum of emission scenarios at high spatial resolution. By evaluating the individual model performance during the base period, we estimated the possible change in the trends of projected climate extremes. The results were supplemented by a rigorous assessment of the uncertainties associated with the projected extremes. The projected trends for temperature-related indices are largely statistically significant and spatially consistent and much more reliable than the precipitation-related indices. Our study on projected changes in climate extremes at the national level was produced to serve as a baseline for future national or regional level analysis. In this context, we recommend further assessments to evaluate the effects of projected climate extremes on crop model and/or hydrological model outputs.
Data availability statement
Publicly available datasets were analyzed in this study. This data can be found here: figshare.com.
Author contributions
Conceptualization: FR, SG, and TS; methodology, formal analysis, visualization, software and validation and writing—original draft preparation: FR; supervision, investigation and resources: SG, TW, and TS; writing–review and editing: FR, SG, TW, KT, and TS; project administration and funding acquisition: SG and TS; All authors have read and agreed to the published version of the manuscript.
Funding
This publication is an output of a PhD scholarship at the University of Hohenheim in the framework of the project “German-Ethiopian SDG Graduate School: Climate Change Effects on Food Security (CLIFOOD)” between the University of Hohenheim (Germany) and the Hawassa University (Ethiopia), supported by the DAAD with funds from the Federal Ministry for Economic Cooperation and Development (BMZ), funding code 57316245. Additionally, this work was supported by the Collaborative Research Center 1253 CAMPOS (Project 7: Stochastic Modelling Framework), funded by the German Research Foundation (DFG, Grant Agreement SFB 1253/1 2017). The funders had no role in study design, data collection and analysis, decision to publish, or preparation of the manuscript.
Acknowledgments
The authors acknowledge the support by the state of Baden-Württemberg through bwHPC.
Conflict of interest
The authors declare that the research was conducted in the absence of any commercial or financial relationships that could be construed as a potential conflict of interest.
Publisher’s note
All claims expressed in this article are solely those of the authors and do not necessarily represent those of their affiliated organizations, or those of the publisher, the editors and the reviewers. Any product that may be evaluated in this article, or claim that may be made by its manufacturer, is not guaranteed or endorsed by the publisher.
Supplementary material
The Supplementary Material for this article can be found online at: https://www.frontiersin.org/articles/10.3389/fenvs.2023.1127265/full#supplementary-material
References
Ademe, D., Ziatchik, B. F., Tesfaye, K., Simane, B., Alemayehu, G., and Adgo, E. (2020). Climate trends and variability at adaptation scale: Patterns and perceptions in an agricultural region of the Ethiopian Highlands. Weather Clim. Extrem. 29, 100263. doi:10.1016/j.wace.2020.100263
Afuecheta, E., and Omar, M. H. (2021). Characterization of variability and trends in daily precipitation and temperature extremes in the Horn of Africa. Clim. Risk Manag. 32, 100295. doi:10.1016/j.crm.2021.100295
Alaminie, A. A., Tilahun, S. A., Legesse, S. A., Zimale, F. A., Tarkegn, G. B., and Jury, M. R. (2021). Evaluation of past and future climate trends under CMIP6 scenarios for the UBNB (Abay), Ethiopia. WaterSwitzerl. 13, 2110. doi:10.3390/w13152110
Ali Mohammed, J., Gashaw, T., Worku Tefera, G., Dile, Y. T., Worqlul, A. W., and Addisu, S. (2022). Changes in observed rainfall and temperature extremes in the upper blue nile basin of Ethiopia. Weather Clim. Extrem. 37, 100468. doi:10.1016/j.wace.2022.100468
Bayable, G., Amare, G., Alemu, G., and Gashaw, T. (2021). Spatiotemporal variability and trends of rainfall and its association with pacific ocean sea surface temperature in west harerge zone, eastern Ethiopia. Environ. Syst. Res. 10, 7. doi:10.1186/s40068-020-00216-y
Belete, M., Deng, J., Wang, K., Zhou, M., Zhu, E., Shifaw, E., et al. (2020). Evaluation of satellite rainfall products for modeling water yield over the source region of Blue Nile Basin. Sci. Total Environ. 708, 134834. doi:10.1016/j.scitotenv.2019.134834
Beobide-Arsuaga, G., Bayr, T., Reintges, A., and Latif, M. (2021). Uncertainty of ENSO-amplitude projections in CMIP5 and CMIP6 models. Clim. Dyn. 56, 3875–3888. doi:10.1007/s00382-021-05673-4
Berhane, G., Dereje, M., Minten, B., and Tamru, S. (2017). The rapid–but from a low base–uptake of agricultural mechanization in Ethiopia: Patterns, implications and challenges. Washington, D.C.; Addis Ababa, Ethiopia: International Food Policy Research Institute. Available at: http://ebrary.ifpri.org/cdm/ref/collection/p15738coll2/id/131146.
Beyene, T. K., Jain, M. K., Yadav, B. K., and Agarwal, A. (2022). Multiscale investigation of precipitation extremes over Ethiopia and teleconnections to large-scale climate anomalies. Stoch. Environ. Res. Risk Assess. 36, 1503–1519. doi:10.1007/s00477-021-02120-y
Birhan, D. A., Zaitchik, B. F., Fantaye, K. T., Birhanu, B. S., Damot, G. A., and Tsegaye, E. A. (2022). Observed and projected trends in climate extremes in a tropical highland region: An agroecosystem perspective. Agroecosystem perspective 42, 2493–2513. doi:10.1002/joc.7378
Brown, M. E., Funk, C., Pedreros, D., Korecha, D., Lemma, M., Rowland, J., et al. (2017). A climate trend analysis of Ethiopia: Examining subseasonal climate impacts on crops and pasture conditions. Clim. Change 142, 169–182. doi:10.1007/s10584-017-1948-6
Cattani, E., Merino, A., Guijarro, J. A., and Levizzani, V. (2018). East Africa Rainfall trends and variability 1983-2015 using three long-term satellite products. Remote Sens. 10, 931–1026. doi:10.3390/rs10060931
IPCC (2022). “Climate change 2022: Impacts, adaptation and vulnerability,” in Contribution of working group II to the sixth assessment report of the intergovernmental panel on climate change Editors, D. C. Roberts, M. Tignor, E. S. Poloczanska, K. Mintenbeck, A. Alegría, M. Craiget al. (Cambridge, UK; New York, NY, USA: Cambridge University Press). doi:10.1017/9781009325844
Dendir, Z., and Birhanu, B. S. (2022). Analysis of observed trends in daily temperature and precipitation extremes in different agroecologies of gurage zone, southern Ethiopia. Adv. Meteorology 2022, 1–13. doi:10.1155/2022/4745123
Dinku, T., Funk, C., Peterson, P., Maidment, R., Tadesse, T., Gadain, H., et al. (2018). Validation of the CHIRPS satellite rainfall estimates over eastern Africa. Q. J. R. Meteorological Soc. 144, 292–312. doi:10.1002/qj.3244
Diro, G. T., Grimes, D. I. F., and Black, E. (2011). Large scale features affecting ethiopian rainfall. Adv. Glob. change Res. 43, 1–50. doi:10.1007/978-90-481-3842-5_2
El Kenawy, A. M., McCabe, M. F., Vicente-Serrano, S. M., López-Moreno, J. I., and Robaa, S. M. (2016). Changes in the frequency and severity of hydrological droughts over Ethiopia from 1960 to 2013. Cuad. Investig. Geogr. 42, 145–166. doi:10.18172/cig.2931
Esayas, B., Simane, B., Teferi, E., Ongoma, V., and Tefera, N. (2018). Trends in extreme climate events over three agroecological zones of southern Ethiopia. Adv. Meteorology 2018, 1–17. doi:10.1155/2018/7354157
Eshetu, F., and Mehare, A. (2020). Determinants of ethiopian agricultural exports: A dynamic panel data analysis. Rev. Mark. Integration 12, 70–94. doi:10.1177/0974929220969272
Fatichi, S., Ivanov, V. Y., Paschalis, A., Peleg, N., Molnar, P., Rimkus, S., et al. (2016). Uncertainty partition challenges the predictability of vital details of climate change. Earth’s Future 4, 240–251. doi:10.1002/2015EF000336
FEWS NET (2022). Extreme food insecurity persists in the north while outcomes deteriorate in the south amid historic drought. Available at: https://reliefweb.int/report/ethiopia/ethiopia-food-security-outlook-june-2021-january-2022.
Funk, C., Peterson, P., Landsfeld, M., Pedreros, D., Verdin, J., Shukla, S., et al. (2015). The climate hazards infrared precipitation with stations - a new environmental record for monitoring extremes. Sci. Data 2, 150066–150121. doi:10.1038/sdata.2015.66
Gebrechorkos, S. H., Hülsmann, S., and Bernhofer, C. (2019a). Changes in temperature and precipitation extremes in Ethiopia, Kenya, and Tanzania. Int. J. Climatol. 39, 18–30. doi:10.1002/joc.5777
Gebrechorkos, S. H., Hülsmann, S., and Bernhofer, C. (2019b). Long-term trends in rainfall and temperature using high-resolution climate datasets in East Africa. Sci. Rep. 9, 11376–11379. doi:10.1038/s41598-019-47933-8
Gemeda, D. O., Korecha, D., and Garedew, W. (2021). Evidences of climate change presences in the wettest parts of southwest Ethiopia. Heliyon 7, e08009. doi:10.1016/j.heliyon.2021.e08009
Grusson, Y., and Barron, J. (2021). Challenges in reanalysis products to assess extreme weather impacts on yield underestimate drought. Plos Clim. 2021, 1–11. doi:10.21203/rs.3.rs-908090/v1
Gu, H., Yu, Z., Yang, C., Ju, Q., Yang, T., and Zhang, D. (2018). High-resolution ensemble projections and uncertainty assessment of regional climate change over China in CORDEX East Asia. Hydrology Earth Syst. Sci. 22, 3087–3103. doi:10.5194/hess-22-3087-2018
Gummadi, S., Rao, K. P. C., Seid, J., Legesse, G., Kadiyala, M. D. M., Takele, R., et al. (2018). Spatio-temporal variability and trends of precipitation and extreme rainfall events in Ethiopia in 1980–2010. Theor. Appl. Climatol. 134, 1315–1328. doi:10.1007/s00704-017-2340-1
Guo, L. Y., Gao, Q., Jiang, Z. H., and Li, L. (2018). Bias correction and projection of surface air temperature in LMDZ multiple simulation over central and eastern China. Adv. Clim. Change Res. 9, 81–92. doi:10.1016/j.accre.2018.02.003
Hamlet, A. F., Salathé, E. P., and Carrasco, P. (2010). Statistical downscaling techniques for global climate model simulations of temperature and precipitation with application to water resources planning studies. University of Washington, Seattle: Center for Science in the Earth System.
Hawkins, E., and Sutton, R. (2011). The potential to narrow uncertainty in projections of regional precipitation change. Clim. Dyn. 37, 407–418. doi:10.1007/s00382-010-0810-6
Hawkins, E., and Sutton, R. (2009). The potential to narrow uncertainty in regional climate predictions. Bull. Am. Meteorological Soc. 90, 1095–1108. doi:10.1175/2009BAMS2607.1
He, X., and Chen, Z. (2022). Weather, cropland expansion, and deforestation in Ethiopia. J. Environ. Econ. Manag. 111, 102586. doi:10.1016/j.jeem.2021.102586
Her, Y., Yoo, S. H., Cho, J., Hwang, S., Jeong, J., and Seong, C. (2019). Uncertainty in hydrological analysis of climate change: Multi-parameter vs. multi-GCM ensemble predictions. Sci. Rep. 9, 4974–5022. doi:10.1038/s41598-019-41334-7
IPCC (2021). Climate change 2021: The physical science basis. Contribution of working group i to the sixth assessment report of the intergovernmental panel on climate change. Cambridge, UK; New York, NY, USA: Cambridge University Press. doi:10.1017/9781009157896
Kabite Wedajo, G., Kebede Muleta, M., and Gessesse Awoke, B. (2021). Performance evaluation of multiple satellite rainfall products for Dhidhessa River Basin (DRB), Ethiopia. Atmos. Meas. Tech. 14, 2299–2316. doi:10.5194/amt-14-2299-2021
Kemp, L., Xu, C., Depledge, J., Ebi, K. L., Gibbins, G., and Kohler, T. A. (2022). Climate Endgame: Exploring catastrophic climate change scenarios. EARTH, Atmos. Planet. Sci. 119, 1–9. doi:10.1073/pnas.2108146119/-/DCSupplemental
Kim, I. W., Oh, J., Woo, S., and Kripalani, R. H. (2019). Evaluation of precipitation extremes over the asian domain: Observation and modelling studies. Clim. Dyn. 52, 1317–1342. doi:10.1007/s00382-018-4193-4
Kiros, F. G. (1991). Economic consequences of drought, crop failure and famine in Ethiopia, 1973-1986. Ambio 20, 183–185.
Korecha, D., and Barnston, A. G. (2007). Predictability of june-september rainfall in Ethiopia. Mon. Weather Rev. 135, 628–650. doi:10.1175/MWR3304.1
Lee, S., Qi, J., McCarty, G. W., Yeo, I. Y., Zhang, X., Moglen, G. E., et al. (2021). Uncertainty assessment of multi-parameter, multi-GCM, and multi-RCP simulations for streamflow and non-floodplain wetland (NFW) water storage. J. Hydrology 600, 126564. doi:10.1016/j.jhydrol.2021.126564
Li, J., Miao, C., Wei, W., Zhang, G., Hua, L., Chen, Y., et al. (2021). Evaluation of CMIP6 global climate models for simulating land surface energy and water fluxes during 1979–2014. J. Adv. Model. Earth Syst. 13, 1–32. doi:10.1029/2021MS002515
Liu, L. Y., Wang, X. J., Gou, X. H., Yang, M. X., and Zhang, Z. H. (2022). Projections of surface air temperature and precipitation in the 21st century in the Qilian Mountains, Northwest China, using REMO in the CORDEX. Adv. Clim. Change Res. 13, 344–358. doi:10.1016/j.accre.2022.03.003
Madakumbura, G. D., Thackeray, C. W., Norris, J., Goldenson, N., and Hall, A. (2021). Anthropogenic influence on extreme precipitation over global land areas seen in multiple observational datasets. Nat. Commun. 12, 3944. doi:10.1038/s41467-021-24262-x
Malaekeh, S. M., Safaie, A., Shiva, L., and Tabari, H. (2022). Spatio-temporal variation of hydro-climatic variables and extreme indices over Iran based on reanalysis data. Stoch. Environ. Res. Risk Assess. 36, 3725–3752. doi:10.1007/s00477-022-02223-0
Malede, D. A., Agumassie, T. A., Kosgei, J. R., Pham, Q. B., and Andualem, T. G. (2022). Evaluation of satellite rainfall estimates in a rugged topographical basin over south gojjam basin, Ethiopia. J. Indian Soc. Remote Sens. 50, 1333–1346. doi:10.1007/s12524-022-01530-x
Mann, H. B. (1945). Nonparametric tests against trend. Econ. J. Econ. Soc. 13, 245–259. doi:10.2307/1907187
Maurer, E. P., Hidalgo, H. G., Das, T., Dettinger, M. D., and Cayan, D. R. (2010). The utility of daily large-scale climate data in the assessment of climate change impacts on daily streamflow in California. Hydrology Earth Syst. Sci. 14, 1125–1138. doi:10.5194/hess-14-1125-2010
Meinshausen, M., Nicholls, Z. R. J., Lewis, J., Gidden, M. J., Vogel, E., Freund, M., et al. (2020). The shared socio-economic pathway (SSP) greenhouse gas concentrations and their extensions to 2500. Geosci. Model. Dev. 13, 3571–3605. doi:10.5194/gmd-13-3571-2020
Mendoza Paz, S., and Willems, P. (2022). Uncovering the strengths and weaknesses of an ensemble of quantile mapping methods for downscaling precipitation change in Southern Africa. J. Hydrology Regional Stud. 41, 101104. doi:10.1016/j.ejrh.2022.101104
Mohammed, Y., Yimer, F., Tadesse, M., and Tesfaye, K. (2018). Meteorological drought assessment in north east highlands of Ethiopia. Int. J. Clim. Change Strategies Manag. 10, 142–160. doi:10.1108/IJCCSM-12-2016-0179
Murphy, J. M., Sexton, D. M. H., Barnett, D. H., Jones, G. S., Webb, M. J., Collins, M., et al. (2004). Quantification of modelling uncertainties in a large ensemble of climate change simulations. Nature 430, 768–772. doi:10.1038/nature02771
Muthoni, F. K., Odongo, V. O., Ochieng, J., Mugalavai, E. M., Mourice, S. K., Hoesche-Zeledon, I., et al. (2019). Long-term spatial-temporal trends and variability of rainfall over Eastern and Southern Africa. Theor. Appl. Climatol. 137, 1869–1882. doi:10.1007/s00704-018-2712-1
Muthoni, F. (2020). Spatial-temporal trends of rainfall, maximum and minimum temperatures over West Africa. IEEE J. Sel. Top. Appl. Earth Observations Remote Sens. 13, 2960–2973. doi:10.1109/JSTARS.2020.2997075
Myhre, G., Alterskjær, K., Stjern, C. W., HodnebrogMarelle, L., Samset, B. H., Sillmann, J., et al. (2019). Frequency of extreme precipitation increases extensively with event rareness under global warming. Sci. Rep. 9, 16063. doi:10.1038/s41598-019-52277-4
O’Neill, B. C., Kriegler, E., Ebi, K. L., Kemp-Benedict, E., Riahi, K., Rothman, D. S., et al. (2017). The roads ahead: Narratives for shared socioeconomic pathways describing world futures in the 21st century. Glob. Environ. Change 42, 169–180. doi:10.1016/j.gloenvcha.2015.01.004
Pacific Climate Impacts Consortium (2020). Climdex.pcic: PCIC implementation of climdex routines. Available at: https://CRAN.R-project.org/package=climdex.pcic.
Pervin, L., and Khan, M. S. M. (2022). Variability and trends of climate extremes indices from the observed and downscaled GCMs data over 1950–2020 period in Chattogram City, Bangladesh. J. Water Clim. Change 13, 975–998. doi:10.2166/wcc.2021.331
Pohlert, T. (2020). Trend: Non-parametric trend tests and change-point detection. Available at: https://CRAN.R-project.org/package=trend.
Rao, X., Lu, X., and Dong, W. (2019). Evaluation and projection of extreme precipitation over Northern China in CMIP5 models. Atmosphere 10, 691. doi:10.3390/atmos10110691
Rettie, F. M., Gayler, S., Weber, T. K. D. D., Tesfaye, K., and Streck, T. (2023). High-resolution CMIP6 climate projections for Ethiopia using the gridded statistical downscaling method. Scientific Data.
Saeidizand, R., Sabetghadam, S., Tarnavsky, E., and Pierleoni, A. (2018). Evaluation of CHIRPS rainfall estimates over Iran. Q. J. R. Meteorological Soc. 144, 282–291. doi:10.1002/qj.3342
Sen, P. K. (1968). Estimates of the regression coefficient based on kendall’s tau. J. Am. Stat. Assoc. 63, 1379–1389. doi:10.1080/01621459.1968.10480934
Simanjuntak, C., Gaiser, T., Ahrends, H. E., and Srivastava, A. K. (2022). Spatial and temporal patterns of agrometeorological indicators in maize producing provinces of South Africa. Sci. Rep. 12, 12072–12118. doi:10.1038/s41598-022-15847-7
Taye, M., Sahlu, D., Zaitchik, B. F., and Neka, M. (2020). Evaluation of satellite rainfall estimates for meteorological drought analysis over the upper blue nile basin, Ethiopia. Geosci. Switz. 10, 352–422. doi:10.3390/geosciences10090352
Taylor, K. E. (2001). Summarizing multiple aspects of model performance in a single diagram. J. Geophys. Res. Atmos. 106, 7183–7192. doi:10.1029/2000JD900719
Teshome, H., Tesfaye, K., Dechassa, N., Tana, T., and Huber, M. (2022). Analysis of past and projected trends of rainfall and temperature parameters in eastern and western hararghe zones, Ethiopia. Atmosphere 13, 67. doi:10.3390/atmos13010067
Tian, B., and Dong, X. (2020). The double-ITCZ bias in CMIP3, CMIP5, and CMIP6 models based on annual mean precipitation. Geophys. Res. Lett. 47, 1–11. doi:10.1029/2020GL087232
Tierney, J. E., Ummenhofer, C. C., and DeMenocal, P. B. (2015). Past and future rainfall in the horn of africa. Sci. Adv. 1, e1500682–e1500689. doi:10.1126/sciadv.1500682
Van den Hende, C., Van Schaeybroeck, B., Nyssen, J., Van Vooren, S., Van Ginderachter, M., and Termonia, P. (2021). Analysis of rain-shadows in the Ethiopian Mountains using climatological model data. Clim. Dyn. 56, 1663–1679. doi:10.1007/s00382-020-05554-2
Verdin, A., Funk, C., Peterson, P., Landsfeld, M., Tuholske, C., and Grace, K. (2020). Development and validation of the CHIRTS-daily quasi-global high-resolution daily temperature data set. Sci. Data 7, 303–314. doi:10.1038/s41597-020-00643-7
Viste, E., Korecha, D., and Sorteberg, A. (2013). Recent drought and precipitation tendencies in Ethiopia. Theor. Appl. Climatol. 112, 535–551. doi:10.1007/s00704-012-0746-3
Vogel, E., Donat, M. G., Alexander, L. V., Meinshausen, M., Ray, D. K., Karoly, D., et al. (2019). The effects of climate extremes on global agricultural yields. Environ. Res. Lett. 14, 054010. doi:10.1088/1748-9326/ab154b
Ware, M. B., Mori, P., Warrach-Sagi, K., Jury, M., Schwitalla, T., Beyene, K. H., et al. (2022). Climate regionalization using objective multivariate clustering methods and characterization of climatic regions in Ethiopia. Meteorol. Z. 31, 431–453. doi:10.1127/metz/2022/1093
Wei, L., Xin, X., Li, Q., Wu, Y., Tang, H., Li, Y., et al. (2022). Simulation and projection of climate extremes in China by multiple coupled model Intercomparison project Phase 6 models. Int. J. Climatol. 43, 219–239. doi:10.1002/joc.7751
World Bank (2022a). Agricultural irrigated land (% of total agricultural land) - Ethiopia. Available at: https://data.worldbank.org/indicator/AG.LND.IRIG.AG.ZS?view=chart&locations=ET.
World Bank (2022b). Agriculture, forestry, and fishing, value added (% of GDP) - Ethiopia. Available at: https://data.worldbank.org/indicator/NV.AGR.TOTL.ZS?locations=ET.
World Bank (2022c). Employment in agriculture (% of total employment) (modeled ILO estimate) - Ethiopia. Available at: https://data.worldbank.org/indicator/SL.AGR.EMPL.ZS?locations=ET.
World Bank (2022d). Health nutrition and population statistics: Population estimates and projections – Ethiopia. Available at: https://databank.worldbank.org/source/population-estimates-and-projections.
Yang, X., Yong, B., Yu, Z., and Zhang, Y. (2021). An evaluation of CMIP5 precipitation simulations using ground observations over ten river basins in China. Hydrology Res. 52, 676–698. doi:10.2166/nh.2021.151
Zambrano-Bigiarini, M., Nauditt, A., Birkel, C., Verbist, K., and Ribbe, L. (2017). Temporal and spatial evaluation of satellite-based rainfall estimates across the complex topographical and climatic gradients of Chile. Hydrology Earth Syst. Sci. 21, 1295–1320. doi:10.5194/hess-21-1295-2017
Zhang, S., and Chen, J. (2021). Uncertainty in projection of climate extremes: A comparison of CMIP5 and CMIP6. J. Meteorological Res. 35, 646–662. doi:10.1007/s13351-021-1012-3
Keywords: climate extremes, CMIP 6, Ethiopa, precipiation, SSPS, temeprature, uncertainty, trend
Citation: Rettie FM, Gayler S, Weber TKD, Tesfaye K and Streck T (2023) Comprehensive assessment of climate extremes in high-resolution CMIP6 projections for Ethiopia. Front. Environ. Sci. 11:1127265. doi: 10.3389/fenvs.2023.1127265
Received: 19 December 2022; Accepted: 28 March 2023;
Published: 09 May 2023.
Edited by:
Shuliang Zhang, Nanjing Normal University, ChinaReviewed by:
Chi Yang, Distinguished Professor of Nanjing University of Information Science and Technology, ChinaAlbert Ossó, University of Graz, Austria
Copyright © 2023 Rettie, Gayler, Weber, Tesfaye and Streck. This is an open-access article distributed under the terms of the Creative Commons Attribution License (CC BY). The use, distribution or reproduction in other forums is permitted, provided the original author(s) and the copyright owner(s) are credited and that the original publication in this journal is cited, in accordance with accepted academic practice. No use, distribution or reproduction is permitted which does not comply with these terms.
*Correspondence: Fasil M. Rettie, fasil.mequanint@uni-hohenheim.de