Available Nutrients Can Accumulate in Permanent Skid Trails
by
 ,
,
Kenton P. Stutz
1,* ,
,
Helmer Schack-Kirchner
1,
Gerald Kändler
2,
Lea Landes
1,
Martin Linz
1,
Hannes Warlo
1 and
Friederike Lang
1 1
Chair of Soil Ecology, Institute of Forest Sciences, University of Freiburg, D-79085 Freiburg, Germany
2
Department of Biometry, Forest Research Institute of Baden-Württemberg, D-79100 Freiburg, Germany
*
Author to whom correspondence should be addressed.
Forests 2017, 8(10), 358; https://doi.org/10.3390/f8100358
Submission received: 4 August 2017
/
Revised: 3 September 2017
/
Accepted: 20 September 2017
/
Published: 23 September 2017
Abstract
:Forest harvesting removes and redistributes nutrients through felling and forwarding. Substantial quantities of nutrients can accumulate in brash mats on permanent skid trails, but their availability and uptake after multiple thinnings on soils susceptible to leaching are unknown. In this study, we modeled the deposition of base cations and phosphorus on a permanent skid trail after five thinnings of a Picea abies (L.) Karst. stand, and measured the resulting nutrient stocks in both the forest floor and mineral soil. An estimated 35%, 44%, 41%, and 61% of harvested Ca, K, Mg, and P, respectively, were redistributed to the skid trail. Of those deposited stocks, 32–65% of nutrients remained in decomposed brash material on the skid trail. Mineral soil stocks for Ca, K, and P were significantly higher in the skid trail than in the stand, which included minor increases in bioavailable pools. Skid trail root densities were not lower than the stand while bulk densities were only partially higher. Both would not limit nutrient uptake. There were no significant relations between needle nutrient concentrations and distance to the skid trail. Altogether, these results indicate that nutrient uptake from the skid trail was minimal despite their accumulation, chemical availability, and physical accessibility. This suggests that other factors such as liming and frequent thinning disturbances can repress uptake of available nutrients on skid trails.
1. Introduction
Timber harvesting both extracts and redistributes essential nutrients within forest ecosystems. For instance, mechanized thinning and harvesting in Central Europe frequently involves crane harvesters equipped with a felling-delimbing head. These machines traffic skid trails roughly 4 m wide, spaced 20–40 m apart, covering 10–20% of the stand surface area. Trees within reach are felled, delimbed and partially debarked in front of the harvester, cut into fixed-length logs, and forwarded to the edge of the stand. Branches and other slash—along with their nutrients—are left on the skid trail forming a brash mat. Brash-mats can reduce the soil physical impact of machine traffic, provided they are thick enough, as well as protect against erosion [1,2]. Additionally, due to the lengthy recovery time of machine-induced soil deformation, skid trail networks are more frequently planned and permanent [3,4]. By reusing skid trails, the disturbed soil area is limited to ≤20% of the forest stand independent of the harvesting frequency and intensity.
However, the long-term and systematic redistribution of slash constitutes a sustained disturbance to forest nutrient cycles. For the stand matrix between skid trails, these operational systems are, in practice, whole tree harvests that impact nutrient stocks through the removal of stem wood, bark, branches, and foliage (according to the classification of Achat et al. [5]). Such removal in boreal stands increases nutrient export 2–4-fold due to the higher nutrient contents in the non-timber biomass compartments [6], which would compromise nutrient cycle sustainability and depress growth [7]. On the other hand, by concentrating the non-timber residues as brash mats on skid trails, their nutrients are not exported from the system, rather they stay within the stand concentrated strip-wise on roughly 20% of the stand’s surface. A similar residue treatment is the piling of clearcut slash into windrows. In a nutrient-poor slash and longleaf pine forest (Pinus elliottii and Pinus palustris, respectively) 15–40% of total ecosystem nutrients were concentrated on 6% of the stand in windrows [8]. The fate, however, of such quantities of nutrients in windrows is uncertain: increased mobility and leaching has been observed [9] while slow mineralization rates of residues could retain nutrients till used by the reestablished stand [10]. The soil degradation through compaction from machine traffic can also limit root access to accumulated nutrients and biological communities that regulate decomposition rates of overlying brash mats [11,12].
The fate of brash mat nutrients on skid trails is therefore not full export as when whole-trees are removed, nor full retention as when stems are processed within the stand matrix, but rather somewhere in between. Two studies suggest that nutrients within brash mats on freshly-formed skid trails are potentially retained and cycled back into stand vegetation. Stutz et al. [13] reported that roughly 50% of deposited phosphorus was lost from brash mats five years after thinning a silver fir (Abies alba L.) stand, and the missing P was not found in the mineral soil, suggesting uptake of deposited P by stand vegetation. Borchert et al. [14] found that cationic nutrients tended to accumulate in new brash mats and the underlying soil three years after thinning a Norway spruce (Picea abies [L.] Karst.) stand. Simultaneously, they found increased water uptake under the brash mat, implying potential uptake of such nutrients by surrounding trees [14]. Yet both studies are not fully consistent in their conclusions due to the different nutrients analyzed and because neither considered the continued accumulation of slash and nutrients on permanent skid trails through multiple thinnings and mechanized disturbance.
The central questions to this study are as follows:
- How much biomass and associated Ca, K, Mg, and P are deposited on permanent skid trails through multiple thinnings?
- What fraction of the deposited nutrients is retained on the skid trails?
- What proportion of the remaining nutrients is found in the brash mat and mineral soil, and to what extent are they available?
- Would the accumulated nutrients change the nutrition state of trees adjacent to the skid trails?
As in Stutz et al. [13], we addressed Questions 1–3 by (i) estimating the nutrient redistribution onto a permanent skid trail through reconstructed biomass removal from stumps classified by their state of decay, and (ii) measuring total and plant-available nutrient stocks in the forest floor and mineral soil of the skid trail and adjacent stand. For Question 4, we assessed the nutrient concentrations within needles as a function of distance to the skid trail. We consequently expect to obtain a more comprehensive view on the fate of nutrients in brash mats on permanent skid trails.
2. Materials and Methods
2.1. Study Site
Samples came from a 13.8 ha, 50-year-old, planted Norway spruce (Picea abies [L.] Karst.) stand on a gentle (5–10%), northwest-facing hillslope 650 m a.s.l. in the Southwest Alpenvorland, Germany (9°3245 E, 48°1012 N). Yearly temperature is on average 7.6 C with 738 mm of mean annual precipitation. The soil is a Haplic Luvisol (Siltic, Cutanic) (WRB 2014 [15]) with silty loam derived from Riss moraine. Ground and stagnate water are not present and do not influence the soil. European beech (Fagus sylvatica L.), oak (Quercus sp.), and Douglas fir (Pseudotsuga menziesii (Mirb.) F.) are also minimally present in the stand. The stand’s site index for spruce is 37–38 m at 100 years ([16,17], dGZ).
The stand was first low thinned for release of selected stems (“Zukunftsbäume” in German) in 1996 when permanent skid trails were marked every 20 m and were subsequently used during thinnings in 2003–2004, 2007–2008, 2011, and 2015 (the time of sampling). All thinnings were fully mechanized with dangle-head harvesters felling stems in the stand, lifting each stem to the skid trail, and bucking, delimbing, and partial debarking stems directly above the established skid trails; and crane forwarders subsequently removing processed stems (“Stem[Wood + Bark] + Branches + Foliage” in Achat et al. [5]). The entire stand was limed with 3 Mg ha of dolomite (>12% MgO) by helicopter in 2003 in response to acidification, a standard practice of German forestry in some regions; pH values in 2015 ranged from 3.86 to 4.91 in the top 100 cm. No P fertilization within the stand has occurred.
2.2. Field Design
In a similar manner to the field design in Stutz et al. [13], we selected one skid trail parallel to the slope that was as homogeneous of the stand as possible—predominantly and evenly distributed spruce with minimal boundary effects—and as representative of the thinning regime and residue dynamics as possible—not orthogonally sloped with even coverage of brash mat debris and vegetation (mosses and blackberry [Rubus sp.]). A 0.20 ha encatchment centered on the selected skid trail constituted the sampling area (20 by 100 m), of which 22.5% consisted of the skid trail.
Four transects crossed the selected skid trail representing the variation in brash mat coverage, with each transect extending ten meters from the center on both sides. To compare samples by the same degree of disturbance, each transect was stratified into five categories adjusted after Schaeffer et al. [11] and Stutz et al. [13] as depicted in Figure 1: “Center Bulge”, “Wheel Track”, “Side Bulge”, “Edge of Stand”, and “Stand” (as control). As in both of the previous studies, the degree of disturbance was assumed to be equivalent within each stratum on both sides of the skid trail.
2.2.1. Biomass
As in Stutz et al. [13], thinned biomass and nutrients for the four thinnings before 2015 were estimated from an inventory of 193 stumps and direct sampling of 11, freshly felled spruces. The modifications to account for the four thinnings are clarified here.
First, stumps were categorized into three classes based on degree of decomposition, and had their diameter measured at 15 cm (Table 1). Crucially, their original diameter () for Classes 2 and 3 at time of thinning was reconstructed from their current diameter with Equation (1):
where is diameter in 2015, n is the duration of decomposition (5.5 years for Class 2, 15 years for Class 3), and p is the rate of volume loss—2.4% per year [18]. Second, height, stump diameter, and diameter at breast height (Dbh, 1.3 m) from 10 standing spruces as well as both the diameters at 0.15, 0.5, 1, 1.3, 3 m, and subsequently every 2 m, and the height of the 11 felled spruces were measured to fit regression functions for Dbh and tree height from stump diameter; additional data for spruce in the federal state of Baden-Württemberg were used to cover Dbh <25 cm. From the reconstructed stump diameters, Dbh and height at time of thinning were calculated, and the volume and biomass of the harvested trees were then calculated from additive compartment biomass functions [19].
A range of biomass samples were taken from the 11 felled spruces to match nutrient concentrations with the reconstructed thinned biomass as in Stutz et al. [13]. Briefly, the number of branches and base diameters were recorded for every second whorl with a sample branch taken for laboratory analysis; 4–6 stem rounds every 4–5 m along the stem were taken as well. In total, five biomass compartments were defined: (i) “stem wood”, (ii) “stem bark”, (iii) “branches mm” (wood and bark, both green and brown), (iv) “branches mm”, and (v) “needles”. These compartments were further differentiated based on stem location, resulting in 15 mixed samples for laboratory analysis: stem wood and bark from (i) “green crown” and (ii) “below green crown”; and branches (both size classes) and needles from (iii) “upper crown” (top to stem diameter cm), (iv) “green branches”, (v) “1st green whorl”, and (vi) “brown branches” (no needle sample for this location).
Before the 2015 thinning, orthogonal distances from the middle of the skid trail to 51 live spruces marked for felling as part of the thinning regime were measured by laser; 21 of the 51 were outside our smaller encatchment. Immediately after each spruce was felled by a dangle-head harvester in April 2015, the seventh whorl was removed from the crown. From the entire whorl along each main branch, the first, third, and fifth needle generations were taken for laboratory analysis.
2.2.2. Forest Floor and Mineral Soil
A week before the thinning in 2015, forest floor material was sampled from three 900 cm plots per stratum and transect cut with a saber saw (Bosch PSA 18 LI) as in Stutz et al. [13]; in total, 60 forest floor plots were sampled. At least one plot came from each side of the skid trail with the third being assigned randomly to one or the other (except for the center bulge). Sampling plots were placed at the center of each stratum and assumed to be independent of the other strata (‘X’s in Figure 1). Exact location of plots also attempted to capture representative litter and debris cover for each stratum. At the same sampling points after forest floor material was removed, intact soil cores were taken to a depth of 20 cm and divided into 0–5, 5–10, and 10–20 cm intervals; in total, 40 augured soil cores were removed and partitioned into 120 intervals. The length of each interval was adjusted by −10–15% when dividing the soil cores to account for the reduction in length caused by inserting the soil auger.
2.3. Laboratory Analyses
Laboratory procedures followed those outlined in Stutz et al. [13] with some minor adjustments and additional measurements. The 15 mixed-biomass samples were homogeneous mixtures (3–5 kg each in total) of the biomass fractions from each spruce (n = 11) dried at 40 C, weighed, milled with a garden shredder, and subsampled based on their original mass. Each generation of needles per spruce (n = 153) was also dried at 40 C and removed from their branches. The forest floor samples (n = 60) were divided into branches mm, branches mm, “Oi + Oe”, “Oa”, and “fine roots” (<2 mm), and prepared in the same manner as the biomass samples, albeit individually.Each soil interval (n = 120) was also dried at 40 C and separated by sieving into “fine earth” (<2 mm), “debris”, and fine roots. Bulk mass and density of the forest floor and mineral soil samples were measured through drying the whole fraction or aliquots thereof at 105 C .
As in Stutz et al. [13], aliquots of every biomass sample, needle generation, forest floor fraction, and soil interval were further milled to a fine powder, dried (60 C for biomass fractions; 105 C for all others), and microwave-digested with 65% HNO3 and H2O2 for total Ca, K, Mg, P, Al, and Fe concentrations [20]. Available cations (i.e., exchangeable cations) from mineral soil samples mixed by strata within each transect (n = 60) were exchanged with NH4Cl ([21], A3.2.1.1), and available P from each individual soil depth interval (n = 120) was extracted with 1% by mass citric acid ([21], A3.2.3.4). Total carbon was also measured for forest floor fractions and fine earth by dry combustion at 1150 C. Analytic equipment is listed in the appendix.
2.4. Calculations
2.4.1. Biomass and Nutrient Redistribution
For each thinning, nutrient redistribution between removal, stand, and skid trail was modeled in the same manner as in Stutz et al. [13]. Briefly described, merchantable and non-merchantable assortments were defined by minimum–maximum lengths and minimum lopping diameter. The merchantable assortment of stem wood and bark were assumed to be removed. The remaining non-merchantable assortment (i.e., residues) was assumed to be deposited on the skid trail except for stumps and 5% of crown residues such as broken crowns, chipped bark, and needles knocked off during felling (i.e., no stem wood) that were left in the stand.
The nutrient quantities (g) of the harvested assortments were calculated from mean nutrient concentrations (mg g) of the sampled biomass fractions and the proportion of the harvested assortments constituted by each biomass fraction. The redistribution of nutrients was thus determined from the proportions of harvested biomass that were removed, left in the stand, and deposited on the skid trail. Calculated nutrient stocks (g m) were based on the surface area of the studied encatchment (2000 m) and skid trail (450 m with a mean width of 4.5 m).
2.4.2. Forest Floor and Mineral Soil
Forest floor nutrient stocks were calculated as concentration by area (, g m) from each litter fraction with Equation (2) as modified from Stutz et al. [13]:
where is the concentration by mass for x nutrient, and is each litter fraction’s dry mass by area.
Likewise, soil nutrient stocks were standardized to concentration by area and depth (, g m cm) with Equation (3):
where is x nutrient concentration by mass, is mass by volume (i.e., bulk density), and V is volume. Mineral Soil stocks were calculated to a depth of 20 cm (200 L or 0.2 m). Standard error of the mean (SE) for each nutrient stock represents the degree of variation and certainty.
2.4.3. Compaction and Roots
Physical soil compaction was measured through bulk densities of each soil interval (mass at 105 C divided by the respective volume of the soil auger). The effect of compaction on soil nutrient dynamics was evaluated through fine root densities of each soil interval calculated in the same manner as bulk density.
2.5. Statistics
Differences for nutrient stocks, nutrient availability, bulk mass/density, carbon stocks, and root density between strata were tested for significance using Dunn’s multiple comparison test (“dunn.test” package [22]). Relations between needle nutrient concentrations and distance from skid trail were tested with linear mixed effects (LME) models with needle generation set as a random factor. Linear regressions suggested correlations between nutrient stocks and other parameters; independent observations, normal distributions, and equal variance necessary for linear models were assumed. Statistics and calculations were done with R statistics ([23], ver. 3.3.2).
3. Results
3.1. Biomass and Nutrient Redistribution
Through four thinnings preceding 2015, 187.7 Mg ha of biomass was harvested containing 472.0 kg ha of Ca, 219.2 kg ha of K, 56.4 kg ha of Mg, and 81.7 kg ha of P (Table 2). The majority of harvested biomass and cationic nutrients was in stem wood and bark, whereas the majority of harvested P was in branches and needles.
As such, an estimated 34.9–44.3% of harvested base cations and 60.8% of harvested P were deposited on the skid trail in 16.1% of harvested biomass (Table 2). In comparison, 51.5–61.0% of harvested base cations and 34.9% of harvested P were exported in 80.1% of harvested biomass (Table 2). Since 22.5% of the studied encatchment constituted the skid trail, the resulting quantities of Ca, K, Mg, and P added to skid trails in harvest residues would have been 73.3, 43.2, 10.3, and 11.3 g m, respectively, in 13.4 kg m of biomass (not including pre-harvest nutrient stocks; Table 2).
3.2. Total Nutrient Stocks
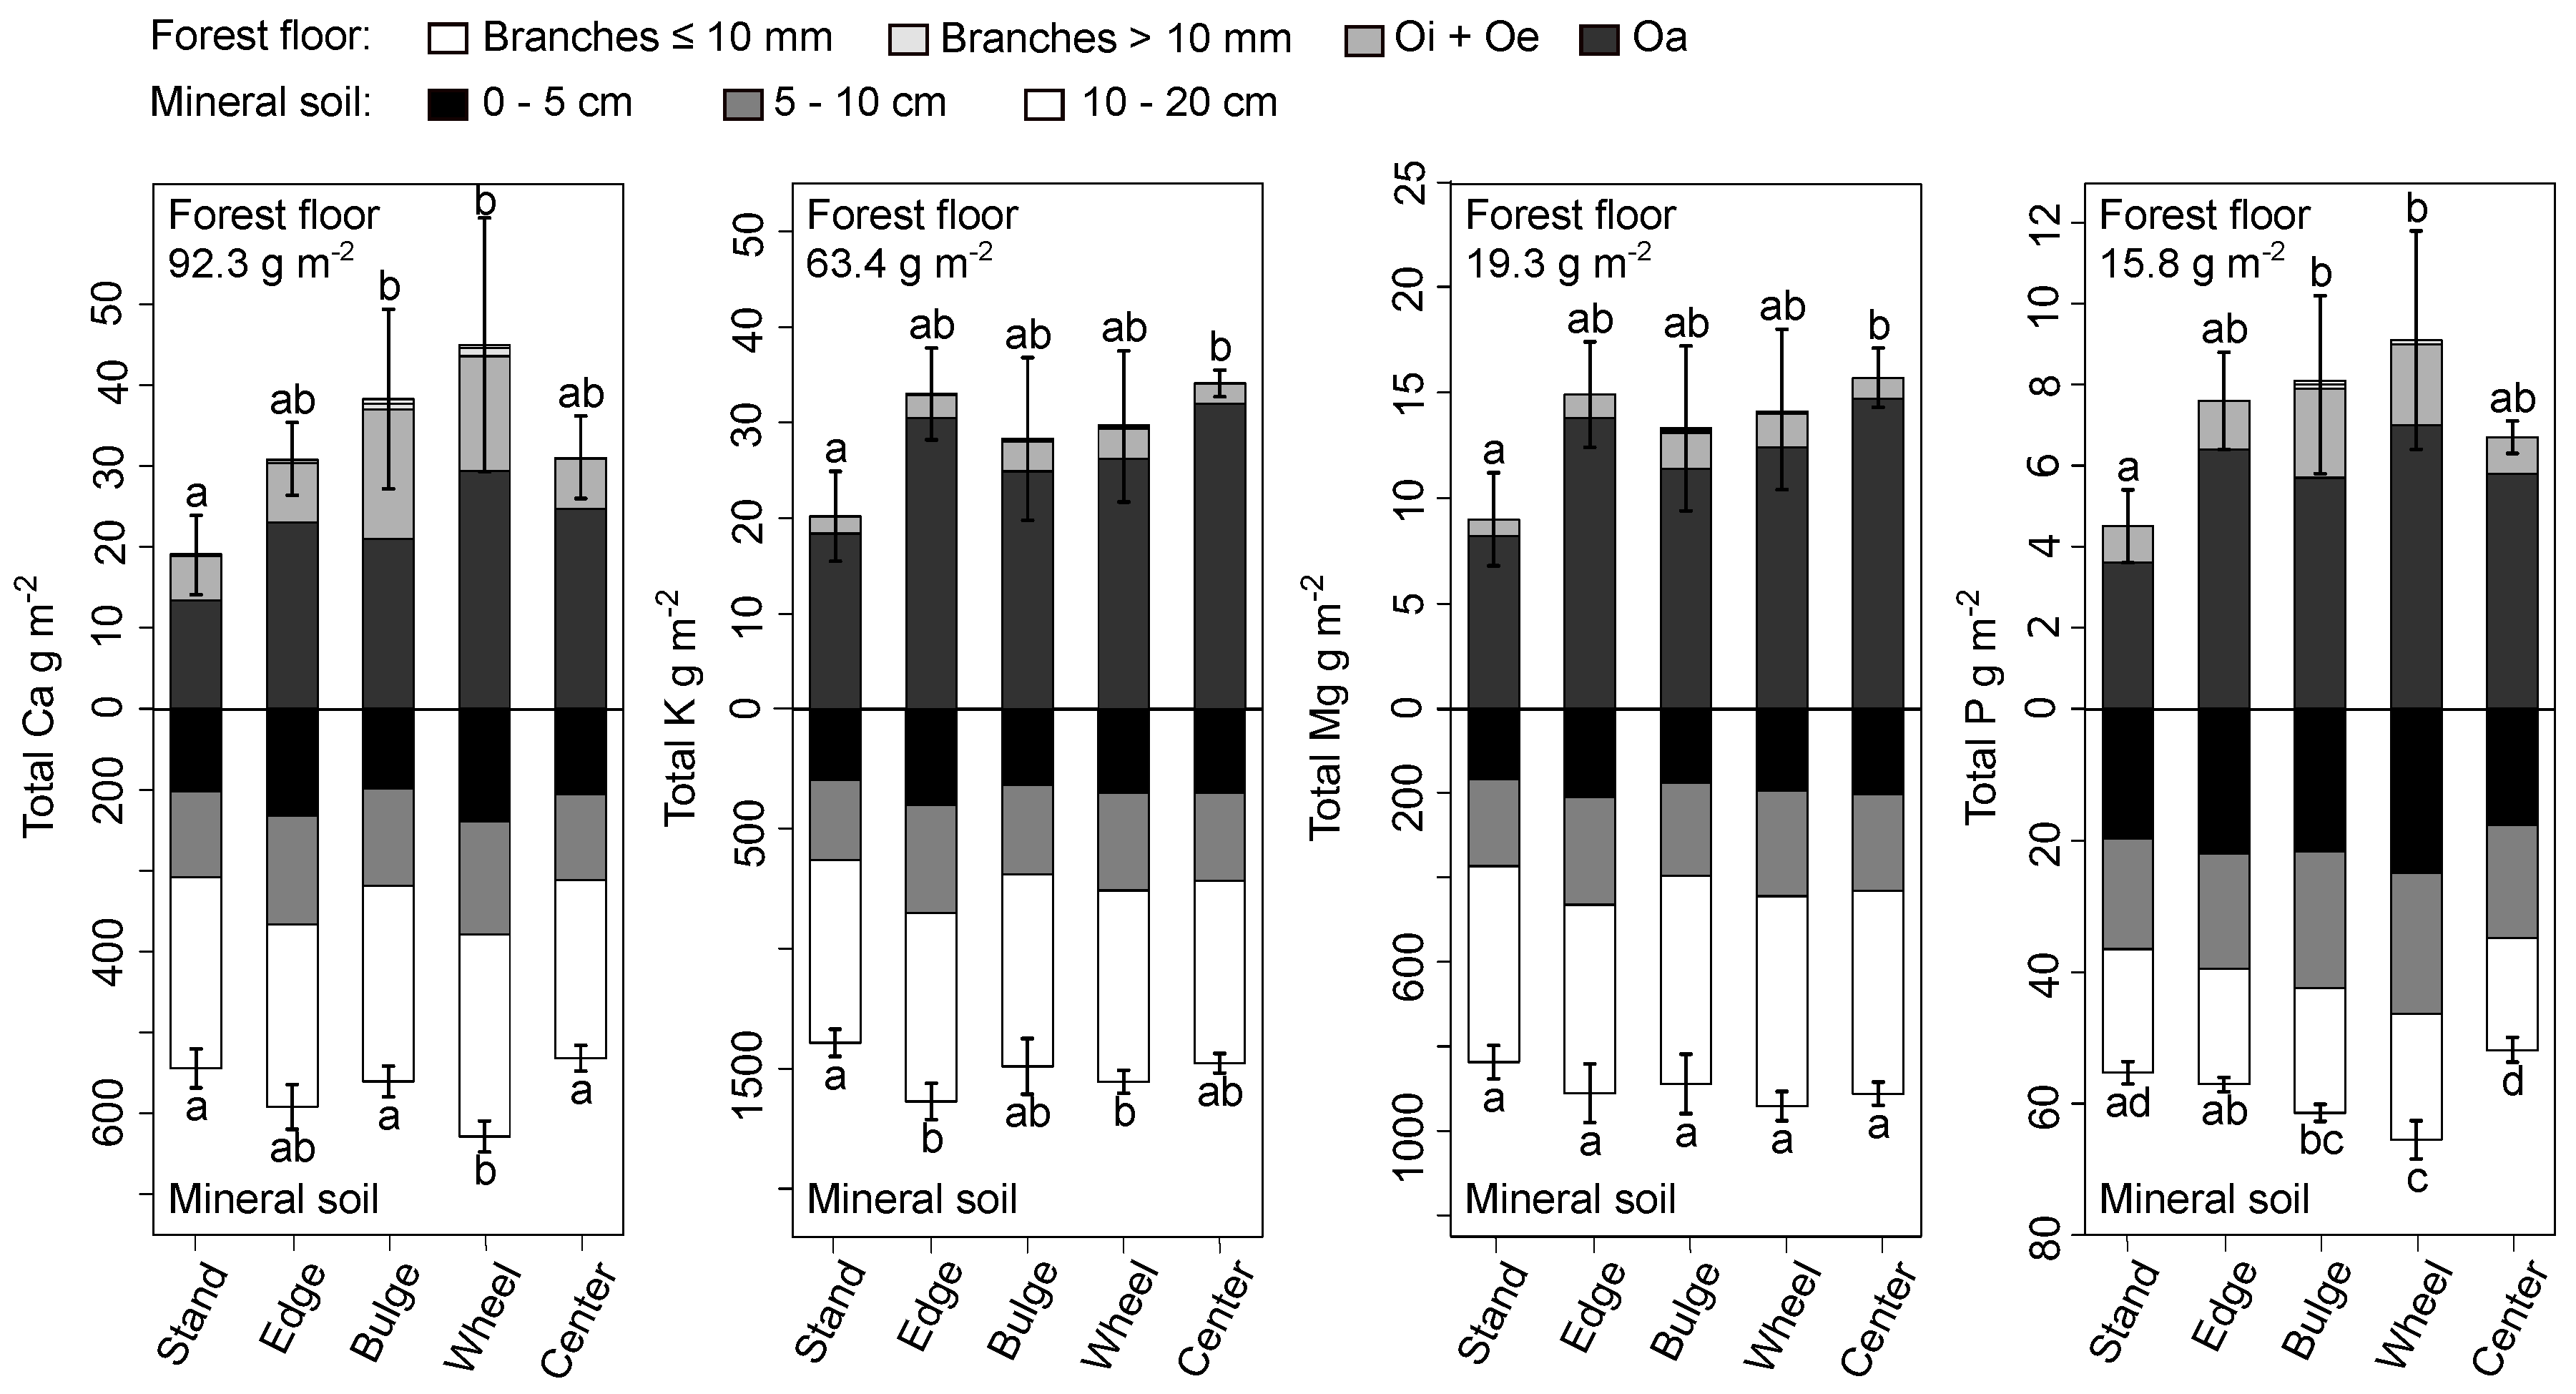
After the four thinnings and the associated deposition of harvest residues and nutrients, at most 35%, 32%, 65%, and 41% of added Ca, K, Mg, and P, respectively, remained on the skid trail within forest floor stocks (Figure 2, top half). When subtracted from the quantities deposited as harvest residues, 46.3, 29.6, 3.6, and 6.7 g m of added Ca, K, Mg, and P, respectively, were missing from the brash mat. Despite such reductions in nutrient stocks, forest floor Ca and P stocks of side bulge and wheel track strata still differed significantly from stand stocks, while K and Mg stocks of the center bulge stratum in the forest floor differed significantly from stand stocks (Figure 2, top half).
Mineral soil Ca, K, and P stocks in the wheel track stratum were likewise significantly higher than those of the stand (Figure 2, bottom half). At most, skid trail Ca, K, Mg, and P stocks were respectively 84.0, 163, 104, and 10.2 g m larger than the stand’s stocks. In each case, those differences were greater than the balance in stocks missing from the overlying brash mat. Soil nutrient stocks also did not follow any single pattern: Mg stocks in skid trail strata did not differ significantly from stand stocks, Ca and K only partially differed from stand stocks, and P stocks were noticeably concentrated in skid trail strata with the exception of the center bulge.
3.3. Available Nutrient Stocks
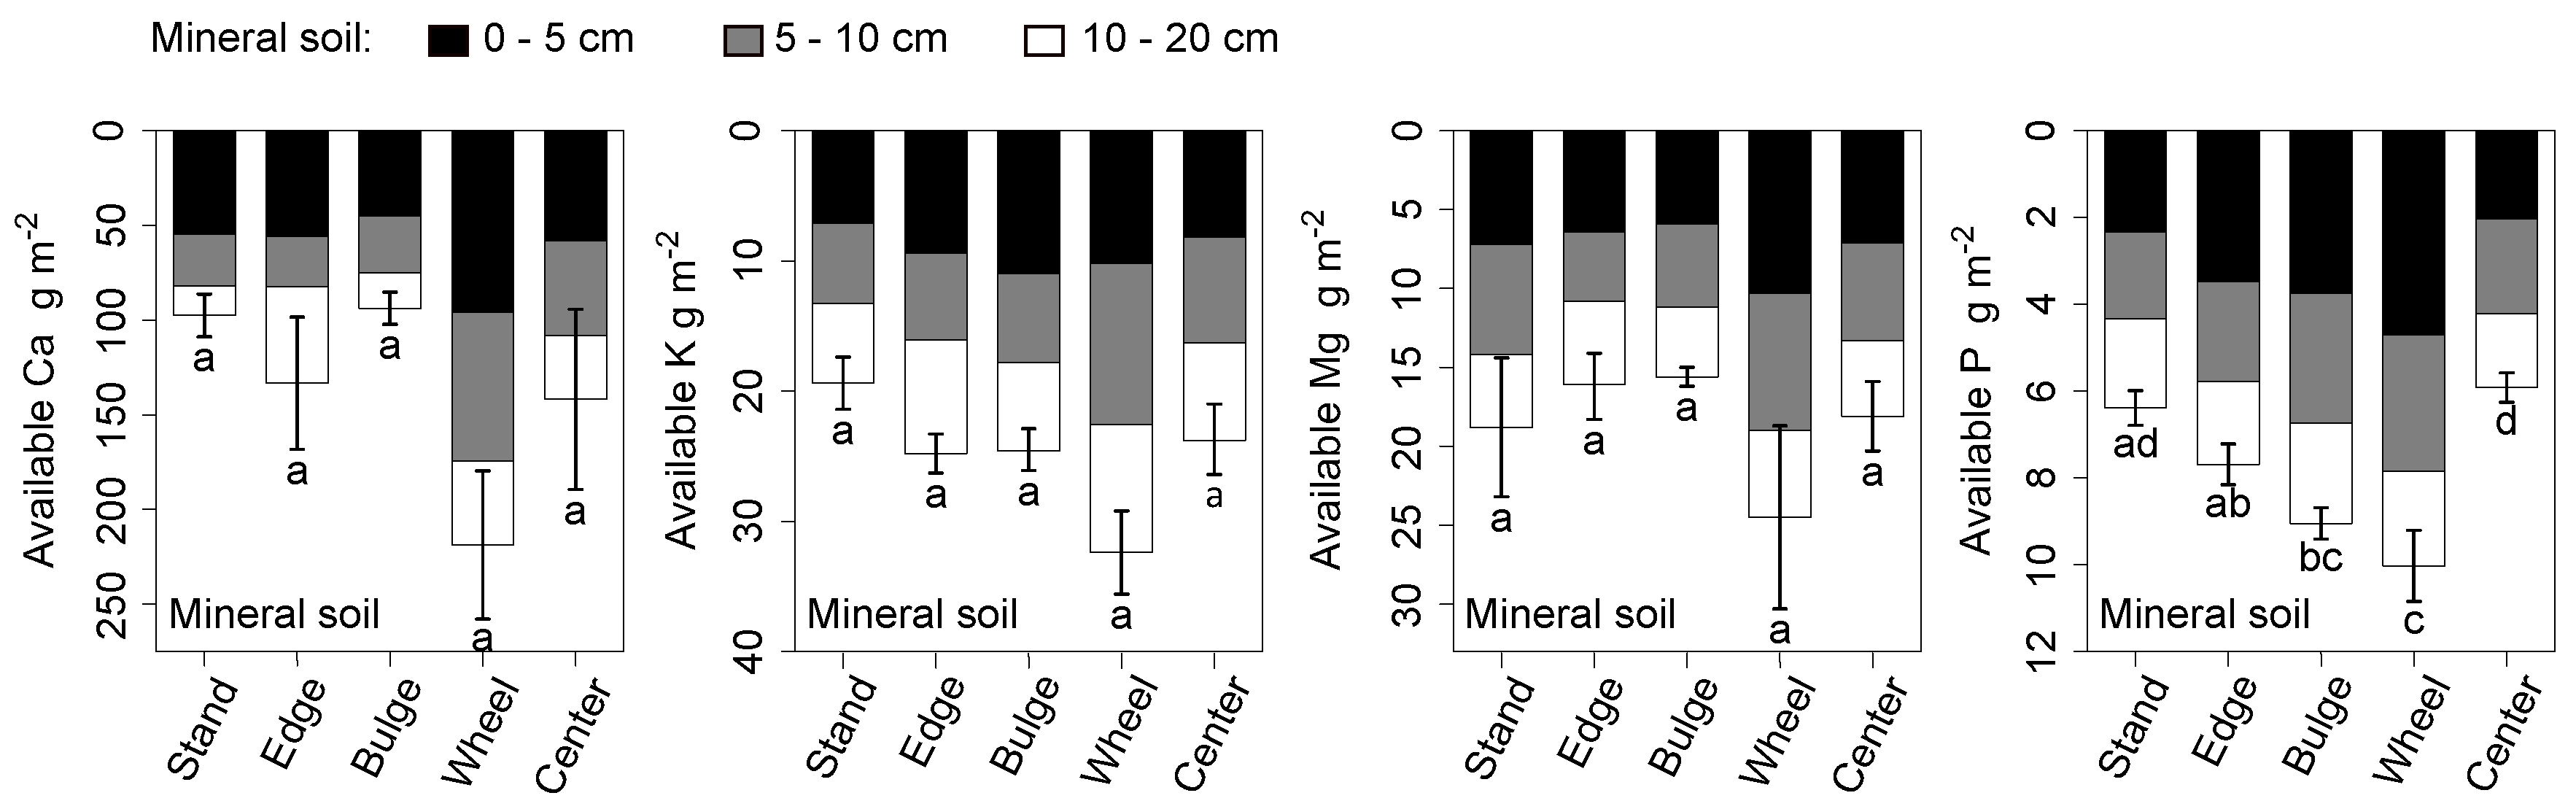
Correspondingly, available P stocks in most of the skid trail were significantly higher than those of the stand (Figure 3). Signs of higher stocks of exchangeable base cations in the skid trail were also present, but individually each stock did not differ significantly from those in the stand (Figure 3).
3.4. Forest Floor and Mineral Soil Properties
The absolute root density in the skid trail did not differ significantly from those of the stand (Table 3). In a similar manner, bulk mass of each forest floor fraction on the skid trail did not differ significantly from those of the stand resulting from high heterogeneity in brash mat coverage (Dunn’s test, p > 0.1; Figure 4, upper left). However, the two lower soil depth intervals were slightly compacted compared to the stand (Figure 4, bottom left). The skid trail strata also had more C in the Oa fraction compared to the stand (Figure 4, upper right) while soil carbon stocks in contrast declined across the skid trail (Figure 4, bottom right).
In the mineral soil, total nutrient densities by volume had inconsistent linear regressions with bulk and C densities (Table 4): total base cations were positively correlated with bulk density and negatively correlated with C density, while total P did not correlate at all with bulk density and positively correlated with C density. In contrast, available mineral soil nutrients stocks were all weakly and negatively correlated with bulk density, and all positively correlated with C density (Table 4). Additionally, total P correlated positively with total Ca (density by volume, , adj. , ), but not with K, Mg, Al, or Fe (). When soil C was included along with total Ca, the model’s improved substantially (density by volume, , adj. , ); there was no significant interaction between the two regressors.
3.5. Needle Nutrient Concentrations
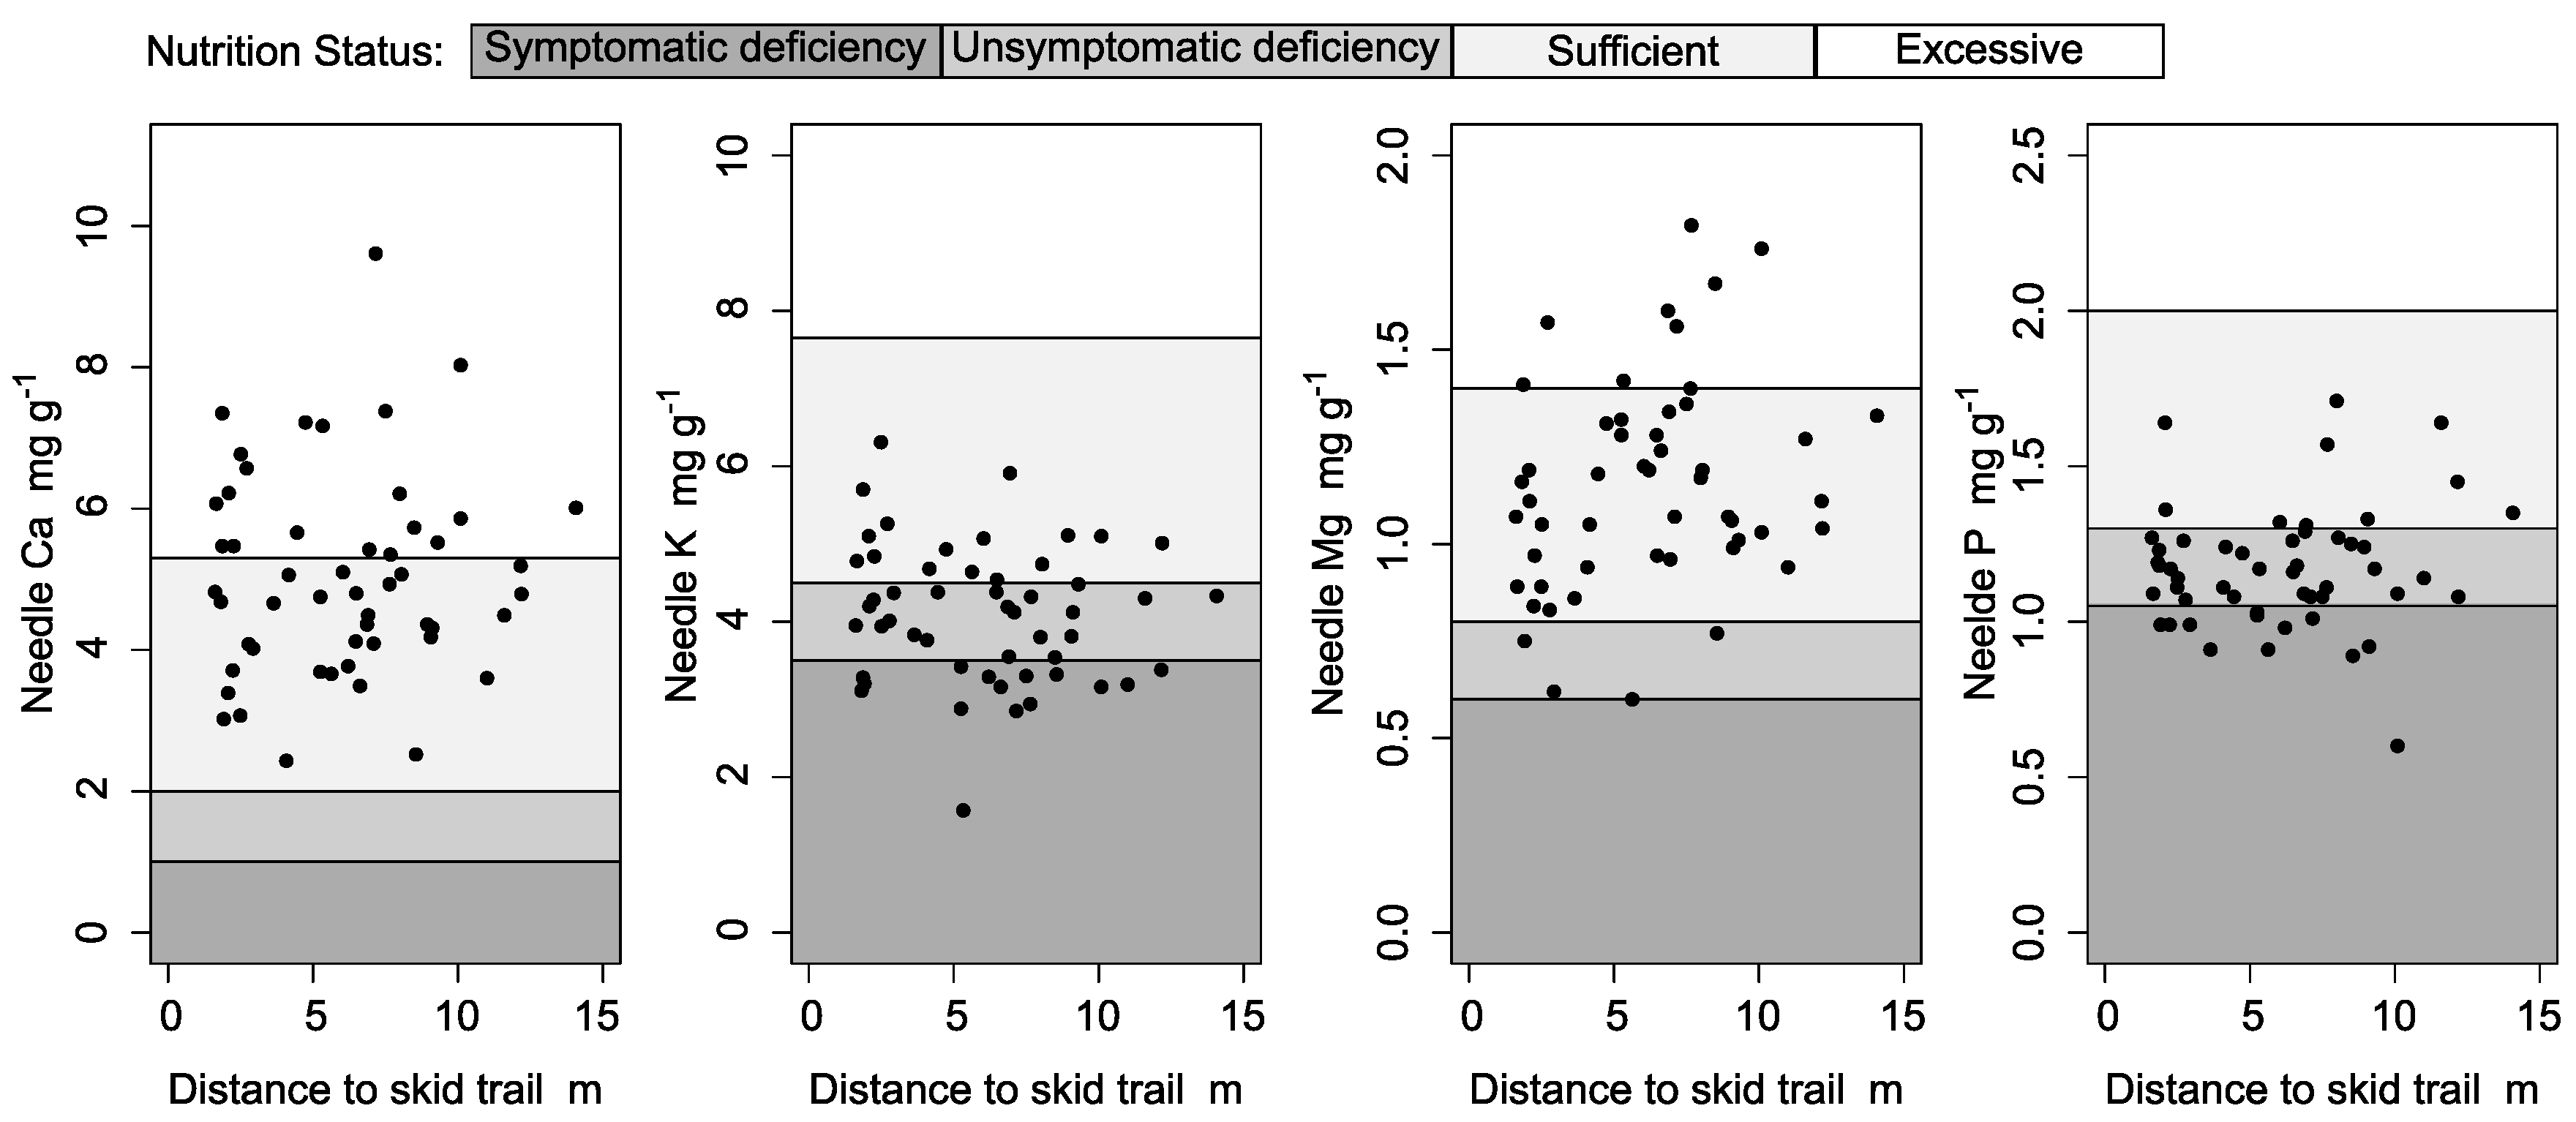
Despite accumulated total and partially available Ca, K, Mg, and P on and in the skid trail along with even rooting, nutrient concentrations within first, third, and fifth generation needles were not significantly higher when closer to the skid trail (LME models, p > 0.1; Figure 5, third and fifth generations not plotted). Additionally, Ca and Mg nutrition were “sufficient” or “excessive” while K and P nutrition were “unsymptomatically deficient” for Central European forests according to Göttlein [24].
4. Discussion
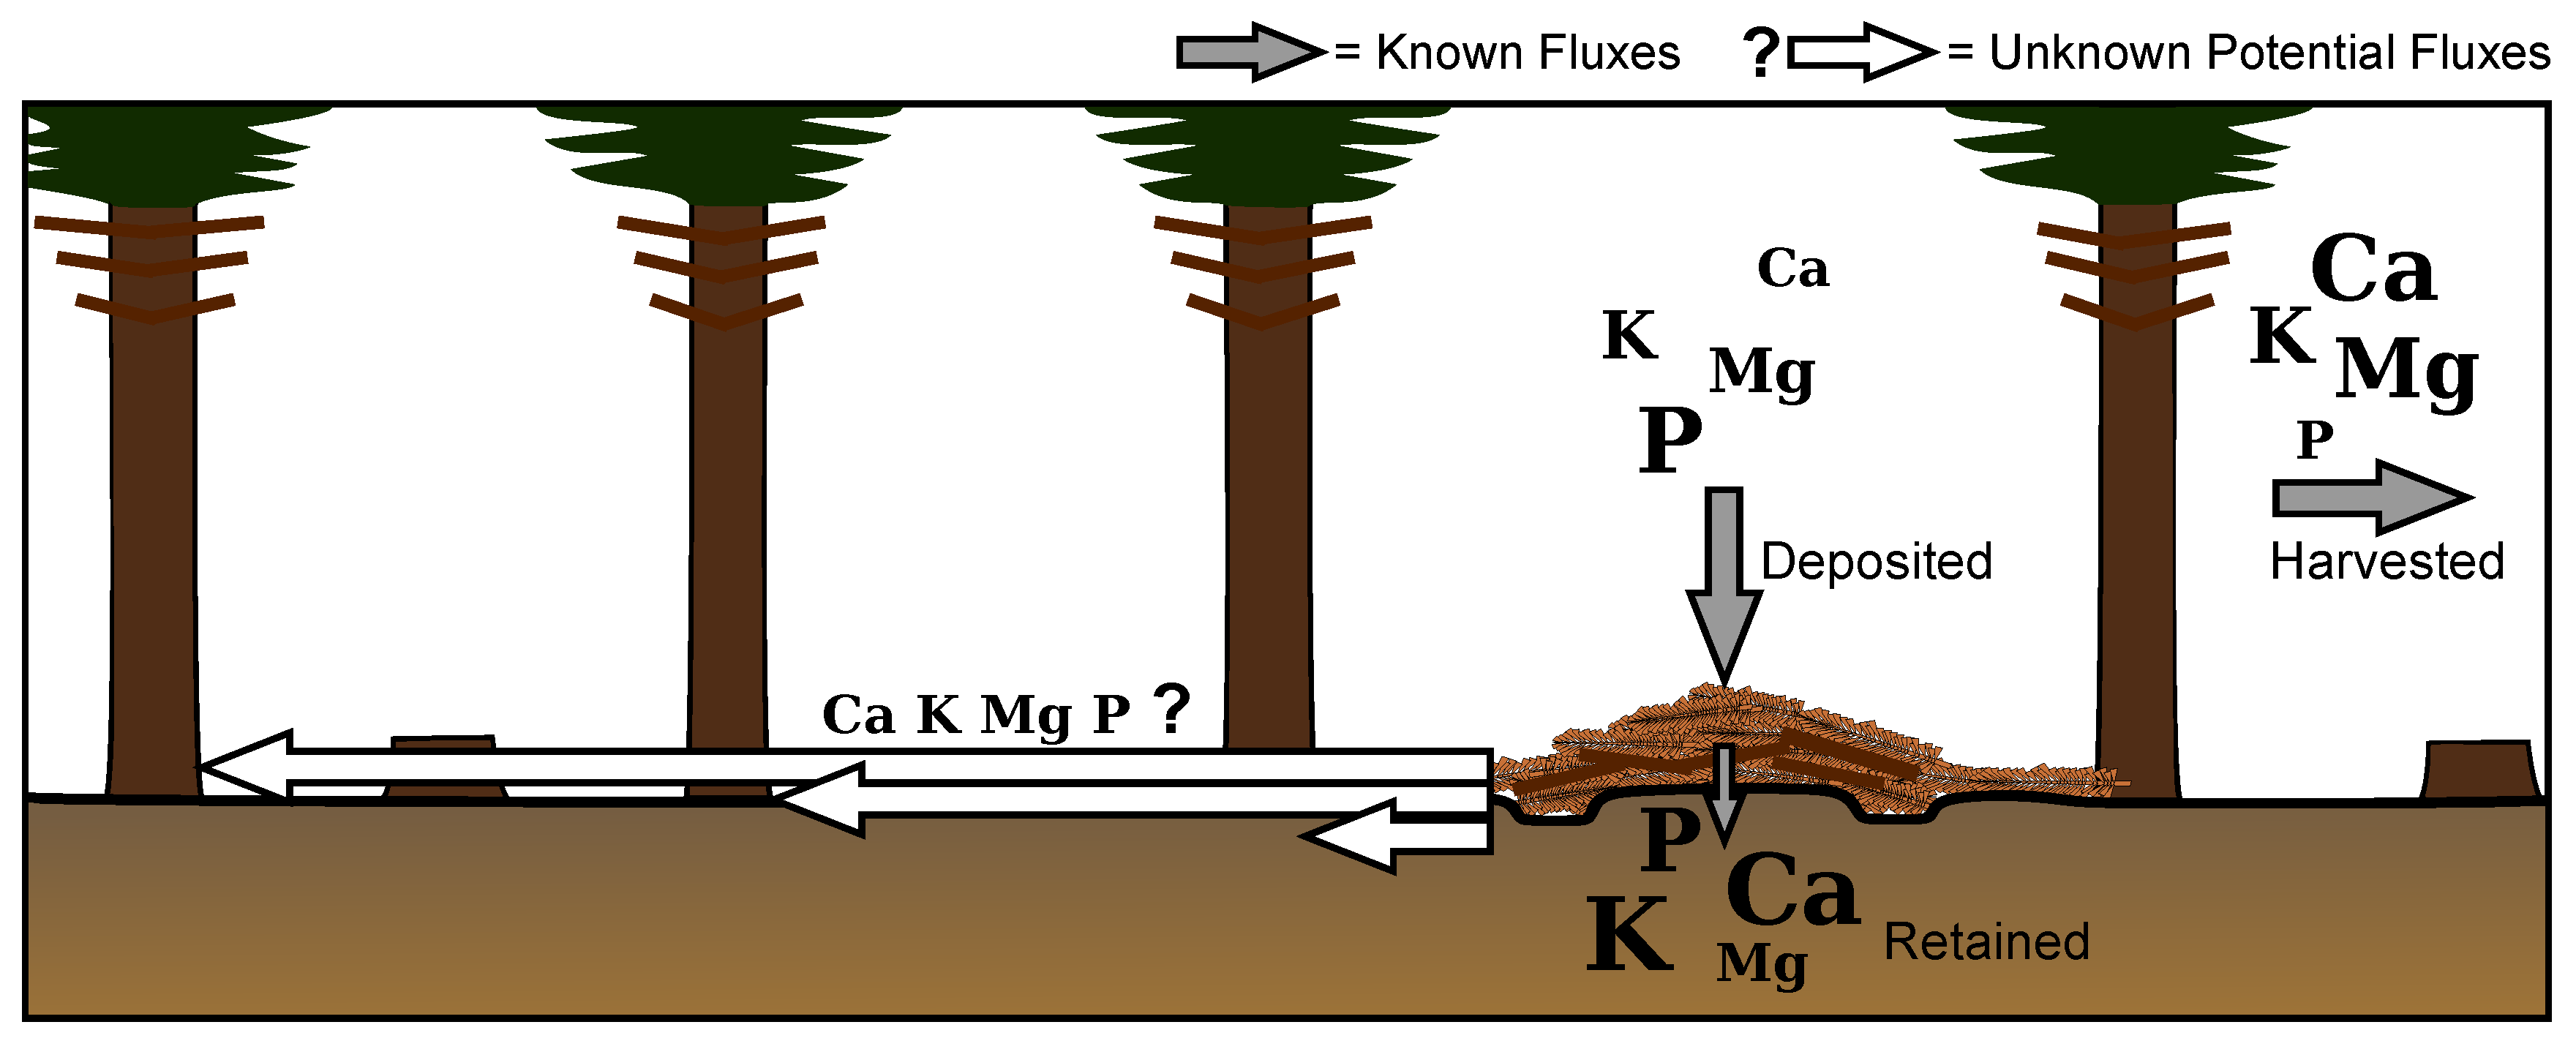
In summary, from the total harvested biomass 50–60% of base cations and 35% of P were exported from the forest while 35–45% of base cations and 60% of P were deposited on the skid trail (Figure 6). Of those inputs, 32–65% remained in partially decomposed harvest residues on the skid trail. The remaining 35–68% were accounted for in the total nutrient stocks of the skid trail’s mineral soil to a depth of 20 cm, thus implying that base cations and P were transported into mineral soil most likely through leaching given the luvic nature of the soil.
These results consequently indicate that nutrients on the skid trail were, in most cases, not taken up by adjacent or skid trail vegetation. This contradicts Stutz et al. [13] and partially Borchert et al. [14]. It should be noted that our estimation of biomass and nutrient redistribution includes multiple sources of error ranging from the use of 2015 biomass samples to calculate past nutrient loads in thinned biomass to the 5% of residues assumed to be left in the stand. Yet for each nutrient, skid trail stocks from the forest floor and mineral soil in total exceeded the estimated quantities redistributed to the skid trail through the four thinnings. This would result from either an underestimation on our part or, more likely, additional accumulation of nutrients within skid trail brash mats and underlying soil by decomposing organisms, especially through the decay of fine and coarse woody debris [25]. Still, two possible explanations for the stand not recycling accumulated nutrients back into biomass are as follows:
- Accumulated nutrients were not needed due to sufficient nutrition.
- Accumulated nutrients were not available either physically or chemically.
The continued presence of accumulated nutrients on and in the skid trail could be due to an abundance of nutrients and consequently sufficient stand nutrition (Explanation 1). That needle Ca and Mg concentrations were either “sufficient” or “excessive” according to Göttlein [24]—most likely due to liming in 2003—in part supports this explanation. Yet the “unsymptomatically deficient” needle K and P concentrations [24] indicate that K and P would be needed by the surrounding stand, meaning this explanation is partially incorrect. This is additionally confounding given that the quantities of nutrients deposited on the skid trail if scaled to the stand level—733, 432, 103, and 113 kg ha of Ca, K, Mg, and P, respectively—are comparable to quantities applied as fertilizer in other studies and other stands [26,27].
Fertilization does not always result in nutrient uptake and increased productivity if the added nutrients are not physically or chemically accessible (Explanation 2). Physical inaccessibility is a distinct possibility due to the potential of soil compaction to degrade rooting and aeration through machine traffic on skid trails, especially when done under sensitive conditions [12]. Likewise, chemical immobilization of P within acidic forest soils would restrict its availability.
However, compaction in the skid trail was minimal as indicated by few to no significant differences in soil bulk densities between the stand and skid trail strata. In fact, the skid trail quickly recovered from compaction, as evident from skid trail fine root densities not being significantly less than those of the stand. The rooting structure of spruce—shallow and widespread with potential grafting between individuals—would also facilitate the redistribution of accumulated nutrients throughout the entire forest (Figure 6), which would result in limited or no correlation between needle nutrient concentration and distance from the skid trail. Chemical inaccessibility was also not evident due to increased citric acid-extractable P stocks in the side bulge and wheel track strata. This is in accordance with another study where more citric acid-extractable P was found in skid trail wheel tracks compared to surrounding stands 5–30 years after last thinning [28].
Despite K and P being available according to standard measures of compaction, rooting, and chemical availability, they still remained in the skid trail. This implies that other processes must have restricted the availability of both nutrients, especially P. Two joint dynamics are explained below, which constitute new hypotheses to be tested.
First, P that accumulated in the skid trail’s soil would have been washed out of the overlying brash mat in both inorganic and organic forms released by microbial decomposition. Both forms are highly susceptible to mineral immobilization—organic phosphates more so than inorganic [29,30]—primarily with Fe and Al hydroxides in acidic soils [31]. Yet the lack of significant regressions between total P and either Fe or Al would imply that those species of metal hydroxyl phosphates did not exist despite the soil’s acidity. Instead, amorphous inorganic and organic Ca phosphates would have been the most likely species given the significant regression between total P, C, and Ca. The existence of amorphous Ca phosphates in an acidic soil is unusual yet possible, especially with organic phytic acids when Ca is available [32,33] and in excess as would have been the result of liming in 2003; hydroxylapatite formed from weathered calcite in the lime and orthophosphate would have also been possible [34]. Once precipitated, Ca phosphates are typically inaccessible to plants until released by carboxylic acids, of which oxalic and citric acids are the most effective [35]. Yet such carboxylic acids would have been acutely susceptible to microbial uptake and mineralization [35,36], especially when conditions—i.e., higher pH and more nutrients due to liming—would have stimulated microbial growth in the forest floor [37]. That roughly 70% of added biomass was lost over twenty years despite the low background level of litter decomposition would imply that such organic acids could not access accumulated Ca phosphates.
A second dynamic would compound such inaccessibility of P: frequent thinning (every 4–7 years) and liming would disrupt the reestablishment of P recycling systems. In nutrient poor sites such as this stand, recycling systems involving organic P retained within the forest floor are hypothesized to be crucial to adequate forest P nutrition [38], often involving mycorrhiza through greater litter occupation and P mobilization [39]. Yet ectomycorrhiza, the type associated with Norway spruce, greatly diminish in abundance following soil disturbances [40]. Also, as ectomycorrhiza stands have more labile organic P accessible with phosphatases in comparison to arbuscular mycorrhiza stands [41], complexation of both organic and inorganic Ca phosphates in the skid trail and surrounding stand would have restricted the usable supply of P [29]. Additionally, liming with Ca would have induced P to leach from the forest floor into mineral soil [37]—especially on Luvisols—either as non-complexed, dissolved phosphate or already as Ca phosphate, which would have decoupled P recycling systems within the forest floor.
Still, base cations and P deposited on the skid trail were retained in the stand rather than exported in harvested biomass just as in Stutz et al. [13] and Borchert et al. [14]. Those stocks, especially for P, may be currently unavailable due to unbalanced nutrient loads and continued thinning, but most likely for only as long as such imbalances and disturbances continue. Soil aeration and bulk density of skid trails can recover within decades after last use [42] with subsequent rebalancing of citric-acid extractable orthophosphate and organic P [28]. Tight recycling systems of P within the forest floor can also reestablish and sustain forest productivity. With a mean annual growth increment of 15.4 m ha year estimated by the local forestry office [16], the stand has been growing at a sufficient rate for the region and species. Different harvesting conditions though, especially on wetter or more finely textured soils, would likely restrict soil regeneration by physically impeding root and mycorrhizal regrowth for longer periods of time. Further research and monitoring would be needed to confirm our hypothetical explanation and test whether forest nutrient cycles under similar conditions will eventually reincorporate nutrients deposited on skid trails. For instance, experiments with either elemental or isotopic tracers could mark the path of accumulated nutrients from the brash mat into soil and possibly into the surrounding stand.
5. Conclusions
Through four thinnings of a 50-year-old Norway spruce stand on a Luvisol, the majority of base cations and one-third of P in harvested biomass were exported. The remaining base cations and two-thirds of P were deposited on the skid trail. Nineteen years after the first thinning, one- to two-thirds of the added nutrients remained in partially decomposed harvest residues on the skid trail with the alternate portions being accounted for in total soil stocks to a depth of 20 cm. Significantly more soil P was also plant available in the skid trail than in the surrounding stand despite minimal compaction and adequate rooting. Needle Ca and Mg nutrition was adequate, but not for K and P.
In conclusion, these results indicate that harvest residue nutrients can accumulate in skid trails in plant-available forms according to standard analytic methods, yet remain unused. Excess Ca from liming would have increased mineralization of harvest residues, bonded with released P, and induced P to leach into underlying mineral soil, thus disconnecting P recycling systems. Frequent thinning would have also disrupted ectomycorrhizal networks necessary for nutrient uptake by Norway spruce. Accumulated nutrients could eventually be available once the stand and skid trail are allowed to recover. Consequently, foresters should adapt liming, thinning frequency, and residue management to levels that can be sustained by site-specific nutrient cycles.
Acknowledgments
We sincerely thank Daniel Dann, Felix Hugo, and Clara Wild for their field and laboratory work; and Petra Grossman, Renate Nitschke, Christian Vonderach, and Petra Wiedemer for their technical expertise. We also thank Bernadette Jochum, ForstBW, and the municipality of Riedlingen for assistance in finding, accessing, and sampling the study site. We thank as well the two anonymous reviewers for their useful comments. Both the University of Freiburg’s Gesellschaft zur Förderung der forst- und holzwirtschaftlichen Forschung and the Ministerium für Ländlichen Raum und Verbraucherschutz Baden-Württemberg funded this study.
Author Contributions
H. Schack-Kirchner, G. Kändler, and F. Lang conceived and designed the experiments; K.P. Stutz, H. Schack-Kirchner, L. Landes, M. Linz, and H. Warlo performed the field experiments; L. Landes, M. Linz, and H. Warlo performed the laboratory experiments; K.P. Stutz, G. Kändler, L. Landes, M. Linz, and H. Warlo analyzed the data; and K.P. Stutz and H. Schack-Kirchner wrote the paper.
Conflicts of Interest
The authors declare no conflict of interest. The funding sponsors had no role in the design of the study; in the collection, analyses, or interpretation of data; in the writing of the manuscript, and in the decision to publish the results.
Abbreviations
The following abbreviations are used in this manuscript:
| dGZ | Greman measure for mean total growth after 100 years (“durchsnittlicher Gesamtzuwachs im Alter 100”) |
| Br. >10 | Branches > 10 mm in diameter |
| Br. ≤10 | Branches ≤ 10 mm in diameter |
| LME models | Linear mixed effects models |
Appendix A. Equipment
Equipment for laboratory analyses: total and plant available nutrient concentrations, Spectro Ciros CCD ICP Side-on Plasma Optical Emission Spectrometer (Kleve, Germany); total carbon, Elementar Vario EL Cube (Langenselbold, Germany).
References
- McDonald, T.P.; Seixas, F. Effect of slash on forwarder soil compaction. J. For. Eng. 1997, 8, 15–26. [Google Scholar]
- Han, H.S.; Page-Dumroese, D.; Han, S.K.; Tirocke, J. Effects of slash, machine passes, and soil moisture on penetration resistance in a cut-to-length harvesting. Int. J. For. Eng. 2006, 17, 11–24. [Google Scholar]
- Von Wilpert, K.; Schäffer, J. Ecological effects of soil compaction and initial recovery dynamics: A preliminary study. Eur. J. For. Res. 2006, 125, 129–138. [Google Scholar] [CrossRef]
- Contreras, M.A.; Parrott, D.L.; Chung, W. Designing skid-trail networks to reduce skidding cost and soil disturbance for ground-based timber harvesting operations. For. Sci. 2016, 62, 48–58. [Google Scholar] [CrossRef]
- Achat, D.L.; Deleuze, C.; Landmann, G.; Pousse, N.; Ranger, J.; Augusto, L. Quantifying consequences of removing harvesting residues on forest soils and tree growth—A meta-analysis. For. Ecol. Manag. 2015, 348, 124–141. [Google Scholar] [CrossRef]
- Palviainen, M.; Finér, L. Estimation of nutrient removals in stem-only and whole-tree harvesting of Scots pine, Norway spruce, and birch stands with generalized nutrient equations. Eur. J. For. Res. 2012, 131, 945–964. [Google Scholar] [CrossRef]
- Thiffault, E.; Hannam, K.D.; Paré, D.; Titus, B.D.; Hazlett, P.W.; Maynard, D.G.; Brais, S. Effects of forest biomass harvesting on soil productivity in boreal and temperate forests—A review. Environ. Rev. 2011, 19, 278–309. [Google Scholar] [CrossRef]
- Morris, L.A.; Pritchett, W.L.; Swindel, B.F. Displacement of nutrients into windrows during site preparation of a flatwood forest. Soil Sci. Soc. Am. J. 1983, 47, 591–594. [Google Scholar] [CrossRef]
- Asam, Z.-Z.; Nieminen, M.; O’Driscoll, C.; O’Connor, M.; Sarkkola, S.; Kaila, A.; Sana, A.; Rodgers, M.; Zhan, X.; Xiao, L. Export of phosphorus and nitrogen from lodgepole pine (Pinus contorta) brash windrows on harvested blanket peat forests. Ecol. Eng. 2014, 64, 161–170. [Google Scholar] [CrossRef]
- McCavour, M.J.; Paré, D.; Messier, C.; Thiffault, N.; Thiffault, E. The role of aggregated forest harvest residue in soil fertility, plant growth, and pollination services. Soil Sci. Soc. Am. J. 2014, 78, S196–S207. [Google Scholar] [CrossRef]
- Schäffer, J.; von Wilpert, K.; Kublin, E. Analysis of fine rooting below skid trails using linear and generalized additive models. Can. J. For. Res. 2009, 39, 2047–2058. [Google Scholar] [CrossRef]
- Cambi, M.; Certini, G.; Neri, F.; Marchi, E. The impact of heavy traffic on forest soils: A review. For. Ecol. Manag. 2015, 338, 124–138. [Google Scholar] [CrossRef]
- Stutz, K.P.; Schack-Kirchner, H.; Kändler, G.; Lang, F. Phosphorus in accumulated harvest residues on skid trails. For. Ecol. Manag. 2015, 356, 136–143. [Google Scholar] [CrossRef]
- Borchert, H.; Huber, C.; Göttlein, A.; Kremer, J. Nutrient concentration on skid trails under brush-mats—Is a redistribution of nutrients possible? Croatian J. For. Eng. 2015, 36, 243–252. [Google Scholar]
- IUSS Working Group WRB. World Reference Base for Soil Resources 2014. International Soil Classification System for Naming Soils and Creating Legends for Soil Maps; Number 106 in World Soil Resources Reports; FAO: Rome, Italy, 2014. [Google Scholar]
- Jochum, B.; (Landratsamt Biberach, Pflummern, Germany, Kreisforstamt, Forstrevier Riedlingen). Personal communication, 2017.
- Landesforstverwaltung Baden-Württemberg. Hilfstabellen für die Forsteinrichtung; Ministerium für Ländlichen Raum, Ernährung, Landwirtschaft und Forsten Baden-Württemberg: Stuttgart, Germany, 1993. (In German) [Google Scholar]
- Harmon, M.E.; Krankina, O.N.; Sexton, J. Decomposition vectors: A new approach to estimating woody detritus decomposition dynamics. Can. J. For. Res. 2000, 30, 76–84. [Google Scholar] [CrossRef]
- Vonderach, C. Biomassefunktionen an BWI-Punkten. In Abschlussbericht Projekt “Energieholzernte und Stoffliche Nachhaltigkeit in Deutschland”; von Wilpert, K., Puhlmann, H., Eds.; Project Report; Unpublished project report; 2017. (In German) [Google Scholar]
- Bock, R. Aufschlußmethoden der Anorganischen und Organischen Chemie; Verlag Chemie Weinheim: Weinheim, Germany, 1972. (In German) [Google Scholar]
- Gutachterausschuss Forstliche Analytik. Handbuch Forstliche Analytik: Eine Loseblatt-Sammlung der Analysemethoden im Forstbereich, 5th ed.; Bundesministerium für Verbraucherschutz, Ernährung und Landwirtschaft: Bonn, Germany, 2014. (In German) [Google Scholar]
- Dinno, A. Dunn.test: Dunn’s Test of Multiple Comparisons Using Rank Sums, R package version 1.3.2. 2016.
- R Core Team. R: A Language and Environment for Statistical Computing; R Foundation for Statistical Computing: Vienna, Austria, 2016. [Google Scholar]
- Göttlein, A. Ranges of threshold values for the nutritional assessment of the main tree species spruce, pine, oak and beech. Allg. Forst Jagdztg. 2015, 186, 110–116, (In German, with English abstract). [Google Scholar]
- Stutz, K.P.; Lang, F. Potentials and unknowns in managing coarse woody debris for soil functioning. Forests 2017, 8, 37. [Google Scholar] [CrossRef]
- Spiecker, H. Liming, nitrogen and phosphorus fertilization and the annual volume increment of Norway spruce stands on long-term permanent plots in Southwestern Germany. Fertil. Res. 1990, 27, 87–93. [Google Scholar] [CrossRef]
- Fransson, A.M.; Bergkvist, B. Phosphorus ferilisation causes durable enhancement of phosphorus concentrations in forest soil. For. Ecol. Manag. 2000, 130, 69–76. [Google Scholar] [CrossRef]
- Ebeling, C.; Fründ, H.C.; Lang, F.; Gaertig, T. Evidence for increased P availability on wheel tracks 10 to 40 years after forest machinery traffic. Geoderma 2017, 297, 61–69. [Google Scholar] [CrossRef]
- Gerke, J. Phytate (Inositol Hexakisphosphate) in soil and phosphate acquisition from inositol phosphates by higher plants. A review. Plants 2015, 4, 253–266. [Google Scholar] [CrossRef] [PubMed]
- Prietzel, J.; Harrington, G.; Häusler, W.; Heister, K.; Werner, F.; Klysubun, W. Reference spectra of important adsorbed organic and inorganic phosphate binding forms for soil P speciation using synchrotron-based K-edge XANES spectroscopy. J. Synchrotron Radiat. 2016, 23, 532–544. [Google Scholar] [CrossRef] [PubMed]
- Prietzel, J.; Klysubun, W.; Werner, F. Speciation of phosphorus in temperate zone forest soils as assessed by combined wet-chemical fractionation and XANES spectroscopy. J. Plant Nutr. Soil Sci. 2016, 179, 168–185. [Google Scholar] [CrossRef]
- Graf, E. Calcium binding to phytic acid. J. Agric. Food Chem. 1983, 31, 851–855. [Google Scholar] [CrossRef]
- Celi, L.; Lamacchia, S.; Barberis, E. Interaction of inositol phosphate with calcite. Nutr. Cycl. Agroecosyst. 2000, 57, 271–277. [Google Scholar] [CrossRef]
- Amer, F.; Mahmoud, A.A.; Sabet, V. Zeta potential and surface area of calcium carbonate as related to phosphate sorption. Soil Sci. Soc. Am. J. 1985, 49, 1137–1142. [Google Scholar] [CrossRef]
- Gerke, J. The acquisition of phosphate by higher plants: Effect of carboxylate release by the roots. A critical review. J. Plant Nutr. Soil Sci. 2015, 178, 351–364. [Google Scholar] [CrossRef]
- Jones, D.L. Organic acids in the rhizosphere—A critical review. Plant Soil 1998, 205, 25–44. [Google Scholar] [CrossRef]
- Fiorentino, I.; Fahey, T.J.; Groffman, P.M.; Driscoll, C.T.; Eagar, C.; Siccama, T.G. Initial responses of phosphorus biogeochemistry to calcium addition in a nothern hardwood forest ecosystem. Can. J. For. Res. 2003, 33, 1864–1873. [Google Scholar] [CrossRef]
- Lang, F.; Bauhus, J.; Frossard, E.; George, E.; Kaiser, K.; Kaupenjohann, M.; Krüger, J.; Matzner, E.; Polle, A.; Prietzel, J.; et al. Phosphorus in forest ecosystems: New insights from an ecosystem nutrition perspective. J. Plant Nutr. Soil Sci. 2016, 179, 129–135. [Google Scholar] [CrossRef]
- Plassard, C.; Dell, B. Phosphorus nutrition of mycorrhizal trees. Tree Physiol. 2010, 30, 1129–1139. [Google Scholar] [CrossRef] [PubMed]
- Cho, H.; Kim, M.; Tripathi, B.; Adams, J. Changes in soil fungal community structure with increasing disturbance frequency. Microb. Ecol. 2017, 74, 62–77. [Google Scholar] [CrossRef] [PubMed]
- Rosling, A.; Midgley, M.G.; Cheeke, T.; Urbina, H.; Fransson, P.; Phillips, R.P. Phosphorus cycling in deciduous forest soil differs between stands dominated by ecto- and arbuscular mycorrhizal trees. New Phytol. 2016, 209, 1184–1195. [Google Scholar] [CrossRef] [PubMed]
- Ebeling, C.; Lang, F.; Gaertig, T. Structural recovery in three selected forest soils after compaction by forest machines in Lower Saxony, Germany. For. Ecol. Manag. 2016, 359, 74–82. [Google Scholar] [CrossRef]
Figure 1.
Profile view of the model transect. Strata are defined by relative position to wheel tracks, tree boundary, and distance to nearest skid trail. ‘X’s mark sampling points.
Figure 1.
Profile view of the model transect. Strata are defined by relative position to wheel tracks, tree boundary, and distance to nearest skid trail. ‘X’s mark sampling points.

Figure 2.
Total forest floor and mineral soil nutrient stocks by fraction, depth, and stratum in 2015. The entire stocks after deposition (deposited stock plus mean stand stock) are listed in the upper left for each nutrient. Letters indicate significant differences in complete forest floor or mineral soil nutrient stocks between strata (Dunn’s test, p < 0.05). Bars are one standard error of mean, complete stocks.

Figure 3.
Available mineral soil nutrient stocks by depth and stratum in 2015 (exchangeable cations with NH4Cl and citric acid-extractable P). Letters indicate significant differences in complete stocks between strata (Dunn’s test, p < 0.05). Bars are one standard error of mean, complete stocks.
Figure 3.
Available mineral soil nutrient stocks by depth and stratum in 2015 (exchangeable cations with NH4Cl and citric acid-extractable P). Letters indicate significant differences in complete stocks between strata (Dunn’s test, p < 0.05). Bars are one standard error of mean, complete stocks.

Figure 4.
Forest floor and mineral soil bulk mass/density and carbon stocks by fraction and stratum in 2015. The entire biomass after deposition (deposited stock plus mean stand stock) is listed in the upper left. Letters indicate significant differences between strata for the individual fraction or depth (Dunn’s test, p < 0.05). Bars are one standard error of means.

Figure 5.
Nutrient concentration in first generation needles in relation to distance from skid trail (2015). Shading refers to nutrition status as classified by Göttlein [24].
Figure 5.
Nutrient concentration in first generation needles in relation to distance from skid trail (2015). Shading refers to nutrition status as classified by Göttlein [24].

Figure 6.
The majority of base cations were exported in harvested stem wood and bark while the majority of P was deposited on the skid trail in branches and needles. Of deposited nutrients, majorities of Ca, K, and P were transported into mineral soil. With Norway spruce’s rooting structure, minimal compaction, and no significant relations between needle nutrient concentrations and distance to skid trail, uptake of nutrients throughout the stand was possible yet unsubstantiated.


Table 1.
Stump decay classes with description, assumed thinnings, and number (n) of stumps per class.
Table 1.
Stump decay classes with description, assumed thinnings, and number (n) of stumps per class.
| Class | Description | Thinning Years | n |
|---|---|---|---|
| Class 1 | Sapwood solid, heartwood solid, minimal damage, bark intact | 2015 | 30 |
| Class 2 | Sapwood soft, heartwood solid, visible damage, bark partly intact | 2011, 2007–2008 | 64 |
| Class 3 | Sapwood soft, heartwood soft, heavy damage, bark missing | 2003–2004, 1996 | 99 |
Table 2.
Harvested biomass and nutrient stocks at the stand scale (modeled, kg ha); their respective redistribution either through removal, left in stand, or deposition on skid trails; and resulting additional meso-scale stocks in stand and skid trail not including pre-harvest stocks (4.5 m skid trail per 20 m of forest; g m kg ha).
| Fraction | Harvested (kg ha) | Proportion in Each Fraction (%) | Redistribution (%) | Stocks (g m) | ||||||
|---|---|---|---|---|---|---|---|---|---|---|
| Stem | Bark | Br. ≤7 cm | Needles | Removed | Stand | Skid Trail | Stand | Skid Trail | ||
| Biomass | 187,430 | 74.6 | 8.4 | 10.3 | 6.7 | 80.1 | 3.8 | 16.1 | 0.9 | 13.4 |
| Ca | 472.0 | 25.1 | 38.1 | 16.7 | 20.1 | 61.0 | 4.1 | 34.9 | 2.4 | 73.3 |
| K | 219.2 | 32.5 | 20.9 | 19.5 | 27.1 | 51.5 | 4.2 | 44.3 | 1.2 | 43.2 |
| Mg | 56.4 | 30.6 | 26.3 | 20.2 | 22.9 | 55.0 | 4.0 | 40.9 | 0.3 | 10.3 |
| P | 81.7 | 12.3 | 23.7 | 28.9 | 35.1 | 34.9 | 4.3 | 60.8 | 0.2 | 11.3 |
kg m for biomass.
Table 3.
Mean fine root density by strata including one standard error of the mean (). Letters indicate significant differences between strata (Dunn’s test, p < 0.05).
Table 3.
Mean fine root density by strata including one standard error of the mean (). Letters indicate significant differences between strata (Dunn’s test, p < 0.05).
| Fraction | Fine Root Density (Forest Floor g m; Mineral Soil mg cm) | ||||
|---|---|---|---|---|---|
| Stand | Edge | Bulge | Wheel | Center | |
| Forest floor | 47 ± 25 | 52 ± 9 | 40 ± 7 | 41 ± 14 | 39 ± 14 |
| 0–5 cm | 0.50 ± 0.13 | 0.67 ± 0.11 | 0.61 ± 0.12 | 0.53 ± 0.12 | 0.54 ± 0.14 |
| 5–10 cm | 0.29 ± 0.14 | 0.40 ± 0.13 | 0.16 ± 0.08 | 0.17 ± 0.09 | 0.55 ± 0.18 |
| 10–20 cm | 0.23 ± 0.09 | 0.14 ± 0.06 | 0.13 ± 0.06 | 0.25 ± 0.13 | 0.19 ± 0.06 |
Table 4.
Linear regressions between total and available nutrient densities by volume (y) and both bulk and C density by volume (x) for the mineral soil.
Table 4.
Linear regressions between total and available nutrient densities by volume (y) and both bulk and C density by volume (x) for the mineral soil.
| Fraction (y) | Bulk Density (x; g cm) | Carbon Density (x; g cm) | ||||
|---|---|---|---|---|---|---|
| Formula | Adj. | p Value | Formula | Adj. | p Value | |
| Total stock (y; g cm) | ||||||
| Ca | 0.720 | <0.001 | 0.123 | <0.001 | ||
| K | 0.916 | <0.001 | 0.486 | <0.001 | ||
| Mg | 0.896 | <0.001 | 0.566 | <0.001 | ||
| P | - | - | >0.05 | 0.331 | <0.001 | |
| Available stock (y; g cm) | ||||||
| Ca | 0.090 | <0.05 | 0.273 | <0.001 | ||
| K | 0.113 | <0.01 | 0.403 | <0.001 | ||
| Mg | 0.105 | <0.01 | 0.290 | <0.001 | ||
| P | 0.037 | <0.05 | 0.331 | <0.001 | ||
© 2017 by the authors. Licensee MDPI, Basel, Switzerland. This article is an open access article distributed under the terms and conditions of the Creative Commons Attribution (CC BY) license (http://creativecommons.org/licenses/by/4.0/).
Share and Cite
MDPI and ACS Style
Stutz, K.P.; Schack-Kirchner, H.; Kändler, G.; Landes, L.; Linz, M.; Warlo, H.; Lang, F. Available Nutrients Can Accumulate in Permanent Skid Trails. Forests 2017, 8, 358. https://doi.org/10.3390/f8100358
AMA Style
Stutz KP, Schack-Kirchner H, Kändler G, Landes L, Linz M, Warlo H, Lang F. Available Nutrients Can Accumulate in Permanent Skid Trails. Forests. 2017; 8(10):358. https://doi.org/10.3390/f8100358
Chicago/Turabian StyleStutz, Kenton P., Helmer Schack-Kirchner, Gerald Kändler, Lea Landes, Martin Linz, Hannes Warlo, and Friederike Lang. 2017. "Available Nutrients Can Accumulate in Permanent Skid Trails" Forests 8, no. 10: 358. https://doi.org/10.3390/f8100358
Note that from the first issue of 2016, this journal uses article numbers instead of page numbers. See further details here.