Characterizing the Intensity and Dynamics of Land-Use Change in the Mara River Basin, East Africa
by

Hosea M. Mwangi
1,2,3,*, 
Padia Lariu
1,
Stefan Julich
1,
Sopan D. Patil
2,
Morag A. McDonald
2 and
Karl-Heinz Feger
1,* 1
Institute of Soil Science and Site Ecology & Center of Advanced Water Research (CAWR), Faculty of Environmental Sciences, Technische Universität Dresden, Pienner Str. 19, 01737 Tharandt, Germany
2
School of Environment, Natural Resources and Geography, Bangor University, Bangor LL57 2DG, UK
3
Soil, Water and Environmental Engineering Department, Jomo Kenyatta University of Agriculture and Technology (JKUAT), P.O. Box 62000, Nairobi 00200, Kenya
*
Authors to whom correspondence should be addressed.
Forests 2018, 9(1), 8; https://doi.org/10.3390/f9010008
Submission received: 7 November 2017
/
Revised: 11 December 2017
/
Accepted: 20 December 2017
/
Published: 22 December 2017
(This article belongs to the Section Forest Ecology and Management)
Abstract
:The objective of this study was to analyze patterns, dynamics and processes of land-use/cover changes in the transboundary Mara River Basin in East Africa. We specifically focused on deforestation and expansion of agriculture in the watershed. The intensity analysis approach was used to analyze data from satellite imagery-derived land-use/cover maps. Results indicate that swap change accounted for more than 50% of the overall change, which shows a very dynamic landscape transformation. Transition from closed forest to open forest was found to be a dominant landscape change, as opposed to a random change. Similarly, transition from open forest to small-scale agriculture was also found to be a dominant transition. This suggests a trend (pathway) of deforestation from closed forest to small-scale agriculture, with open forest as a transitional land cover. The observed deforestation may be attributed to continuous encroachment and a series of excisions of the forest reserve. Transition from rangeland to mechanized agriculture was found to be a dominant land-use change, which was attributed to change in land tenure. These findings are crucial for designing strategies and integrated watershed management policies to arrest further deforestation in the forest reserves as well as to sustainably control expansion of agriculture.
1. Introduction
Land-use/cover change is a topic that has in the recent years gained interest because of its role as a driver of environmental change [1,2]. It is of interest to many fields of science including hydrology and related water resources management [3,4,5,6], biology with special focus on biodiversity [7], conservation [8,9], and agriculture including (agro)forestry [10]. Expansion of agricultural land is one of the main causes of land use/cover changes. Cropland increased from 5.9% to 10.6% of the global land area between 1900 and 2000 [11]. Forests and grassland have been the main targets for conversion to agricultural cultivation [12,13,14]. Gibbs et al. [15], for example, estimated that 55% of new agricultural land in the tropics between 1980 and 2000 came from intact forests while a further 28% came from disturbed forests. The competition for the same land by different land uses has been increasing steadily [2]. Therefore, the entire process of land-use/cover change, including the patterns, dynamics, and the driving forces, is of considerable interest to a wide range of stakeholders.
A good understanding of the land-use/cover change processes is fundamental for the establishment of effective conservation and management strategies as well as for modelling future land use [1,16]. Shallow assessment of land-use/cover change might not reveal the most important and dominant signals of land change, which may lead to the wrong choice of conservation measures or inaccurate modelling of land change [17]. Overlay of land-cover maps (of the same spatial extent), derived from satellite images taken at different time periods, is a commonly used approach of land-use/cover change analysis [18]. Some studies use transitional matrices to compare land-cover maps from two different dates. These kinds of analyses are able to identify the patterns (spatial arrangement of land-cover/uses), as well as the magnitude and rates of land-use/cover changes. These studies, however, rarely identify or assess the processes behind the change in land patterns i.e., whether the observed transitions are due to systematic or random processes. Identification of these processes aids in linking the observed transitions of land categories to possible causes [17,19,20]. In a random process of land change, a given land-use category usually has no particular tendency to gain or lose to any of the other categories. If an observed transition deviates from a transition that is expected of a random process, then it is said to be systematic [21]. Random processes are influenced by coincidental factors, i.e., short-term events of land transformation characterized by rapid and abrupt changes caused by land factors that act suddenly (e.g., land conflicts) [14,22]. Systematic processes, however, tend to evolve in a consistent and progressive way due to factors such as population growth, industrial/commercial expansion or changes in land-management policies [19,20,22]. Systematic transitions therefore show the most prominent (dominant) signals of landscape change. Thus, characterizing and linking the observed patterns with the processes that cause the transitions help in deeper understanding of land-use change and developing effective land-management strategies [8,23].
Progressive development by Pontius [17], Alo and Pontius [16] and Aldwaik and Pontius [24,25] culminated in a method referred as intensity analysis which can quantify, detect and differentiate between systematic and random processes of landscape transitions, and analyse how the land transitions have shifted over time (i.e., over a number of time intervals). The intensity analysis method can analyse maps to identify landscape transitions over a number of time points at once. We used this method to analyze land-use/cover changes in the Mara River Basin in East Africa over a period of about 40 years. The land-use changes, especially deforestation in the Mau Forest at the headwaters in Kenya, have been blamed for change in the flow regime of the Mara River as well as deterioration of river water quality [26,27]. Mwangi et al. [6] estimated that about 97% of change in the streamflow of the Nyangores River, a tributary of the Mara River, was caused by land-use change, particularly deforestation and expansion of agriculture. In a previous study, Mati et al. [28] reported that large-scale deforestation occurred in the upper Mara and conversion of rangelands to agriculture in the mid regions of the basin between 1973 and 2000. However, the analysis by Mati et al. [28] focused on the net changes of land use. The study did not investigate the dynamics of land use in detail to determine land-use change intensity and swap changes between land-use categories. Analyses based on net changes may fail to reveal the total change on the landscape [29,30]. This is because a zero net change does not necessarily imply a lack of change. There is a possibility that a change occurs in a such a way that the location of a land-category changes between time 1 and time 2 while the quantity (size) remains the same [17]. For example, analysis of net changes may indicate that a particular land use (e.g., forest) did not change from time point 1 to a subsequent time point 2. However, whereas the size of forest may have remained constant, there could have been deforestation in some parts of the study area which was accompanied by regrowth or afforestation (of equal size) in other parts. This suggests that although the size of forest was constant, the forest was not stable. Revealing this kind of information is important for conservation and management because the changes may have caused a change in hydrological catchment properties affecting e.g., infiltration and soil/slope water pathways. This may subsequently affect catchment water yield, flow dynamics and related erosion/water quality patterns (confer [31]). Therefore, our study specifically sought to find out which land-use transitions are intensively targeted or avoided by a particular land-use category. We mainly focused on transitions involving forest and agriculture to reveal more details on deforestation and expansion of cropland agriculture in the watershed including underlying processes, trends and possible driving forces. Our study, to the best of our knowledge, is the first to apply the intensity analysis approach in the East Africa region with a focus in forest dynamics. Being a region that is facing rampant deforestation, the contribution of our study is to extend the land use analysis studies in the region from traditional superficial change detection analysis to detailed and deeper analysis that link patterns of land change to processes that cause transitions, with an ultimate aim of arresting further unwanted deforestation.
2. Materials and Methods
2.1. Study Area
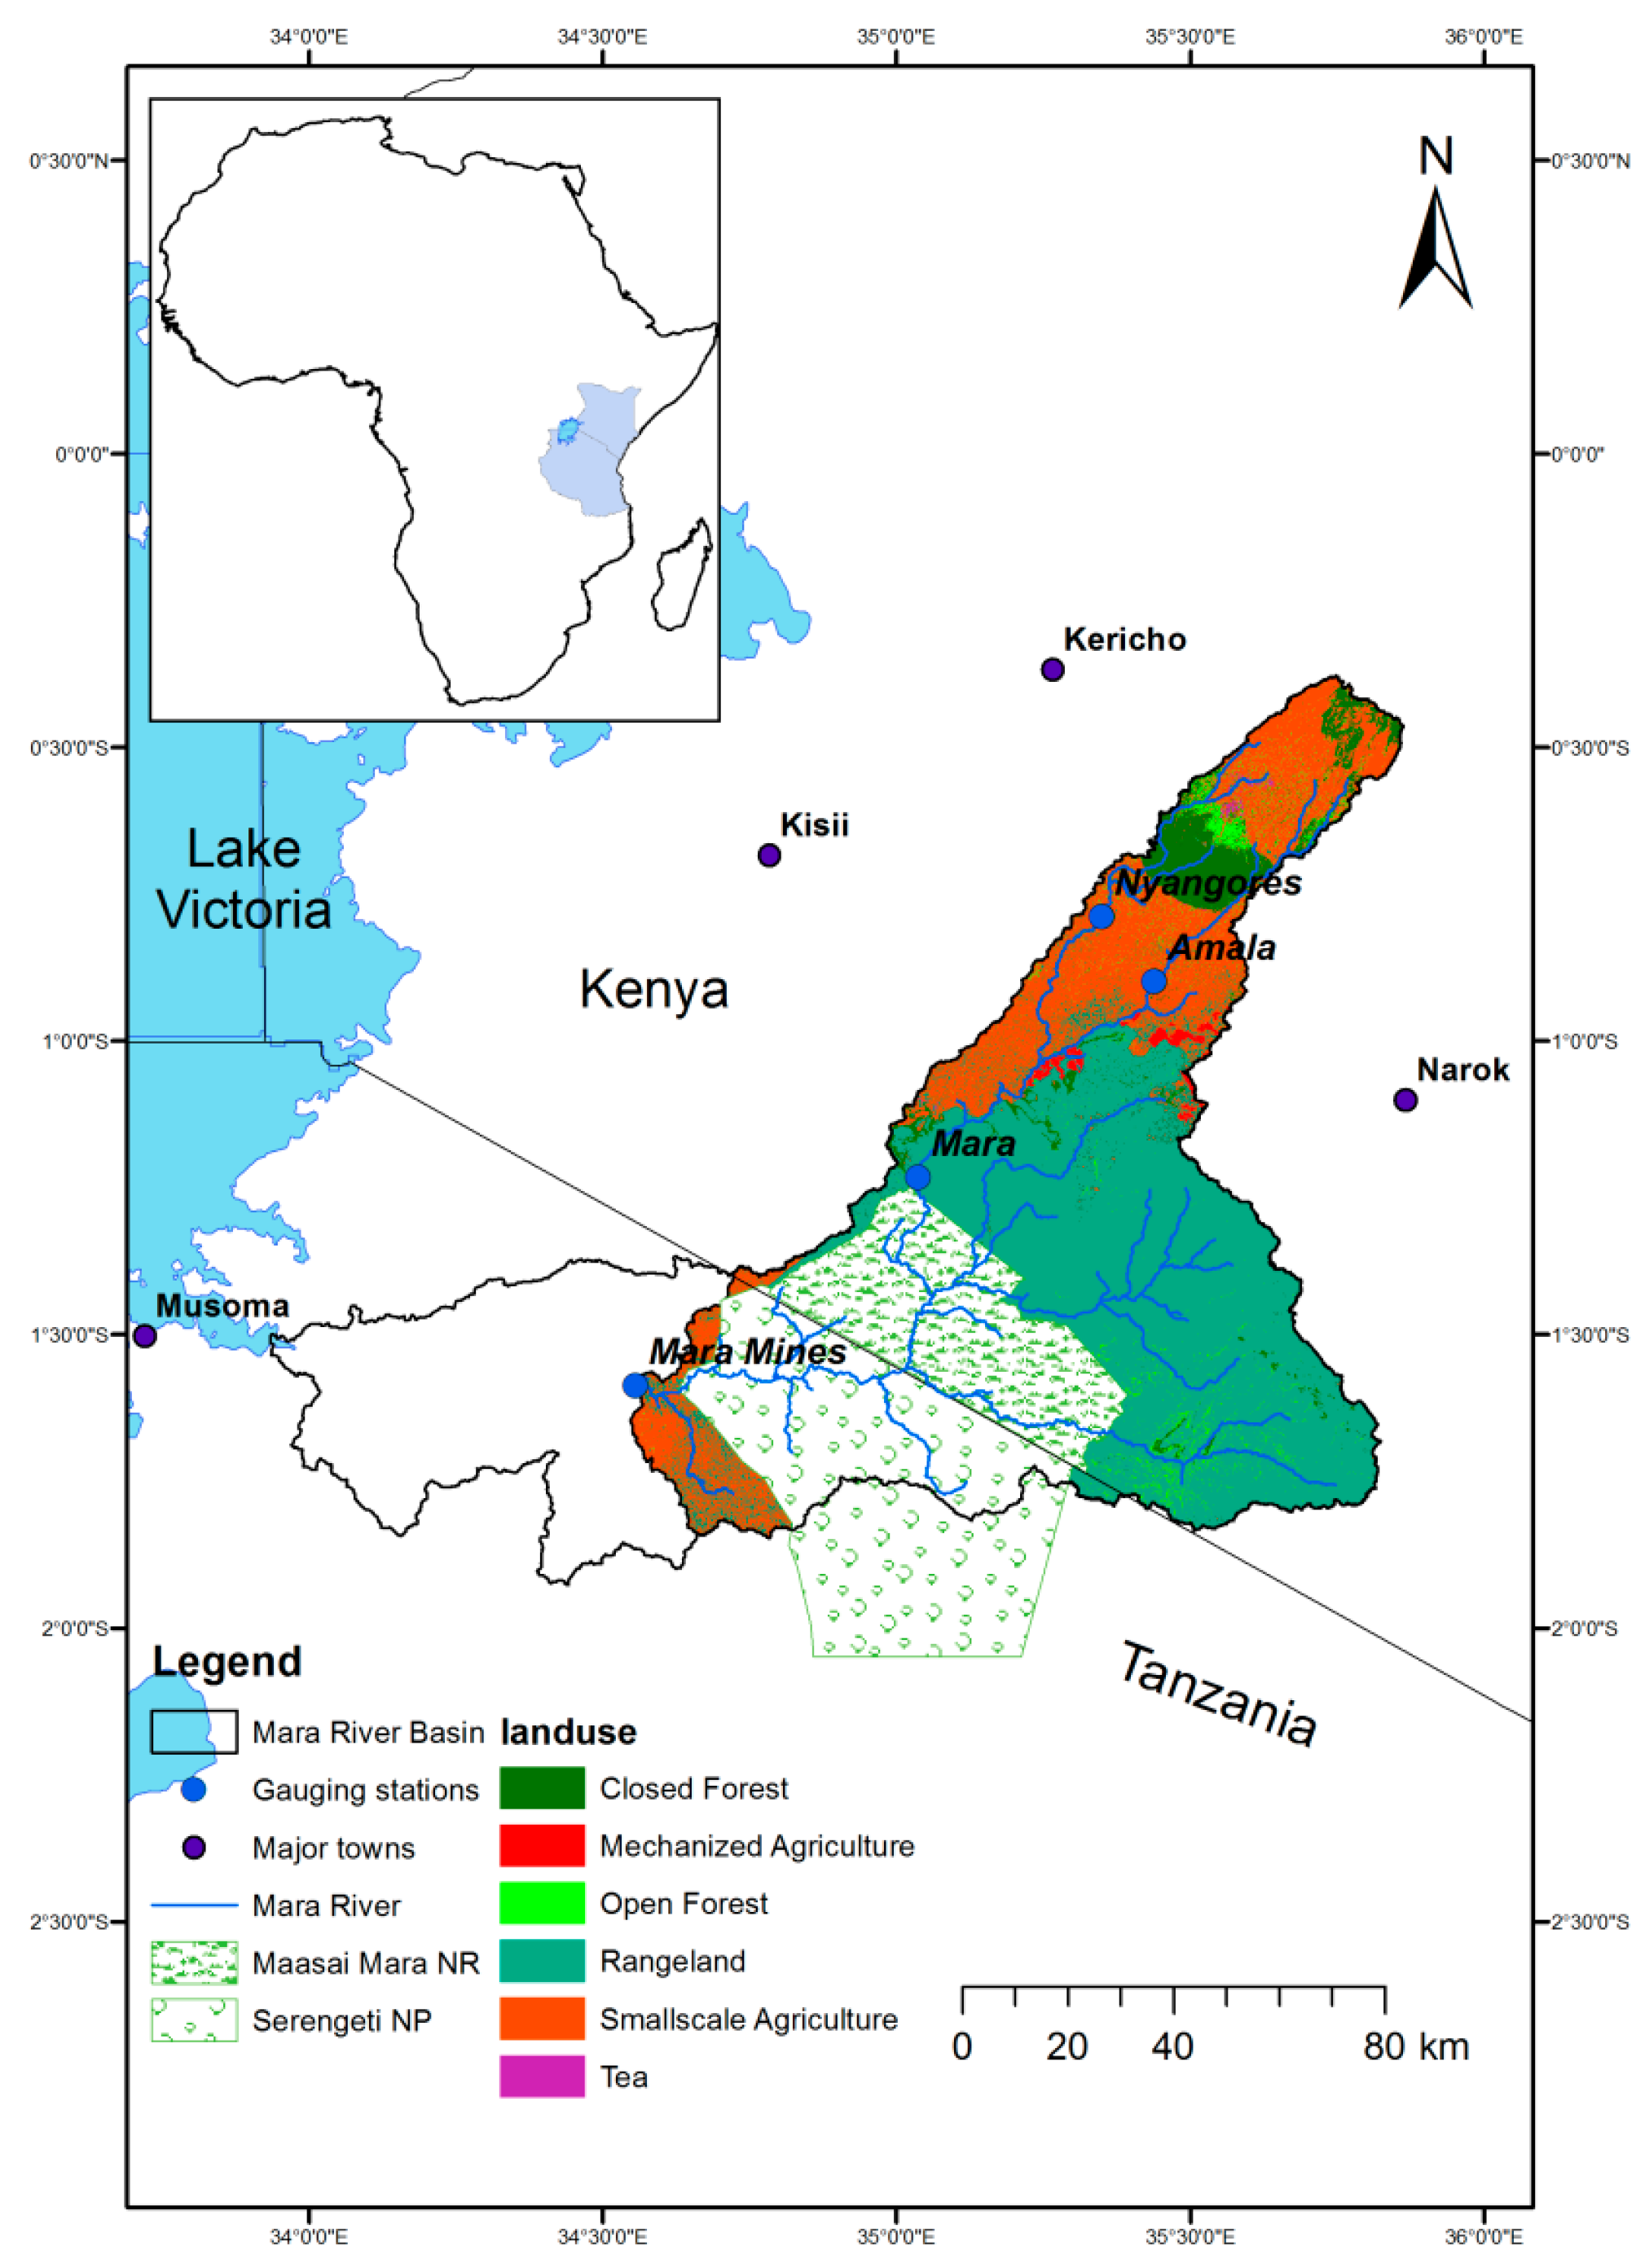
The Mara River Basin is a transboundary watershed (13,750 km2) shared between Kenya (65%) and Tanzania (35%) (Figure 1). The Mara River originates from the Mau Forest complex in Kenya, flows through an expansive rangeland and finally drains into Lake Victoria on the Tanzanian side of the border. The main land uses are forest, agriculture, and rangeland. Mau is a large forest complex which is a source of several rivers in the region including the Mara River. It is composed of 22 forest blocks which are gazetted forest reserves [32,33]. However, rampant deforestation has occurred in the larger Mau Forest complex especially in the last half a century. The area surrounding the Mau Forest is favourable for agriculture (annual rainfall ranges from 1400 mm to 2500 mm) and therefore most of the deforested land has been converted to cropland agriculture, particularly small-scale (i.e., small-holder) agriculture. The middle section of the basin is mainly rangeland that is used by the local Maasai people for grazing. Two national (game) reserves are located within the rangeland: The Maasai Mara National Reserve (MMNR) in Kenya and the Serengeti National Reserve in Tanzania are major wildlife tourist attraction sites. In recent years, agriculture, particularly large-scale mechanized cultivation of wheat has been extending into the rangelands [34].
2.2. Data
Landsat satellite images for 1976, 1985, 1995, 2003, and 2014 were obtained from the United States Geological Survey. The downloaded Landsat images already had some standard preprocessing (i.e., geometric and radiometric correction) done by United States Geological Survey (https://landsat.usgs.gov/landsat-processing-details) which we considered sufficient for the type of the analysis we performed [35,36]. The images were chosen for varying dates in the dry season of January and February to avoid clouds and possible errors resulting from seasonal differences between time points. The study period was selected to cover post-independence period in Kenya. An interval of approximately 10 years was selected as it was considered appropriate to track the dynamics of land change and still manageable in terms of the amount of data and data analysis involved. The specific year selected depended on the availability and quality (mostly due to cloud cover) of the satellite imagery for the dry months of January and February in the study area.
2.3. Land-Use/Cover Classification
Supervised classification using a maximum likelihood algorithm was adopted using 6 land-use/cover categories. Selection of training samples was based on information from available past maps of the area [28,37,38], Google Earth images, first author’s knowledge of the study area and additional field surveys carried out in April 2014 and May 2015. Training pixels for different land use/cover categories were mainly sampled in areas that did not experience change over the study period. Reflectance values corresponding to the various land use/cover classes were used to create their respective spectral signatures which were then used to perform the classification. The land cover categories are: closed forest, open forest, small-scale agriculture, mechanized (large scale) agriculture, rangeland and tea plantation. Closed forest represents densely forested areas with closed canopies (over 75% tree cover), while open forest represents areas with light tree canopy coverage (less than 75% tree cover) and mosaics of predominantly forested areas with some patches of cleared/cultivated land. Small-scale agriculture includes patterns of small cultivated areas sometimes alternated with fallow land, while mechanized agriculture comprises of large coherent agricultural land of the same crop stand, mostly in regular shapes. Tea plantation includes both small and large tea plantations. Rangeland includes grassland, shrub land, savanna mainly used for grazing and game reserves. The land-use/cover map of 1976 was resampled using the nearest neighbour technique from originally 60 m to 30 m resolution to conform to the resolution of other maps for easier post classification comparison/analysis.
2.4. Land Use/Cover Intensity Analysis
To determine the patterns, intensity and the dynamics of land-use/cover change, land-use intensity analysis was performed following the framework of Aldwaik and Pontius [24]. First, transitional matrices were used to quantify the land-use/cover change over space and time. A transition matrix is a two-dimensional table in which land-use categories at the beginning of the time interval are displayed in rows while land-use categories at end of time interval are displayed in columns [23,24]. The diagonal entries indicate persistence whereas off-diagonal entries indicate a transition from one land-use category at the start of the interval to another category at the end of the interval. The row totals show the size of land-use/cover category at the beginning of the interval and the column totals show the corresponding sizes at the end of the interval. A transitional matrix was made for each time interval, i.e., 1976–1985, 1985–1995, 1995–2003, and 2003–2014.
The transition matrices were then used to perform intensity analysis following the approach by Aldwaik and Pontius [24,25]. The method computes and compares observed intensities of land-use changes with uniform intensity among land-use categories. The intensity analysis approach has three levels of analysis: interval, category and transition. At the transition level, the method assesses how the size and intensity of the each transition (from one category to the other) varies among land-use categories. For each category gain or loss, transition level analysis compares the observed intensity of each transition with a hypothetical uniform transition that would occur if the transition were distributed uniformly among land-use categories available for the transition. Equations (1) and (2) (Summarized equations used in the intensity analysis [24,25]) are used for transition level analysis to identify the transition from an arbitrary category i to a particular gaining category n [24,39]. In other words, the equations identify which land-use categories are intensively avoided or targeted for gaining by category n in a particular time interval. The analysis can therefore identify which land-use categories are intensively targeted (or avoided) by either loss or gain of a particular category. Equation (1) calculates observed intensity Rtin of annual transition from category i to category n for a given time interval relative to the size of category i at the start of the interval. The observed intensity Rtin is compared with uniform intensity Wtn calculated using Equation (2) which assumes that category n gains uniformly across the landscape. If Rtin > Wtn, then gain of n is considered to target i but if the opposite is true, gain of n is considered to avoid i. Therefore, with this analysis, it is possible to identify, for example, which land-use categories are targeted (or avoided) by expansion of agriculture. It can also tell which other land-use/cover categories would benefit (targeted), say, from a forest loss.
Transition Level Equations.
where, Yt = Year at time point t; t = Index for the initial time point of interval (Yt, Yt+1); i = Index for a category at an interval’s initial time point; j = Index for a category at an interval’s final time point; n = Index for the gaining category for the selected transition; Ctij = Number of pixels that transition from category i to category j during interval (Yt, Yt+1); Ctin = Number of pixels that transition from category i to category n during interval (Yt, Yt+1); Ctnn = Number of pixels that remained category n during interval (Yt, Yt+1); J = Number of categories
2.5. Error Analysis
The maps used for these analyses were made using satellite images taken at different times in the past. Since the maps cover the same areal extent, if the maps were completely accurate, the differences between them would perfectly indicate temporal changes in land-use/cover. However, classification errors in the maps can also cause differences in the maps [40], in addition to the observed land-use/cover changes. Since the maps were made from the past images, there was not enough reference ground information available to measure or estimate classification errors in the maps. Aldwaik and Pontius [25] proposed a methodology for estimating minimum errors in the maps that could account for the differences in two maps of the same areal extent but of different time points in the past. The error analysis method by Aldwaik and Pontius [25] assesses the strength of the changes identified through intensity analysis. A null hypothesis of uniform change intensity is first hypothesized.
The uniform hypothesis assumes that change intensities are uniform and that there is no temporal change in the maps; therefore, classification errors in maps (hypothetical- because they are unknown) are equal to the uniform change. Thus, any deviation between the observed (real) change in the maps and the uniform change is an indicator of temporal change between the maps.
In this analysis, two types of errors (commission errors and omission errors) are estimated. Commission error occurs when the observed intensity of change is greater than the uniform hypothesized intensity. The reverse is true for the omission error. The error (either commission or omission) is the difference between the observed change and uniform change. The larger the commission or omission error, the stronger the evidence against the null hypothesis of uniform change. Strong evidence implies that there is a high likelihood that the differences in the maps are not necessarily due to classification errors; implying that there was actual change in land use.
In this study, commission errors were estimated using Equations (3) and (4) while omission errors were calculated using Equations (5) and (6). When observed transition of i was greater than uniform gain of n, the size and the intensity of commission of category i error were estimated using Equations (3) and (4), respectively. Similarly, the size and the intensity of omission of category i error were calculated using Equations (5) and (6) respectively, when observed transition from i is less than uniform gain of n.
where, ERtin = Commission of category i error at time t, i.e., number of elements that are observed transitions from category i to category n during interval [Yt, Yt+1] but are hypothesized transitions from a non-i category to category n, ORtin = Omission of category i error at time t, i.e., number of elements that are observed transitions from a non-i category to category n during interval [Yt, Yt+1] but are hypothesized transitions from a category i to category n.
3. Results
3.1. Overall Land-Use/Cover Changes
Figure 2 shows the land-use/cover maps of the Mara River basin for the years 1976, 1985, 1995, 2003, and 2014. From the maps, it can be seen that rangeland is a dominant land use accounting for over two-thirds of the basin at all times. This is partly contributed by the presence of two protected national reserves, i.e., Maasai Mara and Serengeti, whose land cover fall under this land-use category. The two national reserves have been in existence throughout the study period. The area surrounding the national reserves, particularly on the Kenyan side of Maasai Mara, is occupied by Maasai ethnic community whose main socio-economic activity is pastoralism. Therefore, the land surrounding the Maasai Mara is mainly used for grazing. It can be seen that most of the land-use changes have occurred in the upper part of the basin. The most notable change is the steady increase in small-scale agriculture and a decline in forest cover (Figure 2). The forest cover decreased from about 20% to about 7% of the study area between 1976 and 2014, which can be attributed to deforestation particularly in the Mau Forest at the source of the Mara River. During the same period, small-scale agriculture increased from approximately 6.5% to 21% of the landscape. Other land-use changes of interest are expansion of mechanized agriculture and tea plantations. Although they both represent a very small percentage of the basin (<1%) at all times, they have been steadily increasing during the study period. Mechanized farming was only almost insignificant in 1976 (covered ca. 0.01% of the watershed) while tea plantation is a new land use established in the 1985–1995 interval.
Overall and category-wise annual areas net changes (gross gain minus gross loss) and swap changes are summarized in Table 1 for the four time intervals. Closed forest shows net gains in the first two intervals (23.3 km2/year and 6.1 km2/year, respectively) and then net losses in the last two intervals (9.7 km2/year and 36.0 km2/year, respectively). Open forest depicts a net loss over the entire study period (during all the intervals). This indicates a general trend of deforestation throughout the study period. Small-scale agriculture shows a net gain in all intervals which peaked (81.3 km2/year) during the 1995-2003 interval and slowed (12.9 km2/year) during the last interval. The overall land-use/cover change also peaked during the 1995–2003 interval (at 275.5 km2/year) and slowed during the last interval. Most land-use categories underwent swap change throughout the study period (Table 1). A swap change depicts vegetation (or any other land use/cover) loss occurring in one location while an equal gain occurs in another location [17,29,41]. The last row in Table 1 reveals that swap change accounted for more than 50% of the overall land use/cover change in all the four intervals. This means that land-use change in the Mara is very dynamic which is accompanied by high rate of relocation of land-use categories. The high percentage of swap change indicates that overall change is more than double the net changes, and demonstrates the importance of detailed analysis of land change beyond the net change [29]. For deforestation as an example, analysis of net changes alone would indicate a loss rate of 9.7 km2/year for closed forest for the 1995–2003 interval. This, however, may not give the entire picture because this only represents 8.6% of the total change of closed forest during this interval. The closed forest actually lost at a higher rate of about 61.1 km2/year (gross loss) but it also gained (probably by regrowth in formerly opened up areas) by 51.4 km2/year (gross gain); total change = 112.5 km2/year (Table 1). This reveals that 91% of the overall change (swap change) would have been concealed and the actual rate of deforestation may be underestimated.
3.2. Transition between Forest and Small-Scale Agriculture
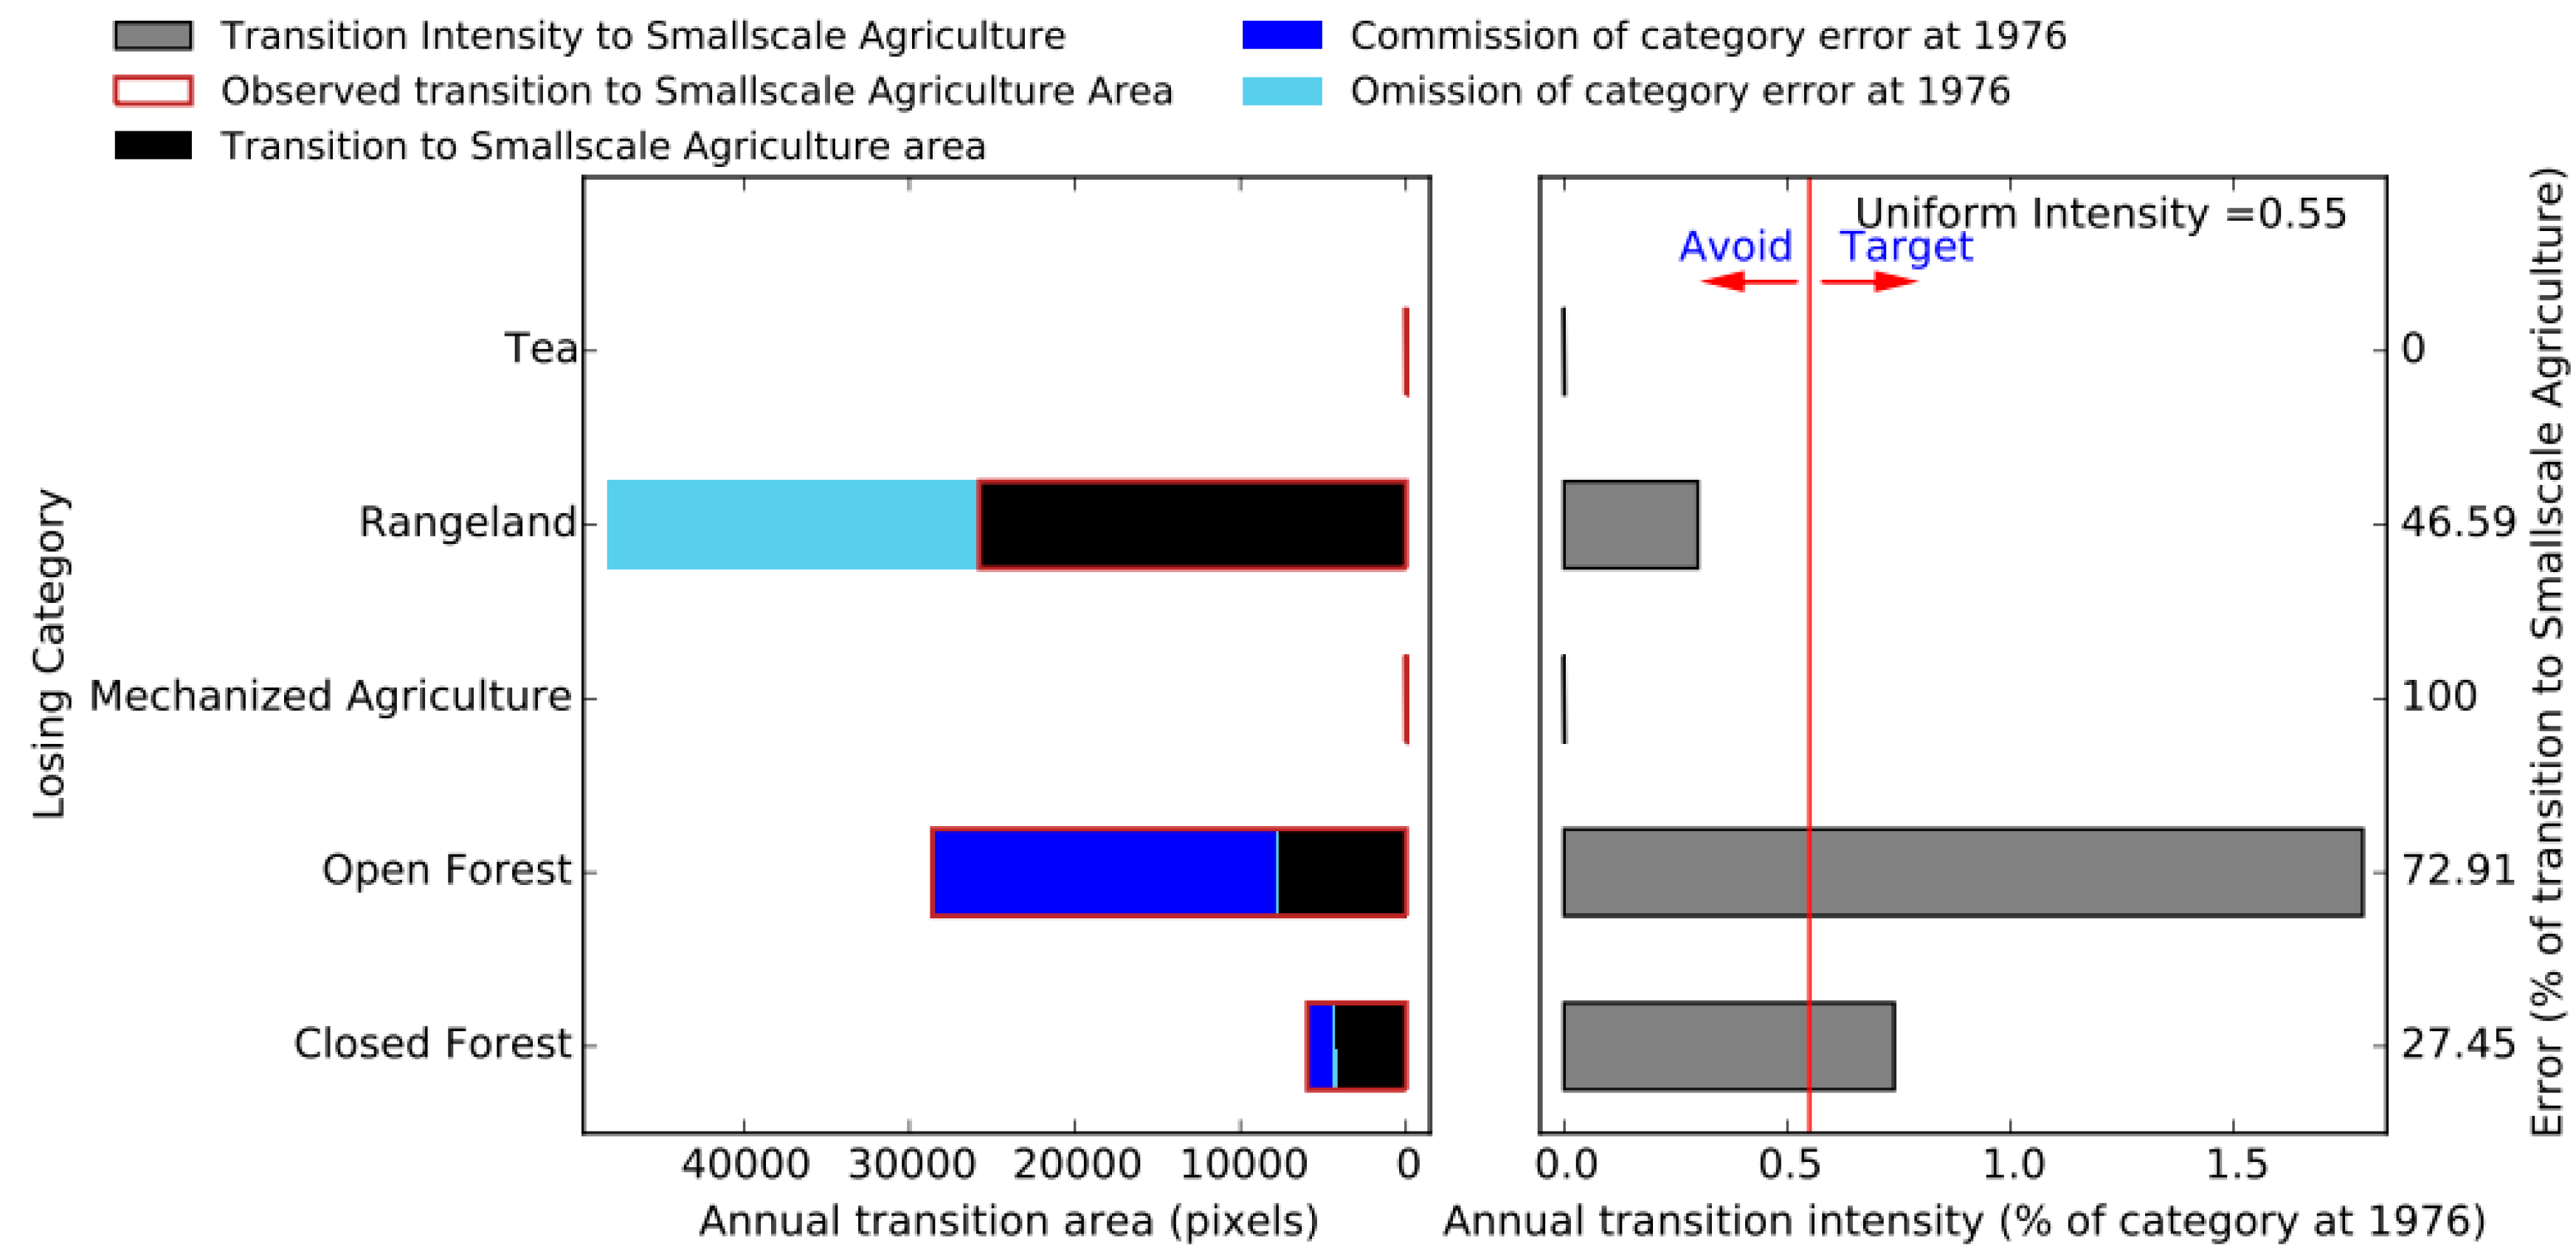
Gain in small-scale agriculture consistently targeted forests (open and closed forests) in all the intervals (Table 2). For example, during the first interval (1976–1985) the annual intensity gain of small-scale agriculture from open forest is 1.79% of the size of the open forest in 1976 (Table 2a), compared with a uniform intensity of 0.55% (of the landscape that was not small-scale agriculture in 1976), as clearly depicted in Figure 3. This implies that small-scale agriculture gained from open forest over 3 times more than the rate it would be expected to gain uniformly (from all land use categories). Similarly, small-scale agriculture gained from closed forest at an annual intensity of about 0.74% of the size of closed forest in 1976 (Table 2a and Figure 3). It can be observed that small-scale agriculture targeted (gained from) open forest more intensively than closed forest (Table 2a), i.e., the annual transition intensity is higher for open forest than closed forest in all the intervals. It is also worth noting that gain in open forest consistently targeted closed forest in all intervals (i.e., annual transition intensity of open forest is more than the uniform intensity) (Table 2b). This may be an indicator that open forest may be mainly a transitional land use between closed forest and small-scale agriculture.
The error intensity (EI) columns (Table 2) present a strong evidence that, indeed, small-scale agriculture gained more intensively from open forest and closed forest, i.e., the observed deviations from uniform intensity implies that there was real (temporal) transition between small-scale agriculture and forest (both closed and open forest). For example, the commission error intensity for transition to small-scale agriculture from open forest during the 1976–1985 interval is 72.9% of the transition to small-scale agriculture from open forest (Table 2a and Figure 3); this high percentage of error intensity indicates strong evidence against the uniform change hypothesis. The error analysis method [25] does not provide a threshold of how large the deviation of observed intensity from uniform intensity should be in order to qualify as real change. This is because, in some cases, like in our study, the actual map (classification) errors are not precisely known [39,40]. It does, however, imply that the higher the deviation (commission or omission error), the higher the likelihood that the deviation represents real land change.
3.3. Transition between Rangeland and Agriculture
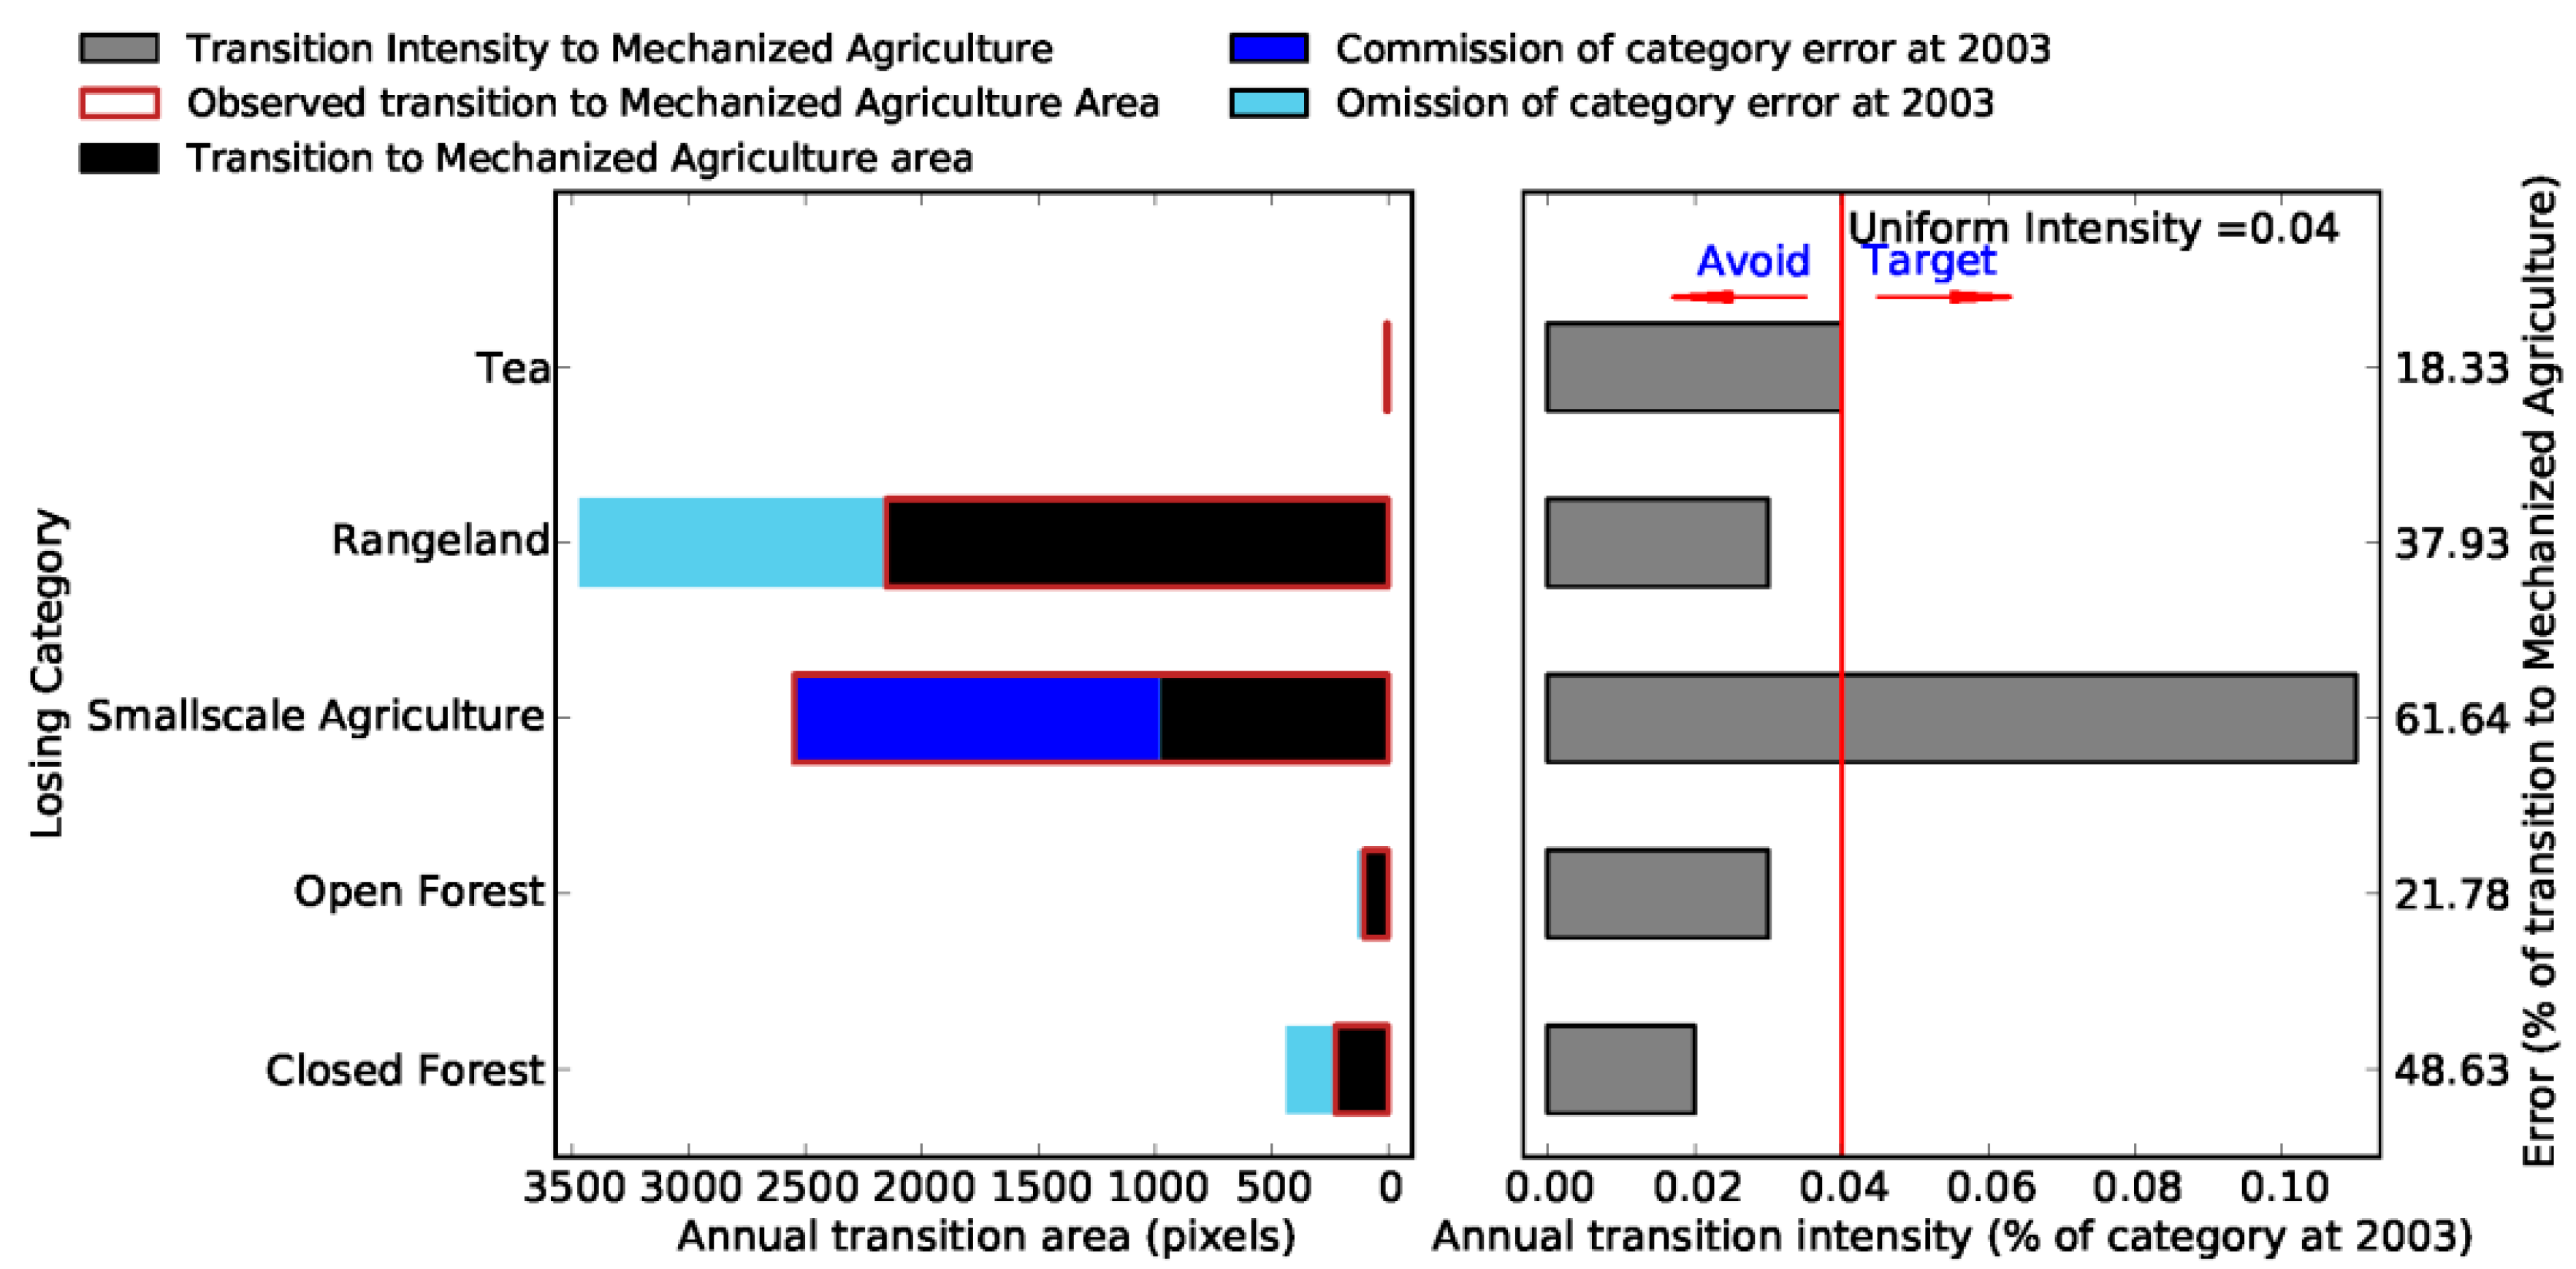
The middle part of the Mara River Basin is mainly occupied by rangelands which is the largest land-use category. Our analysis suggests that mechanized agriculture mainly expanded into rangelands particularly between 1985 and 2003 (Table 3). During the two intervals in this period (1985–1995 and 1995–2003), there was intensive systematic gain of mechanized agriculture from rangelands (Table 3).
During the last interval, expansion of mechanized farming avoided the rangelands and targeted small-scale agriculture (Figure 4). This indicates a shift of expansion of mechanized farming from rangelands to land under small-scale agriculture near the MMNR. Norton-Griffiths et al. [42] observed a shift from mechanized farming predominantly on large plots leased to large-scale contractors prior to 2004 to an increased mechanized farming based on smallholder enterprises, often farmed by Maasai owners themselves. Similar observations were made by Thompson et al. [43]. This may have been as a result of formation of wildlife associations and conservancies in recent years.
4. Discussion
4.1. Trends and Patterns of Deforestation
The systematic processes of deforestation (Table 3) may be attributed to encroachment, excisions and illegal extraction of wood products from the forests, especially the Mau Forest at the headwaters of the Mara River Basin [33]. There has been continuous and progressive encroachment into the Mau Forest leading to massive land degradation. In the larger Mau Forest, for example, over a period of 15 years (1993–2009), a total of 28,500 ha (19 km2/year) of forest was lost through encroachment [33]. There has also been a series of excisions (degazettement) of forest reserves in the watershed (e.g., Mau Forest and Chepalungu Forest) since Kenya’s independence in 1963 [33,44]. The excisions of the forest have also accelerated encroachment in the remaining forest reserves [33]. There was a large-scale excision of Mau Forest in 2001 which caused much public outcry [32,33,45,46]. The excisions affected many parts of the larger Mau Forest complex including the Eastern and Southwest Mau Forest blocks which are partly located in the Mara River Basin [32]. An aerial survey conducted jointly by United Nations Environment Programme (UNEP) and Government of Kenya [47] found that about 35,301 ha (353 km2) and 22,797 ha (228 km2) were excised in Eastern Mau and Southwestern Mau Forest blocks, respectively, in 2001. The 2001 Mau Forest excision could explain the high loss of closed forest during the last two intervals (1995–2014) compared to other two intervals (Table 1). The Maasai Mau Forest block also underwent intensive deforestation during the same period, particularly the Western side that is located in the Mara River Basin [45]. A study by Nkako et al. [45] found that it (Maasai Mau Forest block) lost over 6300 ha between 2000 and 2005 inside the forest reserve.
Political interference, weak law enforcement, limited management capacities of mandated institutions, and inadequate governance systems are some of the factors that may have led to the large-scale and consistent deforestation through encroachment and forest excision [33,48]. A study by Petursson et al. [49] in Kenya and Uganda found that complex political and institutional factors were the main driving forces behind deforestation. Some of the excisions in the Mau Forest were politically ill-motivated and poorly planned, leading to irregular allocations [33].
The results presented in Table 2 show a consistent trend of deforestation mainly from closed forest to open forest and then from open forest to small-scale agriculture, with open forest being a transition land cover in a deforestation process from closed forest to agriculture. This pathway of deforestation is very important for conservation because the deforestation observed in the Mau Forest is mainly carried out illegally by encroaching into the forest reserve. It indicates that the closed forests are first opened (possibly for timber and charcoal) and then the opened patches are cultivated; eventually, the remaining trees are cleared and converted to agricultural land. Our findings are supported by Olang and Kundu [50], who observed widespread charcoal burning in the Mau Forest followed by conversion of deforested areas into subsistence agriculture. An aerial survey by Nkako et al. [45] also found widespread charcoal burning in freshly opened areas of the Maasai Mau Forest block, especially on the Western side of the forest block which is located in the Mara River Basin. Moreover, Were et al. [48] noted that illegal logging and charcoal burning of indigenous forests preceded extensive cultivation of former forest land. There is a possibility that the people opening up the forest for timber or charcoal are different from the ones who later cultivate and settle in the former forest land. The people opening up the forest canopy may be timber and charcoal traders operating far from the forest but who have the resources, connections (with authorities and local people), and networks to facilitate harvesting (including deep in the thick forest), transport and sale of these products [51,52]. These traders may have no intention or interest in the forest land, but their actions lead to opening-up of the forest, thus giving the local community easier access. This makes it easier for the local community to start cultivating on the cleared patches of the forest and eventually clearing the remaining trees as they expand ‘their’ farms. Nkako et al. [45], for example, observed that many destructive activities in the Mau Forest were in close proximity to the forest tracks. This implies that one possible way of combating deforestation is to stop illegal logging of timber and charcoal. In cases where some patches of the closed forest have already been opened-up, measures should be put in place to prevent cultivation of these areas by the local communities.
4.2. Expansion of Mechanized Agriculture in the Rangeland
The systematic process of intensive expansion of mechanized agriculture into rangelands between 1985 and 2003 (Table 3) may be attributed to change of land tenure of the pastoral land surrounding the MMNR. This land is mainly owned by the Maasai community who are pastoralists. The Maasai community historically used this land communally for grazing even before the 20th century [53]. The British colonial government established large extended family (clan) grazing schemes aimed at solving the problem of overstocking and overgrazing in the area. It is upon this concept of grazing schemes that the Government of Kenya developed the ‘group ranches’ land-tenure model after independence in 1963 [54,55]. The group ranches land tenure system is a communal land ownership system where land is held in trust by a few selected people (3 to 10) on behalf of the members of the group ranch [56]. The membership of the groups was based on kinship i.e., members of the tribe, clan, family or any other group of people who owned communal land recognized under customary law [57,58].
Poor management of the group ranches by the elected committee members made the Maasai pushed for subdivision of the group ranches in the late 1970s and early 1980s which was granted by the government in 1983 [58,59]. This subdivision and privatization of the initially communal land to private land has since brought about major changes in land use in the area; mainly the expansion of mechanized agriculture [59]. It is therefore obvious that the intensive expansion of the large-scale mechanized agriculture in the rangelands observed during the two intervals (1985–1995 and 1995–2003) coincided with the subdivision and privatization of the group ranches. The Lemek group ranch (formed in 1969), for example, was subdivided between 1993 and 1999; Maji Moto was subdivided in 1999; Koiyaki was sub-divided by 2003, while Ol Kinyei finished their subdivision by 2004/2005 [43,59,60,61].
Narok is a high-potential wheat growing area [62]. Farmers, particularly from agricultural communities in Kenya, lease large tracks of land for large-scale wheat farming. Even prior to subdivison of the group ranches, these commercial farming entrepreneurs negotiated concessions with group ranch committee members on behalf of the other members. After subdivision, the individual members were able to directly lease out their land for commercial farming. This caused the intensive expansion of mechanized agriculture as observed in our study. By 1995, for example, about 24% of the 495 km2 Lemek group ranch was converted into mechanized agriculture [59].
4.3. Effect of Wildlife Associations and Conservancies
The group ranches surrounding the MMNR are used as wildlife dispersal areas. After subdivision of the group ranches, tour operators and hoteliers made arrangements with individual landowners around the MMNR where landowners would stop leasing out their land for cultivation and instead use it as wildlife dispersal areas. The landowners would in turn get some revenue from the tour operators who took tourists for game drives as well as hoteliers who set up camps for tourists. As a result, Maasai farmers themselves aggregated the small plots they were using for subsistence farming for mechanized (medium-scale) cultivation and left the other land for wildlife dispersal. For example, some members of the Koiyaki and Lemek group ranches came together and formed a community based conservation project established in 2001 [63]. The Koiyaki-Lemek Conservation Trust charged game viewing fees and had contracts with 25 tour operators that leased their campsites on Maasailand [61].
In the last decade, some Maasai land owners came up together and started wildlife conservancies on their land outside the MMNR [64]. In this new arrangement, the private land owners adjacent to the MMNR pooled their land together to create a big game viewing area viable as a conservancy and then broker lease agreements with tour operators under Payment for Ecosystem Services (PES) model [65]. In the conservancies, the landowner who join the PES schemes agree to move out and are not allowed to sell or cultivate their land [66]. Therefore, these wildlife conservation efforts in the Mara may have seen the shift of mechanized cultivation from targeting rangelands to the areas that were already under small-scale cultivation in the rangeland (Figure 4).
4.4. Impact of Land-Use Change on Watershed Hydrology and Biodiversity
The observed land-use changes in the Mara River Basin, mainly deforestation and expansion of agriculture both in the formerly forested areas of the Mau Forest Complex and in the rangelands, are bound to have some effects on the watersheds capacity to provide ecosystem services. Previous studies have reported that deforestation and expansion of agriculture have affected the hydrology of the watershed [6,27,28]. For example, Mati et al. [28] found that land-use change between 1973 and 2000 increased the peak flow of Mara River by 7%. Mwangi et al. [6] estimated that land-use change in the last 50 years contributed to about 97% of the observed increase in mean streamflow of Nyangores River (a headwater tributary of the Mara River). Kiragu [27] observed increased sedimentation of the Mara River which he attributed to deforestation and intensive agriculture currently practiced in the watershed. Deforestation and intensification of agriculture are likely to cause an increase in surface runoff due to degradation of the watershed which reduces its capacity to absorb rainwater (reduced infiltration) [67,68].
Ogutu et al. [69] attributed the decline in some wild animal species (e.g., giraffe, waterbuck, impala) to land-use change in the pastoral ranches bordering the Maasai Mara National Reserve, mainly caused by progressive habitat deterioration. Mau Forest has a rich biodiversity of plants (including indigenous trees), birds, and wild animals [33,70]. However, deforestation is destroying critical habitats for some species that are of conservation significance such as Cisticola aberdare bird, yellow backed and Blue Duikers, and Giant forest hog [33,71]. Mau Forest has also been a home to Ogiek (Dorobo) people who are a hunter-gather community traditionally occupying the moist montane forest areas in Kenya, especially along the Mau escarpment [33,72]. Furthermore, the deforestation of the Mau Forest and related occupation by agricultural communities have resulted in ethnic clashes in the area.
It is therefore obvious that the observed land-use change in the Mara River Basin has affected the watershed’s capacity to provide some ecosystem services (e.g., good quality water, good habitat for some wild animals and people). It is important therefore that the patterns, trends and dominant processes of land-use change (deforestation and expansion of agriculture) observed in this study be used to develop strategies to arrest further deforestation of the natural forest and sustainably control expansion of agriculture (confer [73]).
5. Conclusions
This study uses the Intensity Analysis approach to examine the patterns, dynamics and processes of land-use change that occurred within Mara River Basin in East Africa in four consecutive time intervals between 1976 and 2014. We mainly focused on transitions among forest, agriculture, and rangelands to reveal more details on deforestation and expansion of agriculture in the basin. Swap change accounted for more than 50% of the total land change, which indicates that the land use/cover change is very dynamic, i.e., accompanied with high relocation of land-use categories within the watershed. This also underscores the need for scientists analysing land use changes worldwide to go beyond the net land change which may not necessarily give the entire picture of the land-use change.
There has been intensive loss of closed forest to open forest throughout the entire period (i.e., in all the four intervals). At the same time, there was also intensive loss of open forest to small-scale agriculture in all the four intervals. We attributed the observed deforestation to continuous encroachment and a series of excisions of the forest reserves, particularly the Mau Forest complex at the headwaters of the Mara River. These two systematic transitions (i.e., from closed forest to open forest and from open forest to small-scale agriculture) also reveal a trend (pathway) of deforestation from closed forest to small-scale agriculture, with open forest as a transitional land cover. This trend implies that closed forests are first opened-up (probably for timber and charcoal) and then the opened patches are cultivated. Eventually, remaining trees are removed (logged) as cultivation expands into the open forest.
It was also observed that rangeland was intensively losing to mechanized agriculture between 1985 and 2003. This may be attributed to a change of land tenure (from communal to private) especially in the rangeland. Most of group ranches (under communal land tenure) in the area were subdivided to members during this period which may have accelerated leasing of land to mechanized large scale farmers. Between 2003 and 2014, expansion of mechanized agriculture avoided gaining from rangelands to systematically targeting gaining from small-scale agriculture. This implies small plots used for smallholder agriculture in the rangeland are coalescing to larger plots for mechanized cultivation. This was attributed to the recent establishment of wildlife associations and conservancies where landowners make agreement with tour operators and hoteliers to stop leasing their land for cultivation and use it as wildlife dispersal areas, with some monetary incentives in return.
Further studies on the possible driving forces of deforestation and expansion of agriculture identified in this study may be required for development of effective management strategies. It may be important, for example, to determine the influence of political patronage and forest management institutions on excisions of forest reserves and how these excisions impact further encroachment of the forest reserves. It may also be important to investigate how the influence of the political landscape and flow of income from wildlife conservation (from both Maasai Mara National Reserve and from wildlife associations and conservancies) affect conversion of rangelands to agriculture and vice versa.
Acknowledgments
This research was funded by Forest and Nature for Society (FONASO) under the Erasmus Mundus Joint Doctorate Programme (EMJDP).
Author Contributions
Hosea M. Mwangi, Karl-Heinz Feger, Morag A. McDonald, Stefan Julich and Sopan D. Patil conceived the idea and designed the analysis. Padia Lariu and Hosea M. Mwangi analyzed the data and wrote the original draft manuscript. Karl-Heinz Feger, Stefan Julich, Sopan D. Patil and Morag A. McDonald were heavily involved in editing the manuscript.
Conflicts of Interest
The authors declare no conflict of interest. The founding sponsors had no role in the design of the study; in the collection, analysis, or interpretation of data; in the writing of the manuscript, and in the decision to publish the results.
References
- Al-doski, J.; Mansor, S.B.; Shafri, H.Z.M. Change detection process and techniques. Civ. Environ. Res. 2013, 3, 37–45. [Google Scholar]
- Foley, J.A.; DeFries, R.; Asner, G.P.; Barford, C.; Bonan, G.; Carpenter, S.R.; Chapin, F.S.; Coe, M.T.; Daily, G.C.; Gibbs, H.K.; et al. Global consequences of land use. Science 2005, 309, 570–574. [Google Scholar] [CrossRef] [PubMed]
- Gitau, M.; Bailey, N. Multi-layer assessment of land use and related changes for decision support in a coastal zone watershed. Land 2012, 1, 5–31. [Google Scholar] [CrossRef]
- Brown, A.E.; Western, A.W.; McMahon, T.A.; Zhang, L. Impact of forest cover changes on annual streamflow and flow duration curves. J. Hydrol. 2013, 483, 39–50. [Google Scholar] [CrossRef]
- Mwangi, H.M.; Julich, S.; Patil, S.D.; McDonald, M.A.; Feger, K.H. Modelling the impact of agroforestry on hydrology of Mara River Basin in East Africa. Hydrol. Process. 2016, 30, 3139–3155. [Google Scholar] [CrossRef]
- Mwangi, H.M.; Julich, S.; Patil, S.D.; McDonald, M.A.; Feger, K.H. Relative contribution of land use change and climate variability on discharge of Upper Mara River, Kenya. J. Hydrol. Reg. Stud. 2016, 5, 244–260. [Google Scholar] [CrossRef]
- De Chazal, J.D.; Rounsevell, M.D.A. Land-use and climate change within the assessment of biodiversity: A review. Glob. Environ. Chang. 2009, 19, 306–315. [Google Scholar] [CrossRef]
- Huang, J.; Pontius, R.G., Jr.; Li, Q.; Zhang, Y. Use of intensity analysis to link patterns with processes of land change from 1986 to 2007 in a coastal watershed of Southern China. Appl. Geogr. 2012, 34, 371–384. [Google Scholar] [CrossRef]
- Plieninger, T. Monitoring directions and rates of change in trees outside forests through multitemporal analysis of map sequences. Appl. Geogr. 2012, 32, 566–576. [Google Scholar] [CrossRef]
- Jewitt, D.; Goodman, P.S.; Erasmus, B.F.N.; O’Connor, T.G.; Witkowski, E.T.F. Systematic land cover change in KwaZulu-Natal South Africa: Implications for biodiversity. S. Afr. J. Sci. 2015, 111. [Google Scholar] [CrossRef]
- Goldewijk, K.K.; Beusen, A.; van Drecht, G.; de Vos, M. The HYDE 3.1 spatially explicit database of human-induced global land-use change over the past 12,000 years. Global Ecol. Biogeogr. 2011, 20, 73–86. [Google Scholar] [CrossRef]
- Mao, D.; Cherkauer, K.A. Impacts of land use change on hydrologic responses in the Great Lakes region. J. Hydrol. 2009, 374, 71–82. [Google Scholar] [CrossRef]
- Romero-Ruiz, M.H.; Flantua, S.G.A.; Tansey, K.; Berrio, J.C. Landscape transformations in savannas of northern South America: Land use/cover changes since 1987 in the Llanos Orientales of Colombia. Appl. Geogr. 2012, 32, 766–776. [Google Scholar] [CrossRef]
- Carmona, A.; Nahuelhual, L. Combining land transitions and trajectories in assessing forest cover change. Appl. Geogr. 2012, 32, 904–915. [Google Scholar] [CrossRef]
- Gibbs, H.K.; Ruesch, A.S.; Achard, F.; Clayton, M.K.; Holmgren, P.; Ramankutty, N.; Foley, J.A. Tropical forests were the primary sources of new agricultural land in the 1980s and 1990s. Proc. Natl. Acad. Sci. USA 2010, 107, 16732–16737. [Google Scholar] [CrossRef] [PubMed]
- Alo, C.A.; Pontius, R.G., Jr. Identifying systematic land-cover transitions using remote sensing and GIS: The fate of forests inside and outside protected areas of Southwestern Ghana. Environ. Plan. B Plan. Des. 2008, 35, 280–295. [Google Scholar] [CrossRef]
- Pontius, R.G., Jr.; Shusas, E.; McEachern, M. Detecting important categorical land changes while accounting for persistence. Agric. Ecosyst. Environ. 2004, 101, 251–268. [Google Scholar] [CrossRef]
- Mundia, C.N.; Aniya, M. Analysis of land use/cover changes and urban expansion of Nairobi city using remote sensing and GIS. Int. J. Remote Sens. 2005, 26, 2831–2849. [Google Scholar] [CrossRef]
- Teixeria, Z.; Teixeria, H.; Marques, J.C. Systematic processes of land use/land cover change to identify driving forces: implications on water quality. Sci. Total Environ. 2014, 470–471, 1320–1335. [Google Scholar] [CrossRef] [PubMed] [Green Version]
- Braimoh, A.K. Random and systematic land-cover transitions in northern Ghana. Agric. Ecosyst. Environ. 2006, 113, 254–256. [Google Scholar] [CrossRef]
- Alo, C.A.; Pontius, R.G., Jr. Detecting the influence of protection on landscape transformation in Southwestern Ghana. In Proceedings of the Joint Meeting of the 15th Annual Conference of The International Environmentrics Society and the Sixth Annual Symposium on Spatial Accuracy Assessment in Natural Resources and Environmental Sciences, Portland, ME, USA, 28 June–1 July 2004. [Google Scholar]
- Lambin, E.F.; Geist, H.J.; Lepers, E. Dynamics of land-use and land-cover change in tropical regions. Annu. Rev. Environ. Resour. 2003, 28, 205–241. [Google Scholar] [CrossRef]
- Mallinis, G.; Koutsias, N.; Arianoutsou, M. Monitoring land use/land cover transformations from 1945 to 2007 in two peri-urban mountainous areas of Athens metropolitan area, Greece. Sci. Total Environ. 2014, 490, 262–278. [Google Scholar] [CrossRef] [PubMed]
- Aldwaik, S.Z.; Pontius, R.G., Jr. Intensity analysis to unify measurements of size and stationarity of land changes by interval, category and transition. Landsc. Urban Plan. 2012, 106, 103–114. [Google Scholar] [CrossRef]
- Aldwaik, S.Z.; Pontius, R.G., Jr. Map errors that could account for deviations from a uniform intensity of land change. Int. J. Geogr. Inf. Sci. 2013, 27, 1717–1739. [Google Scholar] [CrossRef]
- Gereta, E.; Mwangomo, E.; Wolanski, E. Ecohydrology as a tool for the survival of the threatened Serengeti ecosystem. Ecohydrol. Hydrobiol. 2009, 9, 115–124. [Google Scholar] [CrossRef]
- Kiragu, G.M. Assessment of Sediment Loadings and Their Impact on the Environmental Flows of the Upper Transboundary Mara River, Kenya. Master’s Thesis, Jomo Kenyatta University of Agriculture and Technology, Nairobi, Kenya, 2009. [Google Scholar]
- Mati, B.M.; Mutie, S.; Gadain, H.; Home, P.; Mtalo, F. Impacts of land-use/cover change on the hydrology of the transboundary Mara River, Kenya/Tanzania. Lakes Reserv. Res. Manag. 2008, 13, 169–177. [Google Scholar] [CrossRef]
- Yuan, Y.; Li, B.; Gao, X.; Liu, H.; Xu, L.; Zhou, C.A. method of characterizing land-cover swap changes in the arid zone of China. Front. Earth Sci. 2016, 10, 74–86. [Google Scholar] [CrossRef]
- Fuchs, R.; Herold, M.; Verbung, P.H.; Clevers, J.G.P.W.; Eberle, J. Gross changes in reconstructions of historic land cover/use for Europe between 1900 and 2010. Glob. Chang. Biol. 2015, 21, 299–313. [Google Scholar] [CrossRef] [PubMed]
- Pilaš, I.; Feger, K.H.; Vilhar, U.; Wahren, A. Multidimensionality of scales and approaches for forest–water interactions. In Forest Management and the Water Cycle—An Ecosystem-Based Approach—Ecological Studies; Bredemeier, M., Cohen, S., Godbold, D.L., Lode, E., Pichler, V., Schleppi, P., Eds.; Springer: Dordrecht, The Netherlands; Heidelberg, Germany; London, UK; New York, NY, USA, 2010; Volume 212, pp. 351–380. ISBN 978-90-481. [Google Scholar]
- National Environment Management Authority—NEMA. Mau Complex at a Glance-Report; National Environment Management Authority: Nairobi, Kenya, 2013.
- Government of Kenya—GoK. Report of the Prime Minister’s Task Force on the Conservation of the Mau Forest Complex; Government of Kenya: Nairobi, Kenya, 2009.
- Serneels, S.; Said, M.Y.; Lambin, E.F. Land cover changes around a major east African wildlife reserve: The Mara Ecosystem (Kenya). Int. J. Remote Sens. 2001, 22, 3397–3420. [Google Scholar] [CrossRef]
- Phiri, D.; Morgenroth, J. Developments in Landsat Land Cover Classification Methods: A Review. Remote Sens. 2017, 9, 967. [Google Scholar] [CrossRef]
- Young, N.E.; Anderson, R.S.; Chignell, S.M.; Vorster, A.G.; Lawrence, R.; Evangelista, P.H. A survival guide to Landsat preprocessing. Ecology 2017, 98, 920–932. [Google Scholar] [CrossRef] [PubMed]
- Government of Kenya—GoK. Land Use Map of Kenya; Produced by Survey of Kenya (500/3/83), Kenya Rangeland Ecological Monitoring Unit; Ministry of Environment and Natural Resources: Nairobi, Kenya, 1983.
- FAO. Multipurpose Landcover Database for Kenya (Africover). Food and Agriculture Organization of United Nations (FAO). 2002. Available online: http://www.fao.org/geonetwork/srv/en/metadata.show?id=38098&currTab=simple (accessed on 30 October 2017).
- Pontius, R.G., Jr.; Gao, Y.; Giner, N.M.; Kohyama, T.; Osaki, M.; Hirose, K. Design and interpretations of Intensity Analysis illustrated by land change in Central Kalimantan, Indonesia. Land 2013, 2, 351–369. [Google Scholar] [CrossRef]
- Enaruvbe, G.O.; Pontius, R.G., Jr. Influence of classification errors on intensity analysis of land changes in Southern Nigeria. Int. J. Remote Sens. 2015, 36, 244–261. [Google Scholar] [CrossRef]
- Zaehringer, J.G.; Eckert, S.; Messerli, P. Revealing regional deforestation dynamics in North-Eastern Madagascar—Insights from multi-temporal land cover change analysis. Land 2015, 4, 454–474. [Google Scholar] [CrossRef]
- Norton-Griffiths, M.; Said, M.Y.; Serneels, S.; Kaelo, D.S.; Coughenour, M.; Lamprey, R.H.; Thompson, D.M.; Reid, R.S. Land use economics in the Mara area of the Serengeti ecosystem. In Serengeti III: Human Wildlife Interactions; Sinclair, A.R.E., Packer, C., Mduma, S.A.R., Fryxell, J.M., Eds.; University of Chicago Press: Chicago, IL, USA, 2008; ISBN 9780226760346. [Google Scholar]
- Thompson, D.M.; Serneels, S.; Ole Kaelo, D.; Trench, P.C. Maasai Mara—Land privatisation and wildlife decline: Can conservation pay its way? In Staying Maasai? Livelihoods, Conservation and Development in East African Rangelands; Homewood, K., Kristjanson, P., Trench, P., Eds.; Springer: New York, NY, USA, 2009; pp. 77–114. ISBN 978-0-387-87492-0. [Google Scholar]
- Matiru, V. Forest Cover and Forest Reserves in Kenya: Policy and Practice; IUCN: Nairobi, Kenya, 1999. [Google Scholar]
- Nkako, F.M.; Lambrechts, C.; Gachanja, M.; Woodley, B. Maasai Mau Forest Status Report 2005; Ewaso Ngiro South Development Authority: Narok, Kenya, 2005. [Google Scholar]
- Akotsi, E.F.N.; Gachanja, M. Changes in Forest Cover in Kenya’s Five Water Towers 2000–2003; Project Report; Department of Resource Surveys and Remote Sensing (DRSRS) and Kenya Forest Working Group (KFWG): Nairobi, Kenya, 2004. [Google Scholar]
- UNEP and GoK. Mau Complex and Marmanet Forests Environmental and Economic Contributions Current State and Trends. Briefings Notes Compiled by the Team that Participated in the Reconnaissance Flight on 7 May 2008, in Consultation with Relevant Government Departments. United Nations Environment Programme (UNEP) and Government of Kenya (GoK). 2008. Available online: http://staging.unep.org/pdf/Mau-Complex_20May08.pdf (accessed on 27 October 2017).
- Were, K.O.; Dick, Ø.B.; Singh, B.R. Remotely sensing the spatial and temporal land cover changes in Eastern Mau forest reserve and Lake Nakuru drainage basin, Kenya. Appl. Geogr. 2013, 41, 75–86. [Google Scholar] [CrossRef]
- Petursson, J.G.; Vedeld, P.; Sassen, M. An institutional analysis of deforestation processes in protected areas: The case of the transboundary Mt. Elgon, Uganda and Kenya. For. Policy Econ. 2013, 26, 22–33. [Google Scholar] [CrossRef]
- Olang, L.O.; Kundu, P.M. Land Degradation of the Mau Forest Complex in Eastern Africa: A Review for Management and Restoration Planning. 2011. Available online: http://www.intechopen.com/books/environmental-monitoring/land-degradation-of-the-mau-forest-complex-in-eastern-Africa-a-review-for-management-and-restoration (accessed on 1 September 2016).
- Standing, A.; Gachanja, M. The Political Economy of REDD+ in Kenya Identifying and Responding to Corruption Challenges. Anti-Corruption Resource Centre, 2014. Available online: http://www.u4.no/publications/the-political-economy-of-redd-in-kenya-identifying-and-responding-to-corruption-challenges/ (accessed on 13 October 2017).
- Cavanagh, C.J.; Vedeld, P.O.; Trædal, L.T. Securitizing REDD+? Problematizing the emerging illegal timber trade and forest carbon interface in East Africa. Geoforum 2015, 60, 72–82. [Google Scholar] [CrossRef]
- Waller, R.D. Tsetse fly in Western Narok, Kenya. J. Afr. Hist. 1990, 31, 81–101. [Google Scholar] [CrossRef]
- Ng’ethe, J.C. Group ranch concept and practice in Kenya with special emphasis on Kajiado district, FAO. In Proceedings of the Future of Livestock Industries in East and Southern Africa, Kadoma, Zimbabwe, 20–23 July 1992; Kategile, J.A.S., Mubi, S., Eds.; International Livestock Centre for Africa: Brussels, Belgium, 1993. [Google Scholar]
- Ole Sadera, P.L.K. Group Ranches in Kenya. In Proceedings of the Conference on Range Development and Research in Kenya, Njoro, Kenya, 1–5 April 1986. [Google Scholar]
- Wanyumba, G. A Review of Special Land Tenure Issues in Kenya. Paper presented at the Expert Group Meeting on Secure Land Tenure: Non-legal Frameworks and Tolls. FIG (International Federation of Surveyors) Commission 7, ISK (Institution of Surveyors of Kenya), UN-HABITAT & CASLE (Commonwealth Association of Surveying and Land Economy), Nairobi, Kenya, 10–12 November 2004; Available online: https://www.fig.net/resources/proceedings/2004/nairobi_2004_comm7/papers/ts_06_3_wayumba.pdf (accessed on 30 October 2017).
- Government of Kenya—GoK. Land (Group Representative) Act, Cap 287 of 1968; Government of Kenya, Government Printers: Nairobi, Kenya, 1968.
- Kimani, K.; Pickard, J. Recent trends and implications of group ranch sub-division and fragmentation in the Kajiando District, Kenya. Geogr. J. 1998, 164, 202–213. [Google Scholar] [CrossRef]
- Thompson, M.; Homewood, K. Entrepreneurs, elites, and exclusion in Maasailand: Trends in wildlife conservation and pastoralist development. Hum. Ecol. 2002, 30, 107–138. [Google Scholar] [CrossRef]
- Snider, R.T. Land Tenure, Ecotourism, and Sustainable Livelihoods: “Living on the Edge” of the Greater Maasai Mara, Kenya. Ph.D. Thesis, University of Waterloo, Waterloo, ON, Canada, 2012. [Google Scholar]
- Zeppel, H. Indigenous Ecotourism: Sustainable Development and Management; CABI: Wallingford, UK, 2006; ISBN 978-1-84593-124-7. [Google Scholar]
- Jaetzold, R.; Schmidt, H. Farm Management Handbook of Kenya, Vol. II.—Natural Conditions and Farm Management Information. Part B, Central Kenya (Rift Valley and Central Provinces); Ministry of Agriculture: Nairobi, Kenya, 1983.
- Manyara, G.; Jones, E. Community-based tourism enterprises development in Kenya: An exploration of their potential as avenues of poverty reduction. J. Sustain. Tour. 2007, 15, 628–644. [Google Scholar] [CrossRef]
- Sørlie, E.B. The Establishment of Wildlife Conservancies in the Mara: The Case of Olare Orok Conservancy. Master’s Thesis, University of Oslo, Oslo, Norway, 2008. [Google Scholar]
- Osano, P.M.; Said, M.Y.; de Leeuw, J.; Ndiwa, N.; Kaelo, D.; Schomers, S.; Birner, R.; Ogutu, J.O. Why keep lions instead of livestock? Assessing wildlife tourism-based payment for ecosystem services involving herders in the Maasai Mara, Kenya. Nat. Resour. Forum 2013, 37, 242–256. [Google Scholar] [CrossRef]
- Homewood, K.M.; Trench, P.C.; Brockington, D. Pastoralist livelihoods and wildlife revenues in East Africa: A case for coexistence? Res. Policy Pract. 2012, 2, 19. [Google Scholar] [CrossRef]
- Recha, J.W.; Lehmann, J.; Walter, M.T.; Pell, A.; Verchot, L.; Johnson, M. Stream discharge in tropical headwater catchments as a result of forest clearing and soil degradation. Earth Interact. 2012, 16. [Google Scholar] [CrossRef]
- Julich, S.; Mwangi, H.M.; Feger, K.H. Forest Hydrology in the Tropics. In Tropical Forestry Handbook, 2nd ed.; Pancel, L., Köhl, M., Eds.; Springer: Berlin/Heidelberg, Germany, 2016; pp. 1917–1939. ISBN 978-3-642-41554-8. [Google Scholar]
- Ogutu, J.O.; Piepho, H.P.; Dublin, H.T.; Bhola, N.; Reid, R.S. Dynamics of Mara-Serengeti ungulates in relation to land use changes. J. Zool. 2009, 278, 1–14. [Google Scholar] [CrossRef]
- Kinyanjui, M.J.; Shisanya, C.A.; Nyabuti, O.K.; Waqo, W.P.; Ojwala, M.A. Assessing tree species dominance along an agro ecological gradient in the Mau Forest Complex, Kenya. Open J. Ecol. 2014, 4, 662–670. [Google Scholar] [CrossRef]
- Muiruri, M.N.; Maundu, P. Birds, people and conservation in Kenya. In Ethno-Ornithology: Birds, Indigenous Peoples and Culture and Society; Tidemann, S., Gosler, A., Eds.; Earthscan: London, UK, 2010; ISBN 978-1-84407-783-0. [Google Scholar]
- Klopp, J.M.; Sang, J.K. Maps, power, and the destruction of the Mau forest in Kenya. Georget. J. Int. Aff. 2011, 12, 125–134. [Google Scholar]
- Mwangi, H.M.; Julich, S.; Feger, K.H. Watershed management practices in the tropics. In Tropical Forestry Handbook, 2nd ed.; Pancel, L., Köhl, M., Eds.; Springer: Berlin/Heidelberg, Germany, 2016; pp. 1897–1915. ISBN 978-3-642-41554-8. [Google Scholar]
Figure 1.
Mara River Basin in East Africa with major categories of land use.

Figure 2.
Land-use/cover maps of the Mara River Basin for years 1976, 1985, 1995, 2003, and 2014.

Figure 3.
Transition to small-scale agriculture (1976–1985 interval).

Figure 4.
Transition to mechanized agriculture (2003–2014 interval).


Table 1.
Categories of annual land change (km2/year) during the four intervals.
| 1976–1985 | 1985–1995 | 1995–2003 | 2003–2014 | |||||||||
|---|---|---|---|---|---|---|---|---|---|---|---|---|
| Change | Total | Net | Swap (%) | Total | Net | Swap (%) | Total | Net | Swap (%) | Total | Net | Swap (%) |
| Closed forest | 64.6 | 23.3 | 63.9 | 91.8 | 6.10 | 93.4 | 112.5 | −9.7 | 91.4 | 50.4 | −36.0 | 28.6 |
| Open forest | 141.2 | −96.7 | 31.5 | 67.2 | −26.3 | 61.0 | 67.4 | −4.6 | 93.2 | 32.1 | −2.6 | 92.0 |
| Small scale agriculture | 94.1 | 14.5 | 84.6 | 122.0 | 60.6 | 50.3 | 159.5 | 81.3 | 49.0 | 94.0 | 12.9 | 86.2 |
| Mechanized agriculture | 1.8 | 1.6 | 14.4 | 2.8 | 0.0 | 98.9 | 3.7 | 1.6 | 58.1 | 5.6 | 3.5 | 38.4 |
| Rangeland | 146.2 | 57.4 | 60.8 | 138.3 | −41.4 | 70.1 | 205.2 | −69.4 | 66.2 | 102.6 | 22.1 | 78.5 |
| Tea plantation | 0.0 | 0.0 | 0.0 | 0.9 | 0.9 | 0.0 | 2.6 | 0.8 | 68.2 | 2.0 | 0.1 | 96.6 |
| Overall change | 224.0 | 96.7 | 56.8 | 211.5 | 67.6 | 68.0 | 275.5 | 83.7 | 69.6 | 143.4 | 38.6 | 73.1 |
Total = gross gain + gross loss; Net = gross gain − gross loss; Swap (%) = ((Total − Net)/Total)) × 100.
Table 2.
Land-use transitions between categories with a special focus on deforestation.
| 1976–1985 | 1985–1995 | 1995–2003 | 2003–2014 | |||||
|---|---|---|---|---|---|---|---|---|
| (a) Transition to small-scale agriculture (TI values as % of respective categories at the start of respective intervals) | ||||||||
| UI = 0.55 | UI = 0.93 | UI = 1.31 | UI = 0.63 | |||||
| Losing categories | TI | EI | TI | EI | TI | EI | TI | EI |
| Closed forest | 0.74 | 27.45 | 1.56 | 44.23 | 1.32 | 0.87 | 1.47 | 61.43 |
| Open forest | 1.79 | 72.91 | 6.28 | 93.90 | 7.69 | 92.66 | 2.82 | 83.52 |
| Mechanized agriculture | 0.0 | (100) | 1.22 | 25.95 | 3.76 | 72.65 | 1.67 | 66.99 |
| Rangeland | 0.30 | (46.59) | 0.49 | (49.59) | 1.06 | (21.15) | 0.43 | (32.89) |
| Tea plantation | 3.92 | 74.29 | 4.51 | 92.47 | ||||
| (b) Transition to open forest (TI values as % of respective categories at the start of respective intervals) | ||||||||
| UI = 0.24 | UI = 0.20 | UI = 0.31 | UI = 0.14 | |||||
| Losing categories | TI | EI | TI | EI | TI | EI | TI | EI |
| Closed forest | 1.3 | 83.09 | 0.29 | 29.37 | 0.90 | 67.80 | 0.63 | 78.39 |
| Small-scale agriculture | 1.28 | 82.87 | 0.86 | 77.69 | 0.83 | 64.87 | 0.23 | 39.29 |
| Mechanized agriculture | 0.0 | (100) | 1.18 | 84.33 | 0.01 | (95.54) | 0.12 | (14.25) |
| Rangeland | 0.05 | (78.51) | 0.13 | (37.21) | 0.14 | (56.32) | 0.06 | (60.89) |
| Tea plantation | 1.21 | 78.69 | 0.54 | 74.70 | ||||
UI = Uniform intensity (% of the size of other categories, excluding the concerned category); TI = Transition intensity; EI = Error intensity (% of transition). EI values in parentheses are Omission intensity; EI values without parentheses are Commission intensities. (Bold TI values indicate that the land-use category is targeted (for gain or loss) by the land-use change involved, non-bold TI values indicate the land-use category is avoided by the concerned change).
Table 3.
Land-use transitions between categories with special focus on the expansion of agriculture.
Table 3.
Land-use transitions between categories with special focus on the expansion of agriculture.
| 1976–1985 | 1985–1995 | 1995–2003 | 2003–2014 | |||||
|---|---|---|---|---|---|---|---|---|
| Transition to mechanized agriculture (TI values as % of respective categories at the start of respective intervals) | ||||||||
| UI = 0.02 | UI = 0.01 | UI = 0.02 | UI = 0.04 | |||||
| Losing categories | TI | EI | TI | EI | TI | EI | TI | EI |
| Closed forest | 0 | (81.12) | 0.0 | (97.10) | 0.01 | (79.40) | 0.02 | (48.63) |
| Open forest | 0.05 | 65.30 | 0.01 | (37.40) | 0.03 | 6.60 | 0.03 | (21.78) |
| Small-scale agriculture | 0.01 | (55.89) | 0.02 | 15.07 | 0.02 | (26.28) | 0.11 | 61.64 |
| Rangeland | 0.01 | (22.44) | 0.02 | 10.57 | 0.03 | 13.07 | 0.02 | (37.93) |
| Tea plantation | 0 | (100) | 0.03 | (18.33) | ||||
UI = Uniform intensity (% of the size of other categories, excluding the concerned category)); TI = Transition intensity; EI = Error intensity (% of transition). EI values in parentheses are Omission intensity; EI values without parentheses are Commission intensities. (Bold TI values indicate that the land-use category is targeted by (loses to) mechanized agriculture, non-bold TI values indicate the land-use category is avoided by gain in mechanized agriculture).
© 2017 by the authors. Licensee MDPI, Basel, Switzerland. This article is an open access article distributed under the terms and conditions of the Creative Commons Attribution (CC BY) license (http://creativecommons.org/licenses/by/4.0/).
Share and Cite
MDPI and ACS Style
Mwangi, H.M.; Lariu, P.; Julich, S.; Patil, S.D.; McDonald, M.A.; Feger, K.-H. Characterizing the Intensity and Dynamics of Land-Use Change in the Mara River Basin, East Africa. Forests 2018, 9, 8. https://doi.org/10.3390/f9010008
AMA Style
Mwangi HM, Lariu P, Julich S, Patil SD, McDonald MA, Feger K-H. Characterizing the Intensity and Dynamics of Land-Use Change in the Mara River Basin, East Africa. Forests. 2018; 9(1):8. https://doi.org/10.3390/f9010008
Chicago/Turabian StyleMwangi, Hosea M., Padia Lariu, Stefan Julich, Sopan D. Patil, Morag A. McDonald, and Karl-Heinz Feger. 2018. "Characterizing the Intensity and Dynamics of Land-Use Change in the Mara River Basin, East Africa" Forests 9, no. 1: 8. https://doi.org/10.3390/f9010008
Note that from the first issue of 2016, this journal uses article numbers instead of page numbers. See further details here.