Improved Water Consumption Estimates of Black Locust Plantations in China’s Loess Plateau


1
Institute for Integrated Management of Material Fluxes and of Resources (UNU-FLORES), United Nations University, 01067 Dresden, Germany
2
Institute of Soil Science and Site Ecology, Faculty of Environmental Sciences, Technische Universität Dresden, 01737 Tharandt, Germany
*
Author to whom correspondence should be addressed.
Forests 2018, 9(4), 201; https://doi.org/10.3390/f9040201
Submission received: 7 March 2018
/
Revised: 27 March 2018
/
Accepted: 11 April 2018
/
Published: 11 April 2018
(This article belongs to the Special Issue Afforestation and Reforestation: Drivers, Dynamics, and Impacts)
Abstract
:Black locust (Robinia pseudoacacia L.) is a major tree species in China’s large-scale afforestation. Despite its significance, black locust is underrepresented in sap flow literature; moreover, the published water consumption data might be biased. We applied two field methods to estimate water consumption of black locust during the growing seasons in 2012 and 2013. The application of Granier’s original sap flow method produced a very low transpiration rate (0.08 mm d−1) while the soil water balance method yielded a much higher rate (1.4 mm d−1). A dye experiment to determine the active sapwood area showed that only the outermost annual ring is responsible for conducting water, which was not considered in many previous studies. Moreover, an in situ calibration experiment was conducted to improve the reliability of Granier’s method. Validation showed a good agreement in estimates of the transpiration rate between the different methods. It is known from many studies that black locust plantations contribute to the significant decline of discharge in the Yellow River basin. Our estimate of tree transpiration at stand scale confirms these results. This study provides a basis for and advances the argument for the development of more sustainable forest management strategies, which better balance forest-related ecosystem services such as soil conservation and water supply.
1. Introduction
Accurate estimates of tree transpiration are needed not only for the management of a forest and its water-related services, but also for understanding a forest’s response to climate and other changing environmental conditions to identify risks and manage them accordingly. Such estimates are usually obtained by measuring the speed of xylem sap movement through the stem using heat sensors. Three different systems of heat sensors are commonly used [1]: (i) heat pulse velocity sensors; (ii) heat field deformation sensors; and (iii) thermal dissipation sensors. Vandegehuchte and Steppe [2] discussed the working principles and applicability of these sensors in detail, which we will not include in this work.
Previous sap flow studies have demonstrated that multiple issues can introduce errors in the measurement of sap flow and estimate of stand transpiration rates: ignoring the radial variability in sap flow [3], neglecting nocturnal fluxes [4,5,6], sensor installation into non-conducting sapwood [7,8], errors in scaling-up sap flow measurements within the tree stem and over the ecosystem [9], wounding of sapwood due to sensor installation [10], diel dynamics in stem water content [11,12], or using universal sensor calibration instead of species-specific calibration [13,14,15]. Research on the reliability of the sap flow technique suggests that most of these sources of error can probably be minimized [16]. However, the remaining uncertainty and thus confidence in the results need to be assessed [17].
Black locust (Robinia pseudoacacia L.) is one of the most frequently cultivated broad-leaved tree species in the world [18]. Black locust was one of the first North American tree species introduced to Europe in the early 17th century [19] and is one of the three most widely distributed non-native plant species in Europe [20]. Outside of Europe, black locust has been introduced to temperate Asia, Australia, and New Zealand. For instance, black locust plays a major role in China’s large-scale afforestation programs, particularly in the drylands of the north-western and northern regions. These afforestation programs aim to control desertification and soil erosion [21]. At present, the area covered by black locust plantations is the largest among the planted forests in China’s Loess Plateau region [22]. Despite this significance, very few studies have estimated the water budget of black locust plantations, which is crucial scientific knowledge for water resources management in dryland areas [23,24,25].
The transpiration of trees is commonly determined using thermal dissipation sensors (i.e., Granier’s method) [26]. Granier’s method measures the temperature differential between heated and unheated probes and relates the normalized temperature differential to the sap flow density through a universal calibration equation [10]. This equation was derived by Granier using three stem segments of Pseudotsuga menziesii, Pinus nigra, and Quercus pedunuculata. In these laboratory calibration experiments, water was forced through these samples under varying pressure, and the flow rate was determined simultaneously by weighing the exudates and by using the thermal dissipation sensor. It has yet to be acknowledged that the universal calibration equation substantially underestimates sap flow, at least when it is used for other ring-porous tree species [27].
Despite its widespread significance, black locust is underrepresented in the international sap flow literature in contrast to other tree species. An online search in databases, such as Scopus, Web of Science, and Google Scholar, produced merely eleven hits on the topic of sap flow measurements in black locust stands. In contrast, Scopus listed 37 results for sap flow measurements in spruce (Picea abies) and 29 results in beech (Fagus sylvatica) for a short period from 2010 to 2016. Only eight out of the abovementioned eleven studies provide estimates of black locust stand transpiration. These eight studies were carried out in different black locust stands across the Loess Plateau. With the exception of two studies [15,28], the different experimenters acknowledged that their daily transpiration rates were exceptionally low [23,24,25,29,30,31]. The latter group of experimenters reported daily transpiration averages of ≤0.5 mm d−1. This is surprisingly lower than what is believed and contrary to the generally accepted fact that afforestation in the Loess Plateau region resulted in a significant discharge reduction through the elevated evapotranspiration [32,33,34,35]. This led to a mismatch of the scientific evidence between plot measurement/estimation and watershed observation/investigation.
Several authors [13,14] have recommended developing tree-specific calibration equations for Granier’s method in ring-porous tree species to ensure a more accurate estimate of sap flow [27]. However, to our knowledge, only one group of the abovementioned experimenters [15,23,24,25,28,29,30,31] have heeded this advice when applying the Granier’s method for measuring sap flow in black locust. Thus, we believe that black locust is not only understudied in international sap flow literature but also that the published values of black locust sap flow may be biased due to the lack of tree-specific calibration. Furthermore, we postulate that the underestimation in black locust sap flow is probably caused by overestimation of the conducting sapwood area. Black locust is a ring-porous tree species; it is generally accepted that trees falling into this classification have water conduction mainly through the large vessels of the outermost growth ring [36].
The most common method for tree-specific calibration of sap flow sensors is the laboratory calibration conducted on excised stems [13,14] or cut branches [8]. In most of these laboratory studies, water is pulled through stem segments or cut branches using a pump or by maintaining a constant head of water pressure on cut stem segments. A question may therefore arise: does calibration obtained under laboratory conditions deliver a reliable estimate of sap flow under field conditions? The cut tree technique was developed for in situ validation of sap flow measurement systems under natural conditions [37,38]. To our knowledge, this technique has not yet been applied for the calibration of thermal dissipation sensors.
In view of the identified knowledge gaps and the importance of accurate estimate of tree transpiration for managing forest and water resources as well as related services, the objectives of this paper are threefold: (i) estimate tree transpiration of a black locust stand using two different methods, namely, Granier’s original calibration and soil water balance method, and compare the reliability of the two methods; (ii) identify the possible sources of error for the underestimated tree transpiration from Granier’s original calibration based on analyses of other published studies and discuss their impacts; and (iii) improve the accuracy of tree transpiration estimation of Granier’s method by applying a tree-specific calibration, for which an easy-to-install measurement setup for the in situ calibration of Granier’s sensor system in living trees is developed and applied; additionally, the reliability of the obtained calibration is validated.
2. Materials and Methods
2.1. Study Site
In situ calibration and measurement of sap flow of black locust were carried out in the Zhonggou catchment (35°20′ N, 107°31′ E), which is a small catchment in the semi-humid gully region of the Loess Plateau in the upper reaches of the Jing River (Gansu Province, NW China). The catchment is 14 km2 in size with an elevation ranging between 1000 and 1300 m a.s.l. According to the long-term records (1990–2007) of the nearby Jingchuan hydrological station, the average annual temperature is 10.2 °C, the average annual potential evapotranspiration is 1395 mm a−1, and the mean annual precipitation is 590 mm a−1. The catchment is covered by loess deposits with a thickness of 50–80 m. The soil is classified as Calcaric Regosols (IUSS working group WRB, 2006) with a silt loam texture [39]. Eighty-three per cent of the catchment is covered by forests, mainly by black locust. The measurement plot was established in 1990 by planting black locust saplings. This plot covers an area of 2050 m2 and comprises 206 trees (1006 trees per ha) with a basal area of 2.2 m2 ha−1. The summer maximum leaf area index (LAI) of the stand varied between 2.4 and 2.8 (measured using the optical instrument LAI 2000-PCA, LI-COR Inc., USA). In 2012, the average tree height and diameter at breast height (DBH) were 11.8 m and 10.7 cm, respectively (see Table 1). The understory consists mainly of grasses (Melilotus suaveolens, Astragalus adsurgens, Onobrychis taneitica, Equisetum arvense, Juncus bufonius, Pennisetum centrasiaticum, Phragmites communis, Setaria viridis, and Chenopodium album) as well as some shrubs such as Amorpha fruticosa, Prunus davidiana, Hippophae rhamnoides, Syringa persica, Caragana korshinskii, and Xanthocera sorbifolia.
2.2. Continuous Field Measurements
2.2.1. Weather Stations
An open-land weather station was installed in 2012, approximately 300 m east of the black locust stand. Wind direction and wind speed (Thies, Germany), global radiation and net radiation (Kipp & Zonen, Delft, The Netherlands), air temperature and relative humidity, soil temperature at different depths, and temperature at the soil surface were measured at 15-min intervals. A tipping bucket system with heating (Lambrecht, Göttingen, Germany) was used to measure the precipitation. An automatic weather station was also placed under the black locust canopy to measure air and soil temperature, relative humidity, as well as global and net radiation (Kipp & Zonen, The Netherlands). Two throughfall troughs (each 5 m long and 0.16 m wide and made of stainless steel) were installed beneath the black locust canopy. The troughs drain into a tipping bucket. The throughfall troughs operate only during the growing season from the end of March until the middle of October.
2.2.2. Quantifying Total Evapotranspiration
For the estimation of total evapotranspiration, ETtotal, the soil water depletion method was applied. This method relies on simultaneous measurements of soil pressure head and soil water content as a function of time and depth [41]. For the measurement of soil water dynamics, a wireless sensor network (Forschungszentrum Jülich, Jülich, Germany) was installed. Details of this network can be found in Bogena et al. [42].
In our study, soil water content under the black locust canopy was measured using spade sensors (sceme.de GmbH, Horn-Bad Meinberg, Germany). The spade sensor is a time domain transmission sensor. The general operating principle of these sensors is similar to that of time domain reflectometry (TDR) sensors [43]. The spade sensor consists of a sensor head (8.0 cm long, 3.0 cm wide, 1.0 cm thick) and a transmission line embedded in a four-layer epoxy printed circuit board (14.0 cm long, 3.0 cm wide, 0.2 cm thick). With this sensor, not only the soil water content, but also the soil temperature, can be measured. The measurement resolution of the sensor is 0.01 [m3 m−3].
We established soil water content measurements on a 420 cm long transect between two trees. The leaf canopies of these trees touch each other and partly overlap. Sensors at the start and the end of the transect were not installed next to the trunks but at a distance of about 100 cm from them. When mounting the spade sensors, hand shovels were used to dig narrow trenches (<10 cm wide, ca. 100 cm long, and up to a depth of 100 cm) perpendicular to the transect. To minimize the effects of sensor installation on root water uptake, we managed to avoid cutting roots with diameters larger than 0.2 cm during the excavations. To insert the sensors into the soil, holes for the sensor heads were pre-drilled into the soil profile wall. This procedure ensures a minimal soil disturbance and soil compaction.
In total, 36 sensors were placed at six depths with a horizontal distance of 60 cm between them. Sensors were placed at the depths of 5, 20, and 40 cm with eight replications and at the depths of 60, 80, and 100 cm with four replications. The depths of sensor installation and the corresponding replications were chosen according to the mapped root density distribution. Soil pressure head was measured at the depths of 20, 40, 60, and 80 cm using a pF-meter (ecoTech, Bonn, Germany). A pF-meter measures the heat capacity in a porous equilibrium body. Based on a sensor-specific calibration curve (provided by the manufacturer), the measured heat capacity can be converted to soil pressure head values (measurement range: pF 0.0 to pF 7.0). The pF-meter was installed vertically in the middle of the abovementioned transect. Soil water contents and pressure head values were automatically recorded every 30 min. Deriving the evapotranspiration rates from the soil water balance requires knowledge of the location of the zero-flux-plane (ZFP) within the soil profile. The location of the ZFP was determined by calculating the hydraulic gradients using the measured pressure head data as shown in Khalil et al. [44].
Total evapotranspiration (sum of understory and overstory water uptake of the plant roots), ETtotal [mm d−1], between times t1 and t2 was then calculated from the measured soil water content changes as follows [41]:
where Pnet is the net precipitation measured using the throughfall troughs [mm d−1], W is the depth of the ZFP [m], is the soil water content measured by spade sensors (sceme.de GmbH, Germany) [m3 m−3], and z is the vertical coordinate [m]. For the calculation of ETtotal, soil water depletion was first balanced on a daily scale for each sensor, then averaged for each soil depth, and finally summed with respect to the depth of the ZFP.
2.2.3. Quantifying Understory Transpiration
To quantify the transpiration of the understory (grass), a weighable lysimeter was installed under the black locust canopy. The lysimeter consists of a container (2.5 m high, 2.3 m long, 1.5 m wide) made of polyethylene (PE-HD), a lysimeter vessel made of stainless steel with a surface area of 1.0 m2 and a length of 1.7 m filled with undisturbed soil, a weighing system, and a unit for the control of soil moisture and soil temperature at the lower bottom of the lysimeter. The container is water-tight and air-tight with two circular openings at the top; one opening served as an access hatch and the other opening was for the lysimeter vessel. Details of the installation and setup of the lysimeter can be found in Podlasly and Schwärzel [45].
At the lower bottom of the lysimeter, suction cups, tensiometers, temperature sensors, cooling coil, and hoses were embedded into the soil for the automatic regulation of soil temperature and soil pressure at the lower boundary of the lysimeter. A detailed description of the working principle of the automated control of the lower boundary of the lysimeter is given in Podlasly and Schwärzel [45]. Finally, six spade sensors (sceme.de GmbH, Horn-Bad Meinberg, Germany) for the automatic measurement of the soil water content were installed at the depths of 5, 15, 25, 50, 100, and 150 cm of the soil monolith. The spade sensors were described in greater detail above.
The measurement resolution of the weighing system of the lysimeter is 30 g, which corresponds to a water equivalent of 0.03 mm. The weight of the lysimeter vessel and the abovementioned soil water content readings were logged every 30 min. Decreases in the weight of the lysimeter are caused by transpiration of the vegetation and by evaporation from the soil. Thus, we use the term evapotranspiration of understory (ETus) when referring to water consumption quantified by the weighable lysimeter.
Daily evapotranspiration rates of the understory, ETus, [mm d−1] were calculated as follows:
where Pnet is the net precipitation (measured by throughfall troughs) [mm d−1], S is the seepage water collected at the bottom of the lysimeter [mm d−1], ΔW is the change in the mass of the lysimeter [1 kg d−1 = 1 L3 m−2 d−1 = 1 mm d−1], and ΔT is the amount of water removed or added as a result of controlling the pressure head at the lower bottom of the lysimeter [1 kg d−1 = 1 L3 m−2 d−1 = 1 mm d−1].
2.2.4. Quantifying Overstory Transpiration
To quantify tree transpiration, Granier-style sap flow sensors were used. Probes were 20 mm long with a diameter of 1.5 mm (Ecomatik, Dachau, Germany). Altogether, fourteen trees (range of the DBH of the sample trees: 10 to 17 cm) were equipped with sap flow sensors. Twelve pairs of sensors were mounted on the northern side of the stem of twelve trees, and eight pairs of sensors were installed on the eastern and northern side of the two other trees. The vertical distance between the needles was 150 mm. The sensors were shielded from radiation and rain using Styrofoam covered with reflective material. The upper needles were heated by a constant current source (0.2 W, 84 mA); the lower needles were unheated. Temperature differences between the sensors were measured at 60 s intervals and stored as 60-min averages by the data logger.
Hourly sap flow densities, Fd [kg3 m−2 h−1], were calculated from observed temperature differences by Equation (3), according to Granier [26]:
where k is the dimensionless, normalized sensor output, ΔT [K] is the actual measured temperature difference between the two needles, ΔTM [K] is the value of ΔT when sap flux density is zero, the coefficient a (0.119 kg m−2 s−1) and the exponent b (1.231) are Granier’s original fitting parameters.
As aforementioned, installation of sensors in non-conducting sapwood [7] or ignoring the radial variability in sap flow [3] may result in significant underestimation of sap flow densities. The latter plays a minor role in ring-porous trees such as black locust. In ring-porous trees, only the outermost annual tree ring (i.e., active sapwood area) is responsible for conducting water [3]. To verify it, the tree-cutting technique (see Section 2.3) was applied to visualize water-conduction pathways in living black locust trees, in which we used dye—an aqueous solution of 0.1% acid fuchsin—similar to the procedure of Sano et al. [46]. To determine the active sapwood thickness, ten trees—with similar DBH to the trees used for the sap flow measurements—were harvested and the individual tree-ring width of the outermost ring was measured using stem disc at breast height. Based on these results, a regression between the DBH and the corresponding sapwood area was derived. This relationship was used to calculate the total sapwood area of the plot using the frequency of the tree’s DBH. However, due to the very small active sapwood thickness, it is impossible to install the sensors without touching the non-conducting sapwood. To reduce the potential errors caused by sensor installation in non-conducting sapwood, a correction procedure following Clearwater et al. [7] was applied in preliminary tests. Despite the reduced errors from the correction, it may still have some uncertainties from an unknown source, as reported by Bush et al. [14].
To consider potential nocturnal fluxes due to both transpiration and recharge, ΔTM was determined using the software BaseLiner (developed by Ram Oren’s C-H2O Ecology Lab Group at the Nicholas School of the Environment, Duke University). BaseLiner helps to identify no-flow conditions and to set baseline points at these times. A linear interpolation is then applied to calculate the baseline between these points. In a next step, the hourly values of sap flow density of each tree were calculated using Equation (3). Finally, daily totals of sap flow density for each sample tree were computed from one midnight to the next midnight. No functional relationship between the daily totals of sap flow density and the corresponding DBH was found.
To estimate the daily transpiration, TBL, of the black locust stand [mm d−1], the daily sap flow densities of all sample trees were averaged. The averaged flux densities, Javg, were then multiplied by the total sapwood area, AST, of the plot, and divided by the stand ground surface, AG [47]:
Another method to estimate the transpiration of the black locust stand (hereinafter referred as Tresidual) is to calculate the transpiration as a residual of the difference between total measured evapotranspiration Equation (1) and measured understory transpiration Equation (2) on a daily basis. These residuals together with the calculated grass reference evapotranspiration [48] were used to assess the reliability of the sap flow measurements.
2.3. Calibration Experiment and Cut Tree Technique
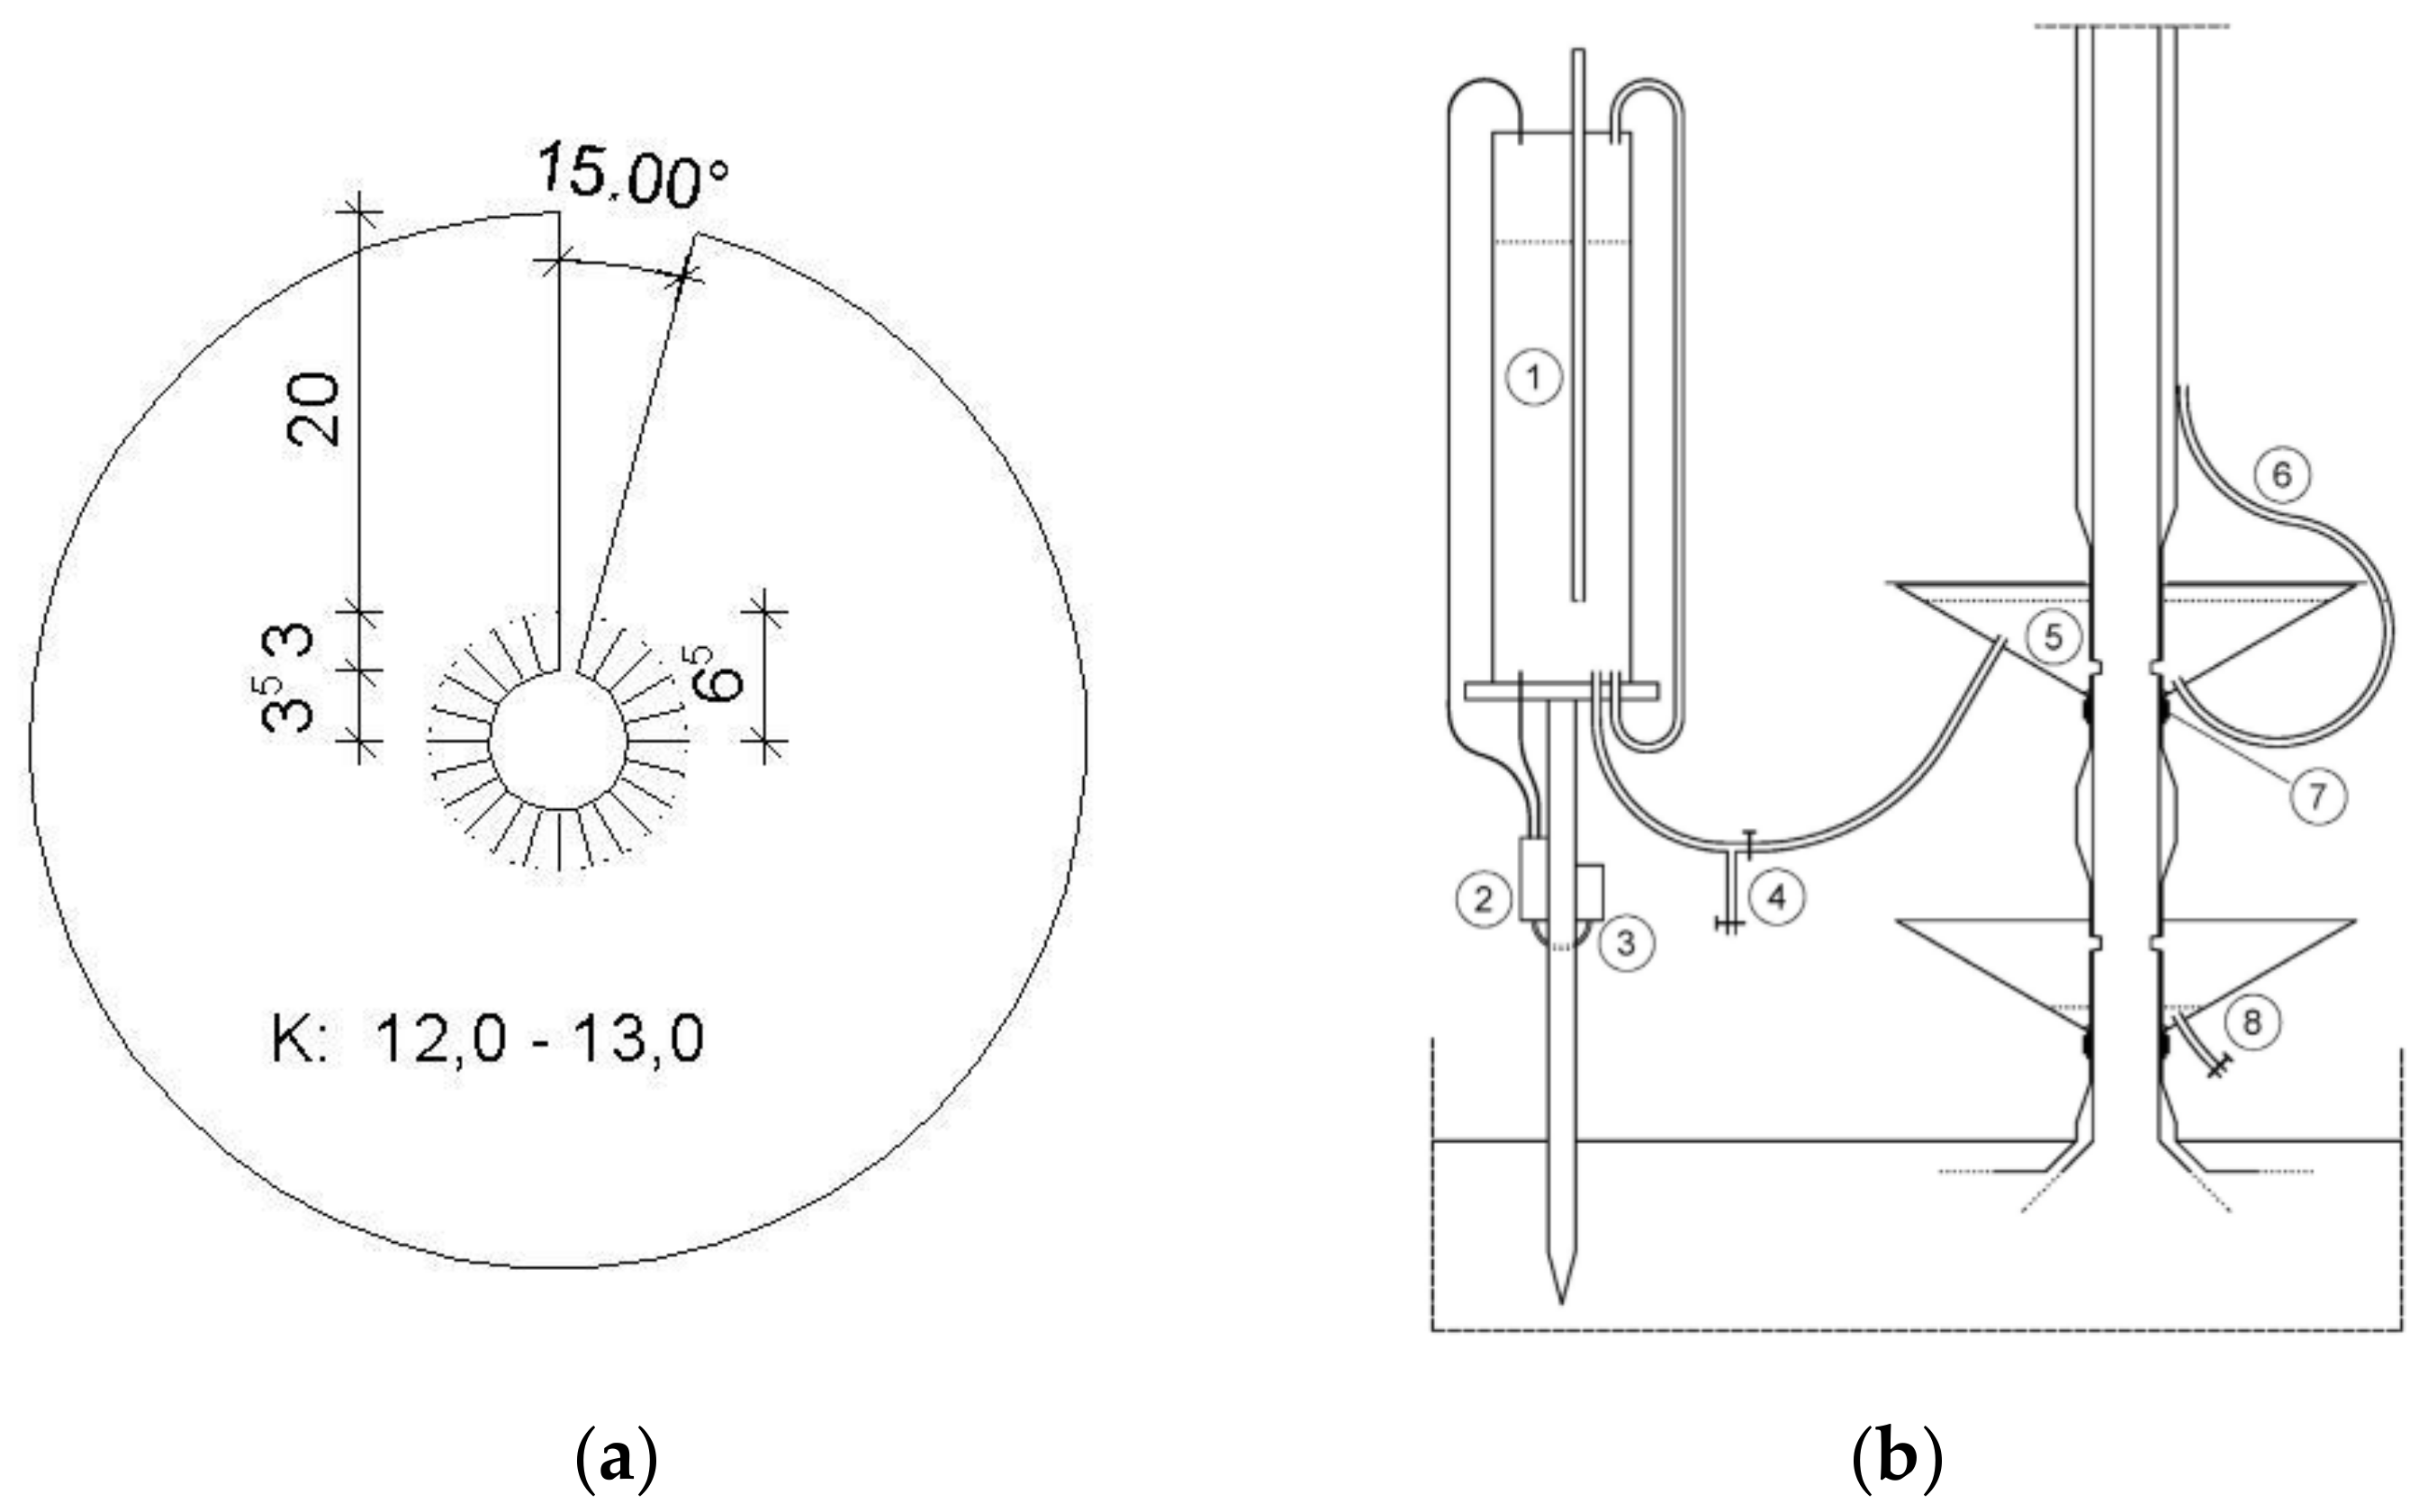
The calibration experiment is grounded in the fact that a tree can take up water from a water reservoir instead of from the soil. To conduct the calibration, the sapwood had to be cut from a tree (see below). The setup of the calibration experiment consists of three components: two collars and a Mariotte water supply (Figure 1).
The funnel-shaped collar is made of a zinc sheet (Figure 1b). With a thickness of 0.5 mm, the collar is sufficiently sturdy but also easy to bend. A tree with a diameter of 14.3 cm and a height of 13.0 m was selected for cutting sapwood. After smoothing the bark, the collars were placed around the stem at the height of 40 cm and 90 cm above the soil surface. The inner metal cut strips were then bent downwards and attached to the stem by a lashing belt. Afterwards, both ends of the upper collar were joined by a waterproofing steam-tight tape (Siga Rissan, Russwil, Switzerland) whereas the ends overlapped. Finally, the gap between collar and stem was sealed with silicon adhesive. An S-form chisel (Kirschen, Remscheid, Germany) was used to cut a 1-cm-deep notch around the circumference of the black locust stem. The cut of the sapwood was done underwater to avoid air entry to the xylem. The same procedure was applied to the lower collar.
During the calibration, the upper collar serves as the tree’s water reservoir. For this purpose, the upper collar is connected to a conventional Mariotte water supply (90.0 cm long, 18.7 cm in diameter, made of PVC). The latter has an adjustable tube that controls the outflow. It ensures a constant water level inside the collar throughout the experimental period and prevents the freshly cut sapwood from drying out. The function of the lower collar is to collect water dripping from the upper one. The collected water was periodically taken from the collar via a valve and stored in a bottle with a cap. The drip rate was determined by weighing. These data were used for calculations. To prevent evaporation of water from the collar during the experiment, two semi-circular lids were placed on the collars. Changes in the Mariotte water supply correspond to water uptake by the tree; these changes were monitored using a differential pressure sensor (PD-23, Fa. Keller, Winterthur, Switzerland). The data were logged every 60 s (EASYLOG 40NS K-0-10V, Fa. Greisinger, Regenstauf, Germany). At the same time, sap flow was measured using two pairs of Granier-style sap flow sensors, mounted at breast height on the eastern and northern side of the sample tree.
3. Results and Discussion
3.1. Diurnal Cycle of Transpiration Estimated Using Granier’s Original Calibration and Soil Water Balance Method
In this section, we present the estimated transpiration of the black locust stand using two different methods. By comparing the two results, the impacts of potential errors on the measured sap flow and estimated stand transpiration rates based on Granier’s original calibration are discussed. A warm period with low rainfall was selected for cross-checking the transpiration estimates. Figure 2 shows the daily rainfall and daily mean values of soil pressure head at different soil depths for the period from 1 May to 30 June 2012. By this time, the canopy of the black locust stand was fully developed. As the fast increase of soil pressure head data at the depths of 20 and 40 cm reveals (Figure 2), the soil became drier. This was caused by soil water depletion due to lack of rainfall (Figure 2). As outlined in the methods section, the measured soil pressure head data were used to identify the location of the zero-flux-plane (ZFP) by calculating the hydraulic gradients. Results of these calculations are also shown in Figure 2. Note that negative hydraulic gradients indicate upward water flow and positive hydraulic gradients indicate downward water flow. In May and June, a ZFP was located within the root zone but below the main root zone at a depth range of between 50 and 70 cm.
For the dry period from 2 June to 24 June soil moisture changes above the ZFP were balanced according to Equation (1). Although the ZFP was located within the root zone it can be assumed that soil moisture changes below the ZFP were mainly due to the downward movement of water and only to a minor extent because of root water extraction. This assumption is supported by our observation that (i) 90% of the fine roots were within the upper 50 cm of the soil; (ii) the rooting density at soil depths >50 cm was very low (1 to 2 fine roots per dm2); and (iii) soil moisture changes at the soil depths of 80 and 100 cm were less than 3 vol % during the balanced period. Similar soil water depletion patterns of black locust were observed by other studies [30,40]. Chen et al. [30] measured soil moisture of black locust at the depth of 0–25 and 75–100 cm. They found insignificant soil moisture variations in the deeper soil during the vegetation season. Du et al. [40] concluded based on their soil moisture measurements at different soil depths that short-term changes of soil moisture below a depth of 1 m were small. Moreover, their plotted soil moisture variations along a vertical profile before and after a rain event revealed that about 90% of the soil moisture variations occurred within the upper 40 cm of the soil profile.
With this fact, we assume that neglecting root water extraction from below the ZFP will not result in a significant underestimation of the total evapotranspiration. For the dry period from 2 to 24 June, the totals of soil water depletion due to root water uptake and evaporation Equation (1) were contrasted with the totals of understory evapotranspiration (based on lysimeter measurements, Equation (4)) and black locust stand transpiration (based on sap flow measurements, Equation (2)) (Figure 2). The total evapotranspiration, understory evapotranspiration, and stand transpiration amounted to 82.0 mm (3.6 mm d−1), 51.0 mm (2.2 mm d−1), and 1.8 mm (0.08 mm d−1). The latter was calculated based on Granier’s original calibration parameters, but if calculated using soil water balance method (total evapotranspiration minus understory evapotranspiration), transpiration was 31.0 mm (1.4 mm d−1). A large difference (ca. 30 mm) appears between the transpiration indirectly estimated as a “residual” of the water budget and the transpiration directly derived from Granier’s original calibration.
So far only a few studies have balanced the total evapotranspiration of black locust stands in dryland China. Wang et al. [49] studied the water budget of black locust afforestation in the Loess Plateau Region by combining throughfall, stemflow, and soil water content measurements with soil hydrological modelling. Their calculated total evapotranspiration (ETtotal) of the investigated black locust stand ranged from about 90 to 120 mm per month (or from 3.0 to 4.0 mm d−1) during the summer months (June to August). Jian et al. [28] investigated the effect of different trees and shrubs on soil water storage and water balance in the semi-arid Loess Plateau area. In this study, evaporation from soil under black locust was measured using a micro lysimeter, while stand transpiration was derived from sap flow measurements using a modified Granier sensor system (SF-L, Ecomatik, Germany) from May to September during 2009–2013. Sums of evaporation from soil and stand transpiration amounted to between 56 and 84 mm (or from 1.9 to 2.7 mm d−1) [28]. The mean potential evapotranspiration of study areas of Wang et al. [49] and Jian et al. [28] are about 1.6 and 1.5 mm a−1, slightly higher than our study area (1.4 mm a−1). Moreover, the mean annual precipitation values of the two study areas are 540 and 420 mm a−1, smaller than the long-term average of rainfall in our study area (590 mm a−1). Despite the differences in long-term potential evapotranspiration and rainfall, the total evapotranspiration rates are in the same range as our measured results based on the water balance method. This makes us confident that the soil water balance method delivered more reliable results than the application of Granier’s original calibration.
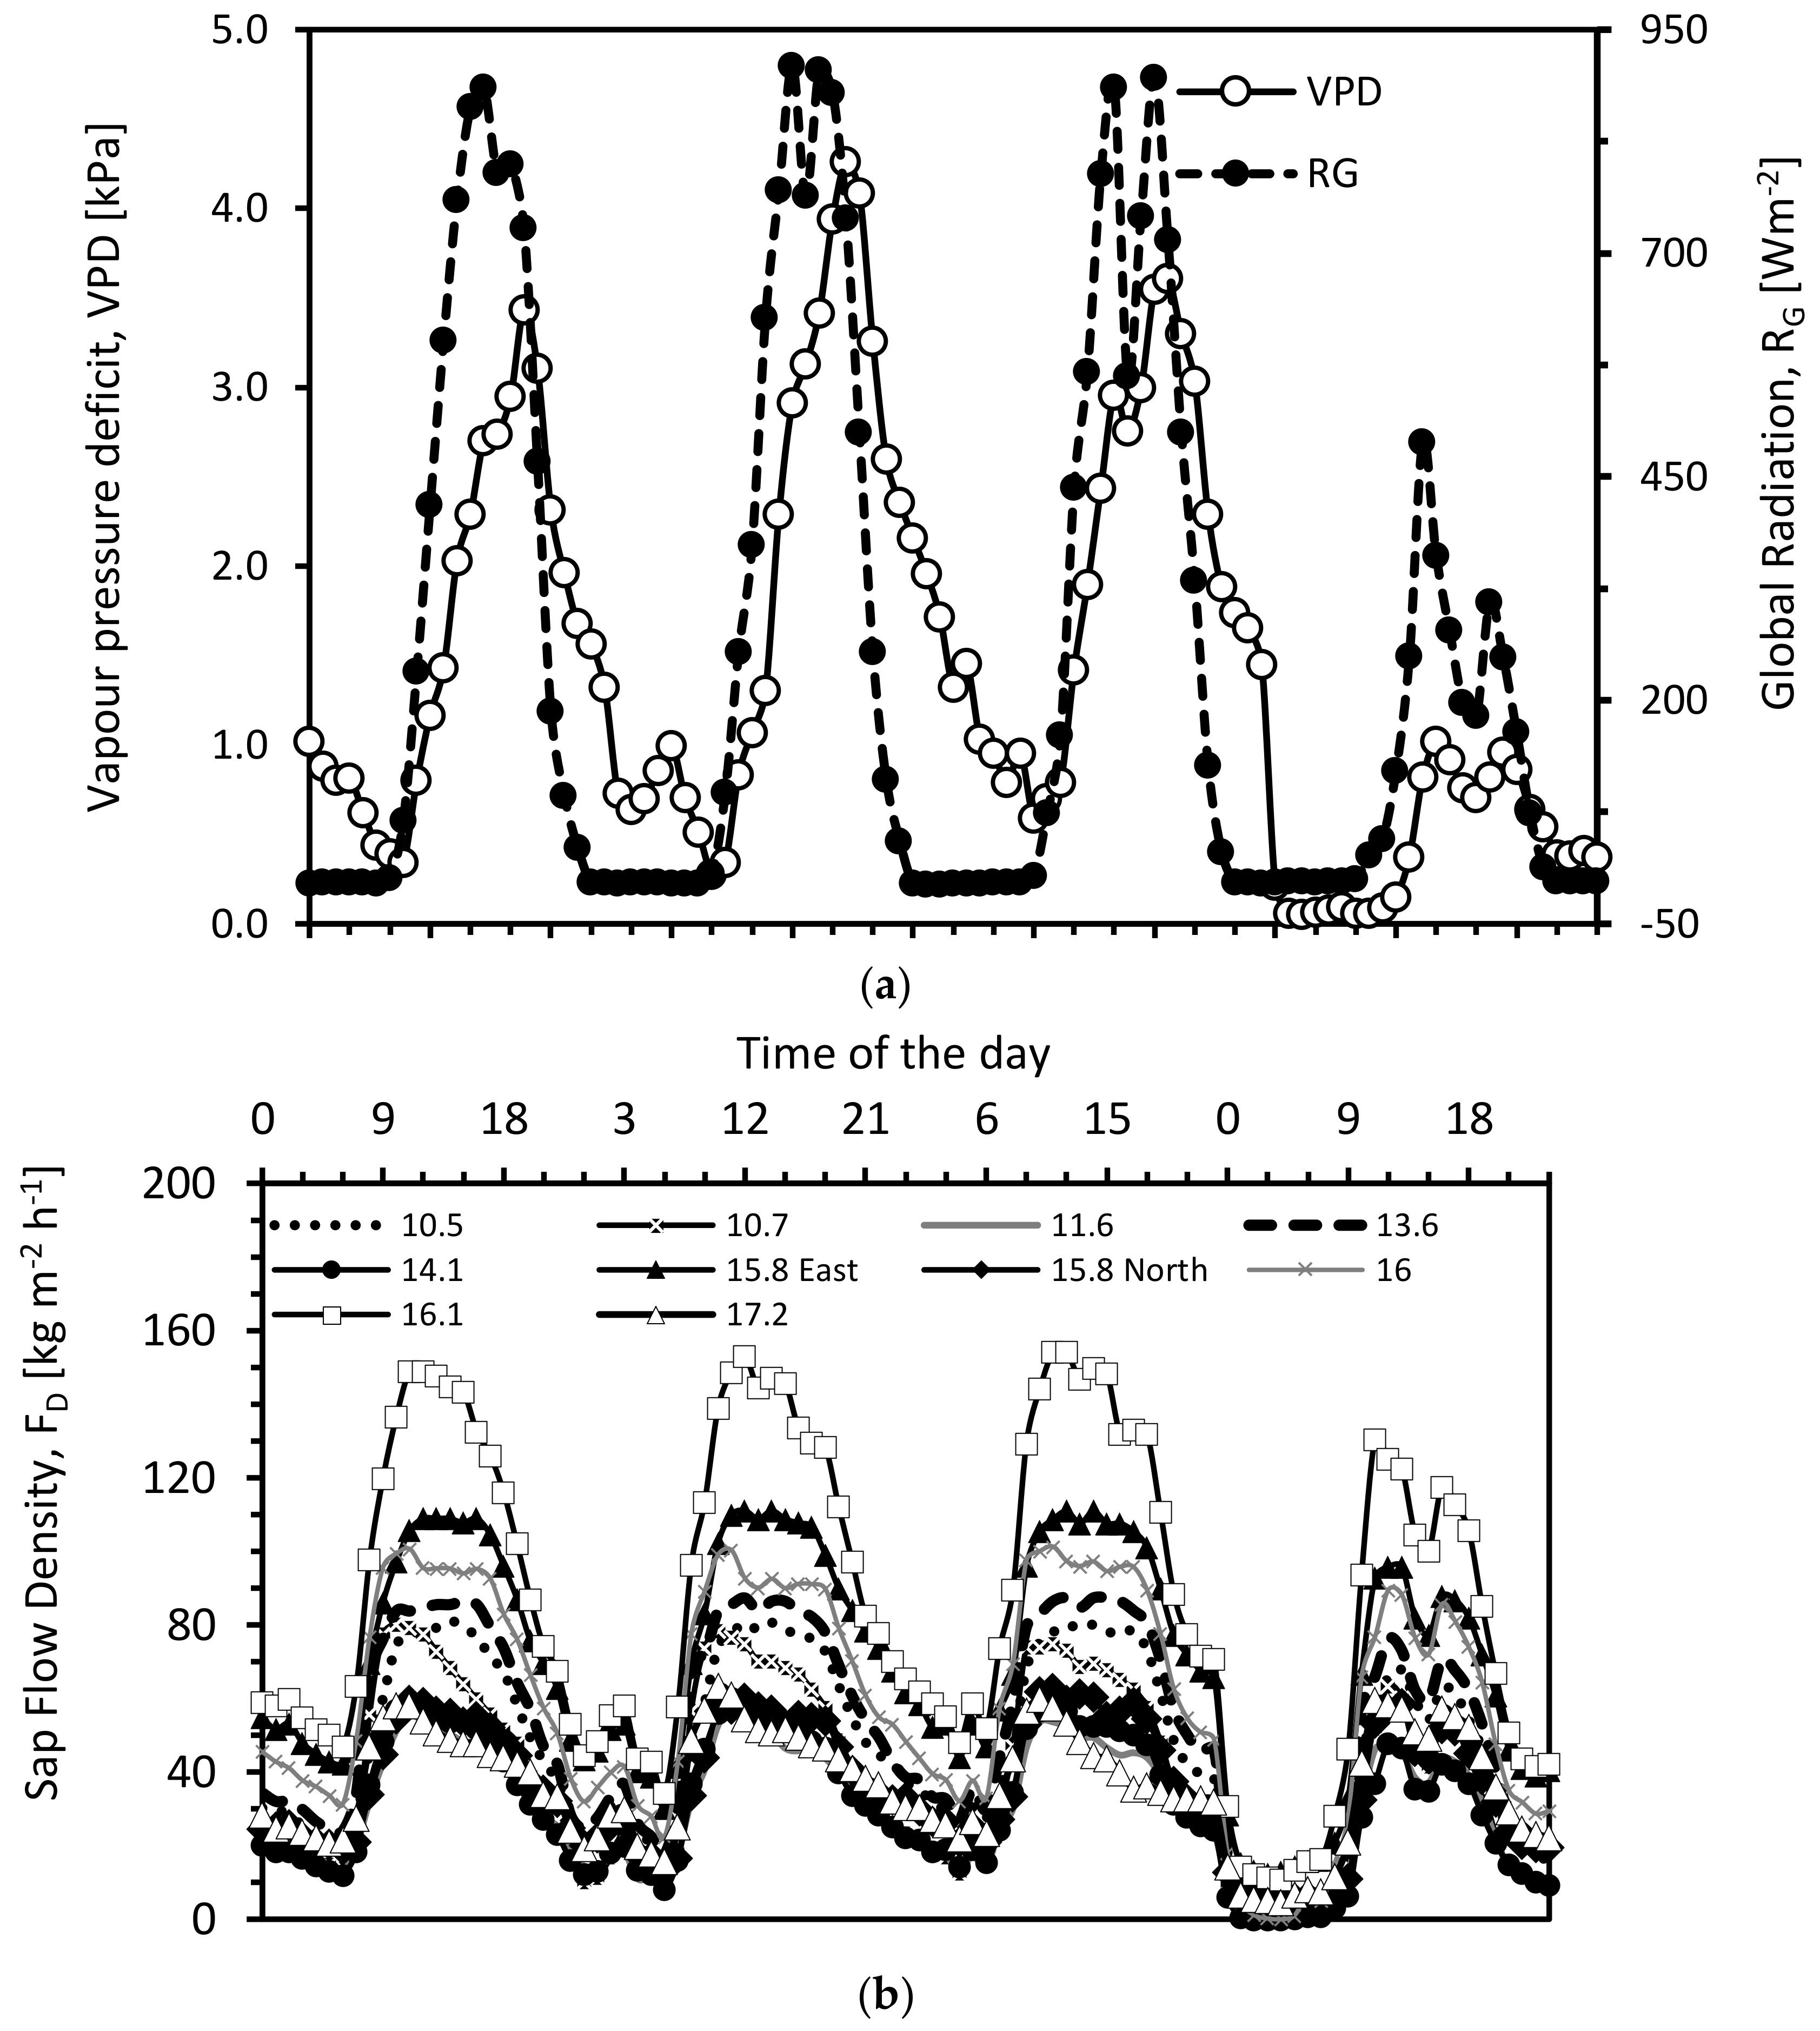
Yet, what are the causes for the mismatch between the results of the soil water balance method and the combination of the lysimeter/sap flow method? Some of the possible issues, such as variability in sap flow or scaling-up of the measurements to the stand level, can be better understood if basic data in high temporal resolution are analyzed. For this purpose, daily courses of global radiation, as well as vapor pressure deficit and diurnal courses of sap flow density of trees with different tree diameter at breast height (DBH) on sunny and warm days during the abovementioned balance period, are examined (Figure 3). Night time sap flow was observed on selected nights and considered in this study. For the balance period from 2 to 24 June, consideration of nocturnal fluxes resulted in a 40% increase of stand transpiration in comparison to the estimation without consideration of night flow (not shown). Figure 3 reveals that there is no clear dependency of sap flow density on tree DBH of the measured black locust trees. This is in line with the findings of Wang et al. [29] and confirmed our presumption, as McCulloh et al. [50] have shown for black locust and other investigated ring-porous tree species, i.e., that their stem conductance per unit sapwood was independent of tree size.
In our balance period, the maximum sap flow densities of the 33-year-old stand varied from about 60 kg m−2 h−1 (DBH = 17.1 cm, DBH = 15.8 cm, DBH = 12.1 cm) to about 150 kg m−2 h−1 (DBH = 16.1 cm). Jiao et al. [25] compared the sap flow densities and stand estimates of a 12-year-old and a 28-year-old black locust stand in the semi-arid Loess Plateau. Their maximum sap flow densities in the younger stand were between 45 and 75 kg m−2 h−1 and in the older stand between 80 and 180 kg m−2 h−1 on sunny and hot days. These values are in line with our results. In contrast, Wang et al. [29] found higher maximum flow densities (their values ranged from 105 to 408 kg m−2 h−1) with a larger variation in another 30-year-old black locust stand in the semi-arid zone of the Loess Plateau. However, our measurement results still fall within the same order of magnitude and indicate that the values are representative for the black locust stands of the Loess Plateau region.
It is often discussed that ignoring circumferential variations in sap flow density may introduce significant errors when stand transpiration estimates are derived from sap flow measurements [9,51]. Thus, in individual cases, two pairs of sap flow sensors were installed at sampled trees (East, North). In our study, circumferential variations in sap flow/within-tree spatial variations were lower than the tree-to-tree variations as an example of circumferential variations in sap flow density (Figure 3); the maximum values were about 60 kg m−2 h−1 and 110 kg m−2 h−1 for the north- and east-facing sensors. Circumferential variations tend to be accompanied by slight asymmetries in the crown; we observed that often thicker branches were located above the sensor with larger sap flow densities. However, this issue was not systematically examined.
Kume et al. [51] studied the radial and circumferential variations in sap flow velocity in several directions and depths of tree trunks of black locust stands on the Loess Plateau. They found that the sap flow density was almost zero at the depth of 15 mm and most of the sap flow took place at the outermost area of the sapwood (≤5-mm depth). Moreover, omitting radial variations and circumferential variations in sap flow density affected the stand transpiration estimation by 33% and 22%. This was lower than the effect of omitting tree-to-tree variation in sap flow density (error of 52%). We showed that radial, circumferential, and tree-to-tree variations may have introduced some errors when scaling up sap flow densities to the stand scale. However, the mismatch (1.3 mm d−1) between the two applied methods cannot be sourced from these potential errors since the magnitude of these errors is too small to bridge the huge gap.
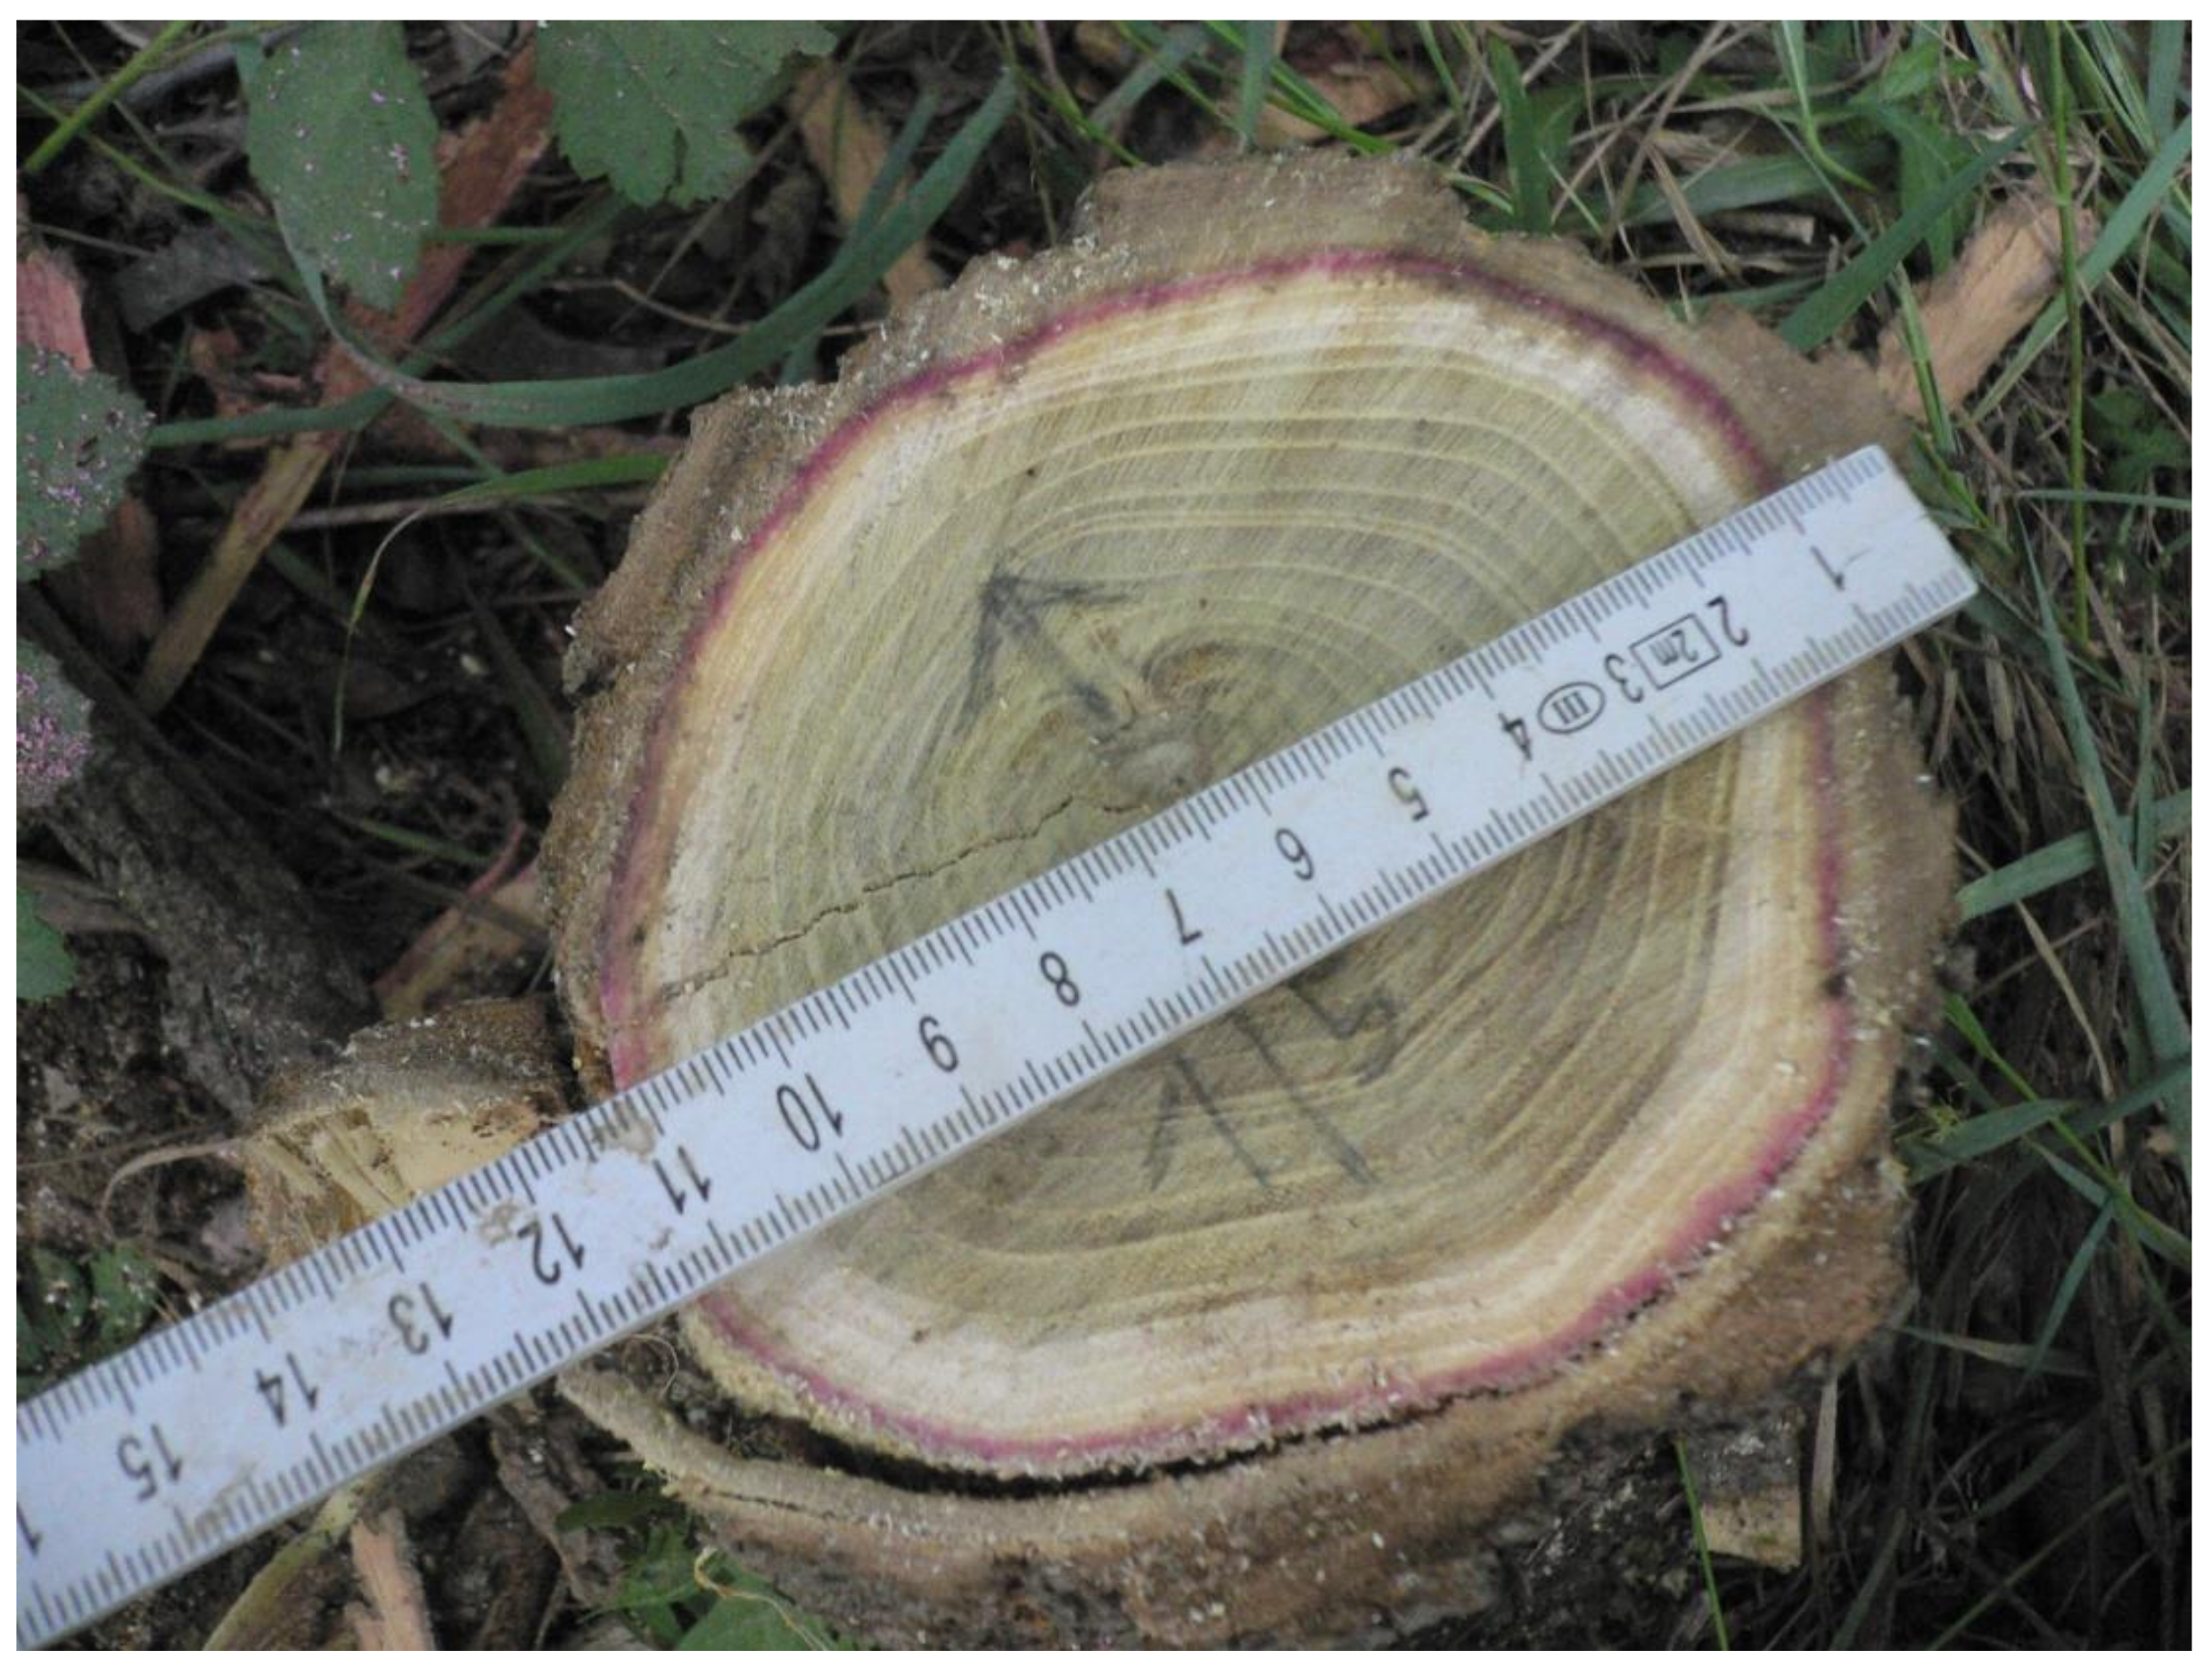
Another source of error may stem from the determination of the active sapwood area. The latter is needed for scaling-up the sap flow measurements to the stand level. In our study, we considered that the sap flow took place only in the outermost annual ring of black locust, which is supported by the results of dye injection experiments in ring-porous tree species [14,52] and our own dye tracer experiments in living black locust trees (Figure 4). The result showed that only the outermost growth ring was active for xylem flow. Moreover, isolated larger pores are often noticeable due to more intense coloring. A measurement of the maximum dye ascent velocities using three sample trees (with a height of 11.5, 13 and 14.5 m) revealed a range of 19–25.5 m h−1. This falls within a similar range of values as measured by Zimmermann and Brown [53] and Huber and Schmidt [54].
A mean annual tree-ring width of 3.43 mm was found for our study area, ranging from 1.89 to 4.93 mm in an individual year. Based on the site-specific relationship between DBH and active sapwood area, a value of 0.125 m2 was determined for the active sapwood area of our black locust stand. Table 1 shows that the ratio of total sapwood area to the stand ground surface in our study was much lower than other studies for black locust stands in the Loess Plateau region. This is due to the significantly different sapwood thicknesses that were taken into account for upscaling the stand transpiration in the different studies [25,29]. Other experimenters estimated a significantly larger sapwood thickness (ranging from 5.0 to 15.4 mm) suggesting possibly no limitation to the outermost growth, which may lead to uncertainties. Moreover, they did not give further details about how the sapwood thickness was determined in their studies. It is thus unclear if their assumed sapwood thickness corresponds to the active sapwood area.
To explore the possible impact of sapwood thickness on the estimated value of stand transpiration, we applied the relationships between DBH and active sapwood area of other studies (cf. Table 1) to estimate our stand transpiration, and the results are shown in Figure 5. It is evident that errors in sapwood thickness determination can have a significant effect on stand transpiration estimates (Figure 5). According to Equation (4), an error in determining the total sapwood area can lead to the same error in estimated stand transpiration.
3.2. Tree-Specific Calibration of Granier’s Sensor System
As shown above, Granier’s original calibration has a tendency of underestimating tree transpiration if it is applied directly without determining the active sapwood area for conducting water. To improve the accuracy of an estimate, an in situ experiment for the sap flow sensor calibration was developed and implemented in June 2013. In this section, the results of the black locust-specific calibration of the Granier sensor system are contrasted with the results of previous calibration studies carried out in other ring-porous tree species. Potential benefits and disadvantages regarding laboratory and field calibrations of sap flow sensor systems are elaborated.
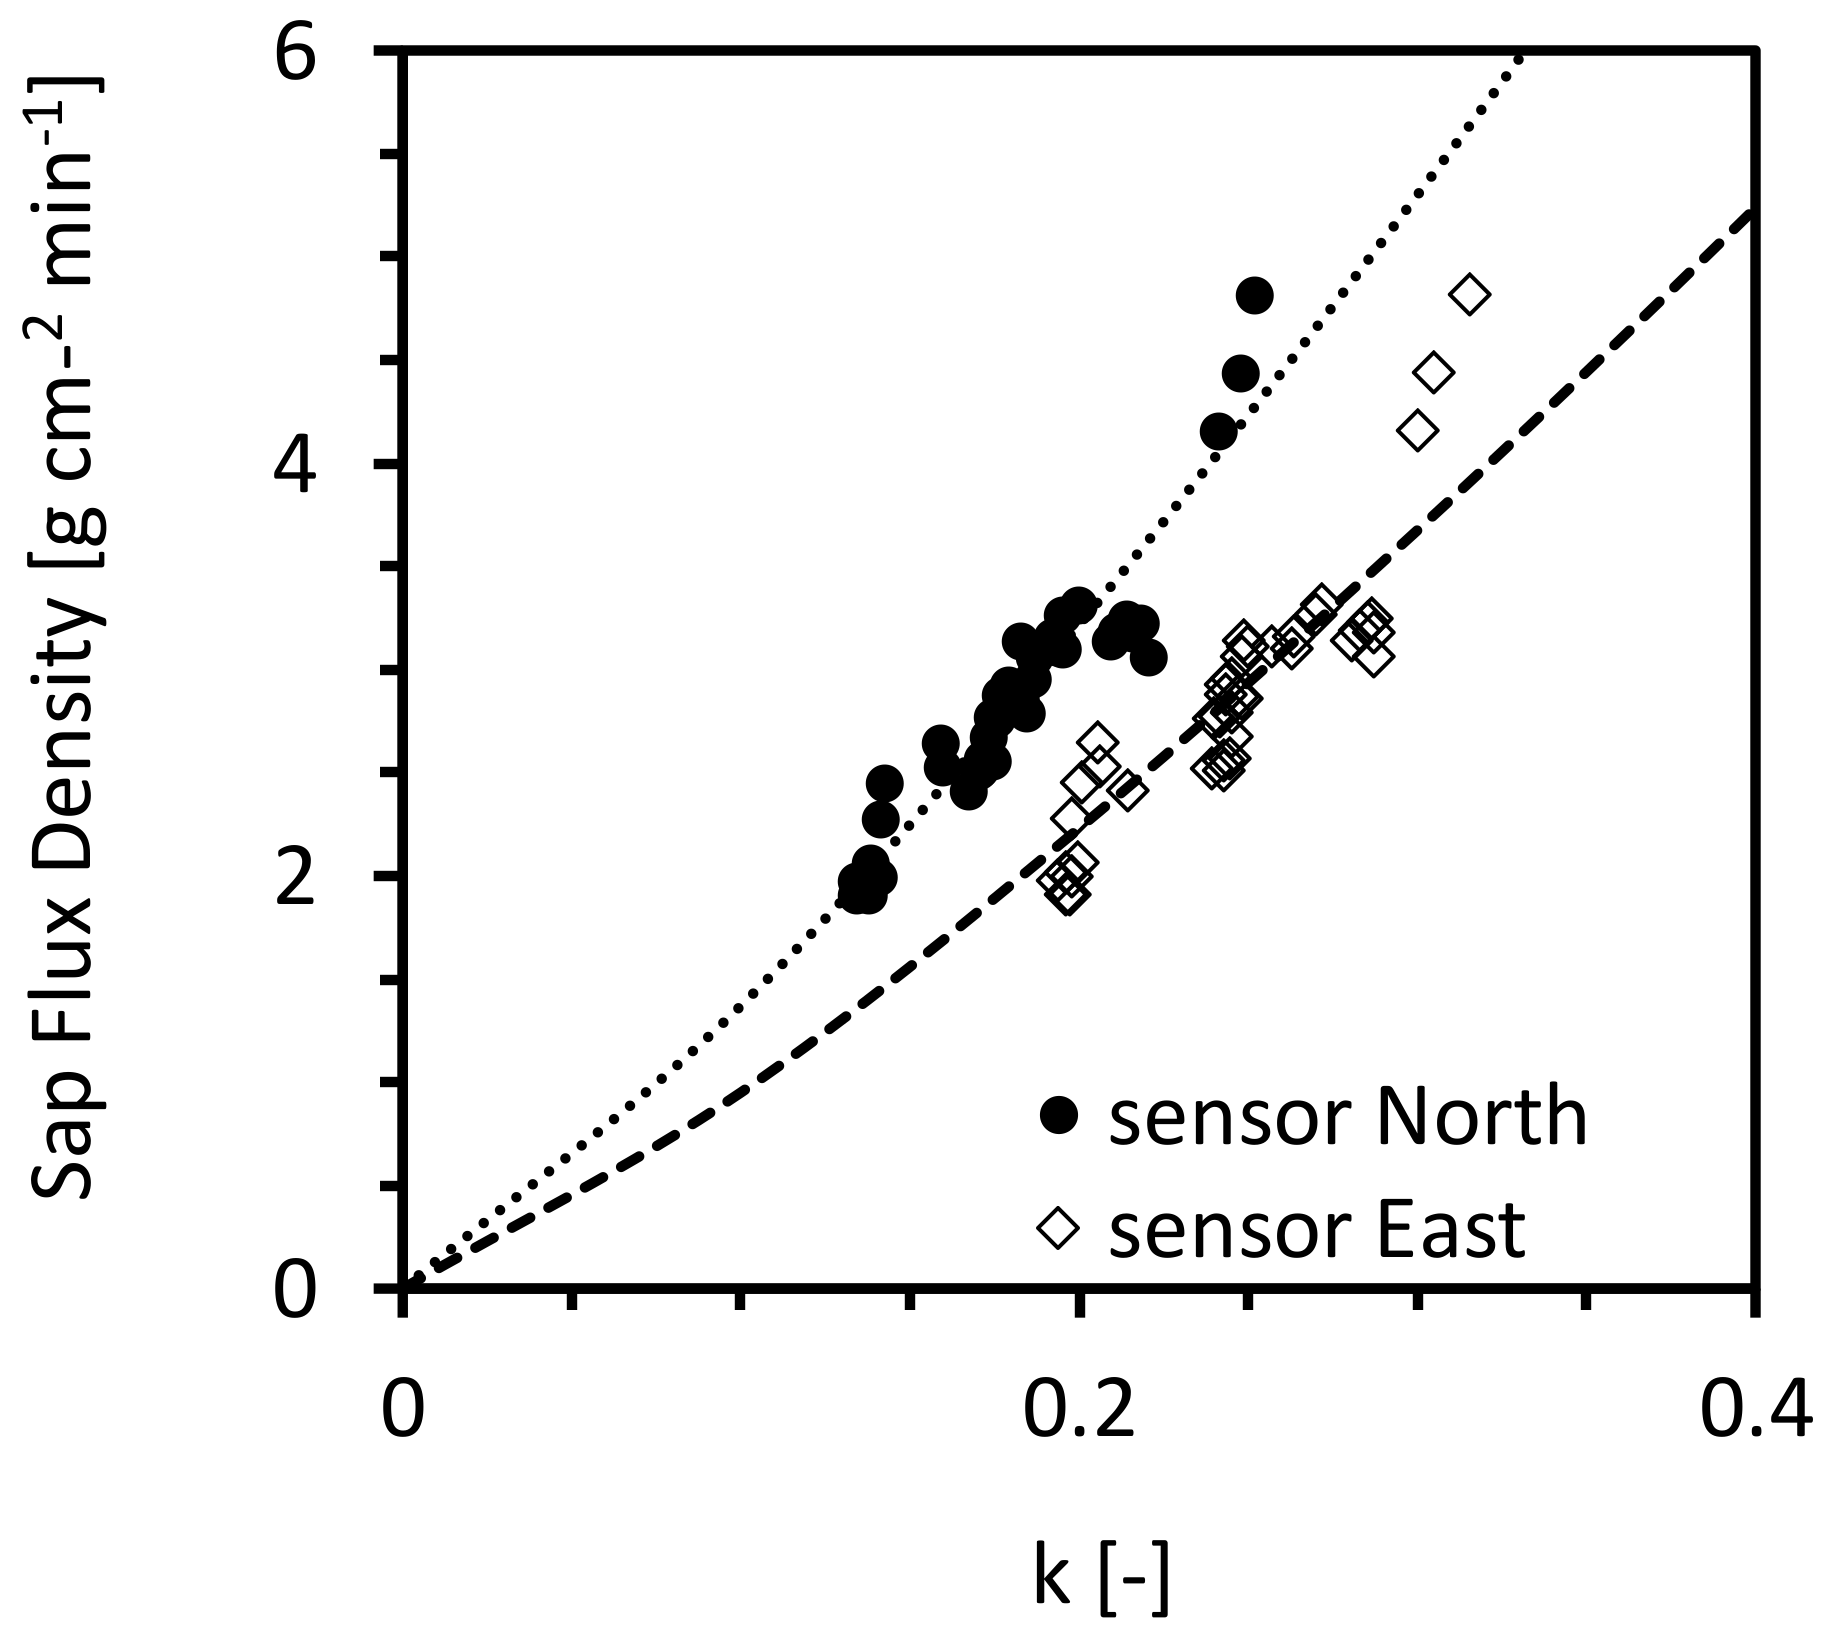
The relationship between the outflow from the reservoir and the normalized sensor output is shown in Figure 6. The data were fitted to a power function Equation (3) of the same type as that proposed by Granier [26]. A closer inspection of Figure 6 reveals that the fitted function slightly underestimates the corrected outflow at higher k values (when k ≥ 0.25 in the north and k ≥ 0.3 in the east). The coefficient a, obtained from the fit, varied between 2.70 and 3.89 kg m−2 s−1, and presents a significant disparity from the value (0.119 kg m−2 s−1) found by Granier [26]. For coefficient b, we found a very similar value to the original one (1.231) as reported by Granier [26]. The k values (cf. Equation (3)) in calibration mainly ranged between 0.10 and 0.35; only 4% of the k values fell between 0.35 and 0.45 and 0.1% of them were larger than 0.5. So, extrapolation of the new calibration equation to k > 0.35 may induce errors in the estimation of transpiration.
A compilation of Granier’s sensor calibration for different ring-porous trees is presented in Table 2. In most of the cases, calibration data differ significantly from Granier’s original equation, particularly the coefficient a. It is worth noting that the values of the coefficient a vary considerably between different tree species. Possible reasons for discrepancies between calibration results of different studies have been reviewed by Sun et al. [16]. They discussed the impact of the following factors on the calibration of sap flow sensors: (i) differences in the construction of sensors; (ii) influence of the realized rate of water movement; (iii) occurrence of natural temperature gradients; (iv) errors in estimating zero-flux (cf. Equation (3); as well as (v) within- and between-tree variation. Another issue is likely important but has received surprisingly little attention so far, namely, the differences in calibration setup. The experimental setup is summarized for each case in Table 2. They differ in three aspects: size of plants (branches, stem segments, or trees), flow conditions (transient or steady state), and realization of the water flow through branches/stems (transpiration or application of external pressure). Cases showed that sensor calibration using external pressure to pull water through the stem delivered significantly larger values for the coefficient a than the calibration using xylem water movement driven by transpiration. Generally, laboratory calibration experiments on branches or stem segments using external pressures are quick, precise, and can be repeated at any time. However, it is often the case that the applied pressure was high and exceeded the in situ condition. Bush et al. [14] found that increases in pressure gradients can result in increased values of the coefficients a and b. It is thus likely that applying high pressures in calibration experiments may push water through conduits, which would not happen under natural flow conditions [16].
Moreover, the length of the segment may also play a role for a large value of a. The vessels are possibly open at both ends of a short segment. Under such conditions, sap flow densities would be overestimated [14]. Plant segments with a length ≤ 1 m were used for many calibrations of Granier’s sap flow sensors [13,14,15,55,56,57]. According to Bush et al. [14], using relatively long plant segments can minimize the risk that both ends of earlywood vessels are open. Although a global analysis of xylem vessel length generally supports this view, it should be noted that the maximum vessel lengths exceeding 1 m were occasionally reported [58,59]. For this reason, it is suggested that ring-porous trees would require long stem segments for experiment [59]. Additionally, we noticed that one of the laboratory calibrations [15] also used a dye experiment to determine the active sapwood area in black locust. In this experiment, it took one hour until the dye was pulled through the 1-m long stem segments, which is twice as long as our experiment time (30 min) for a much longer length (>10 m). This can increase the possibility of error in determining active sapwood area resulted from the capillary rise. If an external pressure is applied during the dye test, the error is likely to be amplified. As a result, an extremely low value of parameter a may be obtained because of a relatively large active sapwood area (Table 2).
In contrast to laboratory calibrations, field calibration experiments on trees, in which the water flow through the xylem is driven by transpiration, have some advantages. They allow us to understand flow processes under a natural environmental condition. Without considering the limitations of the laboratory facilities, large trees can be examined. It is thus expected that xylem flow takes place mainly in the large earlywood pores of ring-porous trees in field calibration under natural flow conditions, as verified by Nagata et al. [60]. So, it is highly possible that the calibration data obtained from field experiments are more representative than the data obtained from laboratory calibration. Despite these discrepancies in sensor calibration, it can be concluded based on this study and previous research [13,14,15,61] that applying a universal calibration equation to ring-porous tree species will result in inaccurate estimates of tree transpiration. We highly recommend tree-specific calibration for sap flow measurement.
3.3. Validate the Accuracy of the New Calibration
To test the reliability of the sap flow estimates based on the newly derived calibration, we applied it in other selected periods of measurement and compared it with transpiration results calculated based on the soil water balance method. Periods of high evaporation demand and low rain are particularly suitable for cross-checking transpiration estimates [41], which are also dependent on the availability of datasets. Occasionally, sap flow and soil moisture measurements produced noises or failed. Data gaps were yet to be closed because gap filling could introduce additional uncertainties, and thus affect the validation. Transpiration estimates obtained from the two different methods are listed in Table 3 for periods with little or no rainfall in 2013. Moreover, transpiration estimates for the dry and warm period in 2012 (presented in Section 3.1) are also listed.
The results from both methods showed good agreement, despite that the data for soil water balance method, lysimeter method, and sap flow method were measured in different spatial extent and temporal resolution. For example, soil moisture measurements along the transect were 50 m away from the lysimeter. Small-scale variations in LAI might be another possible reason for the observed differences since LAI affects soil moisture by altering inputs of energy and precipitation. The reasonable agreement between the results makes us confident that the new calibration produces a much more reliable estimation of sap flow than Granier’s original calibration.
As shown in Table 3, the mean daily stand transpiration ranged between 1.1 and 1.4 mm d−1. These values are much larger than the ones (≤0.5 mm d−1) reported by some previous sap flow studies (Table 1) on black locust plantations [23,24,25,28,29,30]. A few studies quantified the water consumption of black locust stands in the Loess Plateau region with other methods. Wang [63] estimated ET using a water balance approach and reported that the annual evapotranspiration (ET) of a 14-year-old black locust stand, located in the semi-humid area of the Loess Plateau, ranged between 403 and 632 mm. In a more recent study of Wu et al. [64], the response of black locust seedlings to soil water availability was examined. The seedlings transpired up to about 1.4 mm d−1 when there was no water shortage. Ma et al. [15] and Jian et al. [28] used modified Granier methods to estimate the transpiration of black locust stands during growing season. The average values of Ma et al. [15] ranged between 1.6–2.1 mm d−1, while the estimate of Jian et al. [28] ranged from 0.5 to 1.9 mm d−1. Their results showed a good consistency with the findings of our study.
4. Summary and Conclusions
We found a large difference (ca. 30 mm) between the estimates of tree transpiration using two different methods—soil water balance and sap flow measurements based on Granier’s original calibration—during a dry and warm period in June 2012. The estimate by applying Granier’s original calibration was extremely low despite a similar range with other studies using Granier’s original calibration on the Loess Plateau, while the estimate from soil water balance showed a reasonable result. A series of thorough analyses of the possible sources of error and exploration of datasets from our measurements indicate that the extremely low value of Granier’s method probably stemmed from the application of a universal calibration and the inaccurate determination of the active sapwood area, which can lead to a significant error during scaling-up of stand transpiration. Our dye tracer test showed that most of the sap flow took place in larger earlywood vessels of the outer ring. Installation of sap flow sensors in non-active sapwood is another possible source of uncertainty.
An easy-to-install measurement setup for an in situ calibration of Granier’s sensor system in living trees was developed and applied for black locust. The results showed that Granier’s original calibration significantly underestimated the stand transpiration of black locust stands. A new calibration of Granier’s sap flow sensor system for black locust can improve the accuracy of estimated sap flow and stand transpiration. Tree-specific calibration is recommended for future research on the use of Granier’s method in ring-porous trees. Moreover, the use of short sensors (5 or 10 mm) can reduce the uncertainties due to sensor access to the non-active sapwood in ring-porous trees. Many researchers concluded that the black locust plantation is one of the main contributors to the significant decline of river discharge in the middle reaches of the Yellow River, according to their analyses of the long-term data on climate, streamflow trends, and land-use change. Our work confirms these conclusions, shown by a higher transpiration rate of black locust plantations on the Loess Plateau. More studies and evidence are required to clarify the role of afforestation and tree species to address regional environmental issues and their potential impacts on ecosystem services, which are directly linked to regional soil, water, and food security. In particular, the contribution of understory—which is an important feature of these plantation forests—to the total water consumption of such ecosystems needs to be understood. This will provide the basis for the development of forest management strategies that better balance forest-related ecosystem services such as soil conservation and water supply.
Acknowledgments
This study was funded by the German Research Foundation (DFG Schw1448-3/1). We would like to thank Atiqah Fairuz Binte Md Salleh for language editing.
Author Contributions
Kai Schwärzel, Andreas Strecker and Christian Podlasly conceived, designed and performed the experiments; Kai Schwärzel and Andreas Strecker analyzed the data; Kai Schwärzel and Lulu Zhang wrote the paper.
Conflicts of Interest
The authors declare no conflict of interest.
References
- Kim, H.K.; Park, J.; Hwang, I. Investigating water transport through the xylem network in vascular plants. J. Exp. Bot. 2014, 65, 1895–1904. [Google Scholar] [CrossRef] [PubMed]
- Vandegehuchte, M.W.; Steppe, K. Sap-flux density measurement methods: Working principles and applicability. Funct. Plant Biol. 2013, 40, 213–223. [Google Scholar] [CrossRef]
- Köstner, B.; Granier, A.; Cermák, J. Sapflow measurements in forest stands: Methods and uncertainties. In Annales des Sciences Forestières; EDP Sciences: Les Ulis, France, 1998; Volume 55, pp. 13–27. [Google Scholar]
- Regalado, C.M.; Ritter, A. An alternative method to estimate zero flow temperature differences for Granier’s thermal dissipation technique. Tree Physiol. 2007, 27, 1093–1102. [Google Scholar] [CrossRef] [PubMed]
- Rabbel, I.; Diekkrüger, B.; Voigt, H.; Neuwirth, B. Comparing Tmax Determination Approaches for Granier-Based Sapflow Estimations. Sensors 2016, 16, 2042. [Google Scholar] [CrossRef] [PubMed]
- Oren, R.; Phillips, N.; Ewers, B.E.; Pataki, D.E.; Megonigal, J.P. Sap-flux-scaled transpiration responses to light, vapor pressure deficit, and leaf area reduction in a flooded Taxodium distichum forest. Tree Physiol. 1999, 19, 337–347. [Google Scholar] [CrossRef] [PubMed]
- Clearwater, M.J.; Meinzer, F.C.; Andrade, J.L.; Goldstein, G.; Holbrook, N.M. Potential errors in measurement of nonuniform sap flow using heat dissipation probes. Tree Physiol. 1999, 19, 681–687. [Google Scholar] [CrossRef] [PubMed]
- Paudel, I.; Kanety, T.; Cohen, S. Inactive xylem can explain differences in calibration factors for thermal dissipation probe sap flow measurements. Tree Physiol. 2013, 33, 986–1001. [Google Scholar] [CrossRef] [PubMed]
- Ford, C.R.; Hubbard, R.M.; Kloeppel, B.D.; Vose, J.M. A comparison of sap flux-based evapotranspiration estimates with catchment-scale water balance. Agric. For. Meteorol. 2007, 145, 176–185. [Google Scholar] [CrossRef]
- Wullschleger, S.D.; Childs, K.W.; King, A.W.; Hanson, P.J. A model of heat transfer in sapwood and implications for sap flux density measurements using thermal dissipation probes. Tree Physiol. 2011, 31, 669–679. [Google Scholar] [CrossRef] [PubMed]
- Vergeynst, L.L.; Vandegehuchte, M.W.; McGuire, M.A.; Teskey, R.O.; Steppe, K. Changes in stem water content influence sap flux density measurements with thermal dissipation probes. Trees 2014, 28, 949–955. [Google Scholar] [CrossRef]
- Hölttä, T.; Linkosalo, T.; Riikonen, A.; Sevanto, S.; Nikinmaa, E. An analysis of Granier sap flow method, its sensitivity to heat storage and a new approach to improve its time dynamics. Agric. For. Meteorol. 2015, 211, 2–12. [Google Scholar] [CrossRef]
- Steppe, K.; De Pauw, D.J.; Doody, T.M.; Teskey, R.O. A comparison of sap flux density using thermal dissipation, heat pulse velocity and heat field deformation methods. Agric. For. Meteorol. 2010, 150, 1046–1056. [Google Scholar] [CrossRef]
- Bush, S.E.; Hultine, K.R.; Sperry, J.S.; Ehleringer, J.R. Calibration of thermal dissipation sap flow probes for ring-and diffuse-porous trees. Tree Physiol. 2010, 30, 1545–1554. [Google Scholar] [CrossRef] [PubMed]
- Ma, C.; Luo, Y.; Shao, M.; Li, X.; Sun, L.; Jia, X. Environmental controls on sap flow in black locust forest in Loess Plateau, China. Sci. Rep. 2017, 7, 13160. [Google Scholar] [CrossRef] [PubMed]
- Sun, H.; Aubrey, D.P.; Teskey, R.O. A simple calibration improved the accuracy of the thermal dissipation technique for sap flow measurements in juvenile trees of six species. Trees 2012, 26, 631–640. [Google Scholar] [CrossRef]
- Domec, J.-C.; Sun, G.; Noormets, A.; Gavazzi, M.J.; Treasure, E.A.; Cohen, E.; Swenson, J.J.; McNulty, S.G.; King, J.S. A comparison of three methods to estimate evapotranspiration in two contrasting loblolly pine plantations: Age-related changes in water use and drought sensitivity of evapotranspiration components. For. Sci. 2012, 58, 497–512. [Google Scholar] [CrossRef]
- Schütt, P.; Weisgerber, H.; Schuck, H.J.; Lang, U.M.; Stimm, B.; Roloff, A. Enzyklopädie der Laubbäume: Die große Enzyklopädie; Nikol Verlag Barkhausenweg: Hamburg, Germany, 2006; ISBN 978-3-937872-39-1. [Google Scholar]
- Vítková, M.; Müllerová, J.; Sádlo, J.; Pergl, J.; Pyšek, P. Black locust (Robinia pseudoacacia) beloved and despised: A story of an invasive tree in Central Europe. For. Ecol. Manag. 2017, 384, 287–302. [Google Scholar] [CrossRef]
- Lambdon, P.W.; Pyšek, P.; Basnou, C.; Hejda, M.; Arianoutsou, M.; Essl, F.; Jarošík, V.; Pergl, J.; Winter, M.; Anastasiu, P. Alien flora of Europe: Species diversity, temporal trends, geographical patterns and research needs. Preslia 2008, 80, 101–149. [Google Scholar]
- Cao, S.; Chen, L.; Shankman, D.; Wang, C.; Wang, X.; Zhang, H. Excessive reliance on afforestation in China’s arid and semi-arid regions: Lessons in ecological restoration. Earth-Sci. Rev. 2011, 104, 240–245. [Google Scholar] [CrossRef]
- Wang, J.J.; Hu, C.X.; Bai, J.; Gong, C.M. Carbon sequestration of mature black locust stands on the Loess Plateau, China. Plant Soil Environ. 2015, 61, 116–121. [Google Scholar]
- Zhang, J.-G.; Guan, J.-H.; Shi, W.-Y.; Yamanaka, N.; Du, S. Interannual variation in stand transpiration estimated by sap flow measurement in a semi-arid black locust plantation, Loess Plateau, China. Ecohydrology 2015, 8, 137–147. [Google Scholar] [CrossRef]
- Jiao, L.; Lu, N.; Sun, G.; Ward, E.J.; Fu, B. Biophysical controls on canopy transpiration in a black locust (Robinia pseudoacacia) plantation on the semi-arid Loess Plateau, China. Ecohydrology 2016, 9, 1068–1081. [Google Scholar] [CrossRef]
- Jiao, L.; Lu, N.; Fu, B.; Gao, G.; Wang, S.; Jin, T.; Zhang, L.; Liu, J.; Zhang, D. Comparison of transpiration between different aged black locust (Robinia pseudoacacia) trees on the semi-arid Loess Plateau, China. J. Arid Land 2016, 8, 604–617. [Google Scholar] [CrossRef]
- Granier, A. Une nouvelle méthode pour la mesure du flux de sève brute dans le tronc des arbres. In Annales des Sciences Forestières; EDP Sciences: Les Ulis, France, 1985; Volume 42, pp. 193–200. [Google Scholar]
- Renninger, H.J.; Schäfer, K.V.R. Comparison of tissue heat balance-and thermal dissipation-derived sap flow measurements in ring-porous oaks and a pine. Front. Plant Sci. 2012, 3, 103. [Google Scholar] [CrossRef] [PubMed]
- Jian, S.; Zhao, C.; Fang, S.; Yu, K. Effects of different vegetation restoration on soil water storage and water balance in the Chinese Loess Plateau. Agric. For. Meteorol. 2015, 206, 85–96. [Google Scholar] [CrossRef]
- Wang, Y.-L.; Liu, G.-B.; Kume, T.; Otsuki, K.; Yamanaka, N.; Du, S. Estimating water use of a black locust plantation by the thermal dissipation probe method in the semiarid region of Loess Plateau, China. J. For. Res. 2010, 15, 241–251. [Google Scholar] [CrossRef]
- Chen, L.; Zhang, Z.; Zeppel, M.; Liu, C.; Guo, J.; Zhu, J.; Zhang, X.; Zhang, J.; Zha, T. Response of transpiration to rain pulses for two tree species in a semiarid plantation. Int. J. Biometeorol. 2014, 58, 1569–1581. [Google Scholar] [CrossRef] [PubMed]
- Wu, Y.; Zhang, Y.; An, J.; Liu, Q.; Lang, Y. Sap flow of black locust in response to environmental factors in two soils developed from different parent materials in the lithoid mountainous area of North China. Trees 2018, 1–14. [Google Scholar] [CrossRef]
- Chen, Y.; Wang, K.; Lin, Y.; Shi, W.; Song, Y.; He, X. Balancing green and grain trade. Nat. Geosci. 2015, 8, 739–741. [Google Scholar] [CrossRef]
- Zhang, L.; Podlasly, C.; Feger, K.-H.; Wang, Y.; Schwärzel, K. Different land management measures and climate change impacts on the runoff–A simple empirical method derived in a mesoscale catchment on the Loess Plateau. J. Arid Environ. 2015, 120, 42–50. [Google Scholar] [CrossRef]
- Sun, G.; Zhou, G.; Zhang, Z.; Wei, X.; McNulty, S.G.; Vose, J.M. Potential water yield reduction due to forestation across China. J. Hydrol. 2006, 328, 548–558. [Google Scholar] [CrossRef]
- Feng, X.; Fu, B.; Piao, S.; Wang, S.; Ciais, P.; Zeng, Z.; Lü, Y.; Zeng, Y.; Li, Y.; Jiang, X. Revegetation in China’s Loess Plateau is approaching sustainable water resource limits. Nat. Clim. Chang. 2016, 6, 1019–1022. [Google Scholar] [CrossRef]
- Zimmermann, M.H. Hydraulic architecture of some diffuse-porous trees. Can. J. Bot. 1978, 56, 2286–2295. [Google Scholar] [CrossRef]
- Vertessy, R.A.; Hatton, T.J.; Reece, P.; O’sullivan, S.K.; Benyon, R.G. Estimating stand water use of large mountain ash trees and validation of the sap flow measurement technique. Tree Physiol. 1997, 17, 747–756. [Google Scholar] [CrossRef] [PubMed]
- Braun, P.; Schmid, J. Sap flow measurements in grapevines (Vitis vinifera L.) 2. Granier measurements. Plant Soil 1999, 215, 47–55. [Google Scholar] [CrossRef]
- Yu, M.; Zhang, L.; Xu, X.; Feger, K.-H.; Wang, Y.; Liu, W.; Schwärzel, K. Impact of land-use changes on soil hydraulic properties of Calcaric Regosols on the Loess Plateau, NW China. J. Plant Nutr. Soil Sci. 2015, 178, 486–498. [Google Scholar] [CrossRef]
- Du, S.; Wang, Y.-L.; Kume, T.; Zhang, J.-G.; Otsuki, K.; Yamanaka, N.; Liu, G.-B. Sapflow characteristics and climatic responses in three forest species in the semiarid Loess Plateau region of China. Agric. For. Meteorol. 2011, 151, 1–10. [Google Scholar] [CrossRef]
- Schwärzel, K.; Menzer, A.; Clausnitzer, F.; Spank, U.; Häntzschel, J.; Grünwald, T.; Köstner, B.; Bernhofer, C.; Feger, K.-H. Soil water content measurements deliver reliable estimates of water fluxes: A comparative study in a beech and a spruce stand in the Tharandt forest (Saxony, Germany). Agric. For. Meteorol. 2009, 149, 1994–2006. [Google Scholar] [CrossRef]
- Bogena, H.R.; Herbst, M.; Huisman, J.A.; Rosenbaum, U.; Weuthen, A.; Vereecken, H. Potential of wireless sensor networks for measuring soil water content variability. Vadose Zone J. 2010, 9, 1002–1013. [Google Scholar] [CrossRef]
- Qu, W.; Bogena, H.R.; Huisman, J.A.; Vereecken, H. Calibration of a novel low-cost soil water content sensor based on a ring oscillator. Vadose Zone J. 2013, 12. [Google Scholar] [CrossRef]
- Khalil, M.; Sakai, M.; Mizoguchi, M.; Miyazaki, T. Current and prospective applications of zero flux plane (ZFP) method. J. Jpn. Soc. Soil Phys. 2003, 95, 75–90. [Google Scholar]
- Podlasly, C.; Schwärzel, K. Development of a continuous closed pipe system for controlling soil temperature at the lower boundary of weighing field lysimeters. Soil Sci. Soc. Am. J. 2013, 77, 2157–2163. [Google Scholar] [CrossRef]
- Sano, Y.; Okamura, Y.; Utsumi, Y. Visualizing water-conduction pathways of living trees: Selection of dyes and tissue preparation methods. Tree Physiol. 2005, 25, 269–275. [Google Scholar] [CrossRef] [PubMed]
- Clausnitzer, F.; Köstner, B.; Schwärzel, K.; Bernhofer, C. Relationships between canopy transpiration, atmospheric conditions and soil water availability—Analyses of long-term sap-flow measurements in an old Norway spruce forest at the Ore Mountains/Germany. Agric. For. Meteorol. 2011, 151, 1023–1034. [Google Scholar] [CrossRef]
- Allen, R.G.; Pereira, L.S.; Raes, D.; Smith, M. Crop evapotranspiration-Guidelines for computing crop water requirements-FAO Irrigation and drainage paper 56. FAO Rome 1998, 300, D05109. [Google Scholar]
- Wang, L.; Wei, S.; Horton, R.; Shao, M. Effects of vegetation and slope aspect on water budget in the hill and gully region of the Loess Plateau of China. Catena 2011, 87, 90–100. [Google Scholar] [CrossRef]
- McCulloh, K.; Sperry, J.S.; Lachenbruch, B.; Meinzer, F.C.; Reich, P.B.; Voelker, S. Moving water well: Comparing hydraulic efficiency in twigs and trunks of coniferous, ring-porous, and diffuse-porous saplings from temperate and tropical forests. New Phytol. 2010, 186, 439–450. [Google Scholar] [CrossRef] [PubMed]
- Kume, T.; Otsuki, K.; Du, S.; Yamanaka, N.; Wang, Y.-L.; Liu, G.-B. Spatial variation in sap flow velocity in semiarid region trees: Its impact on stand-scale transpiration estimates. Hydrol. Process. 2012, 26, 1161–1168. [Google Scholar] [CrossRef]
- Umebayashi, T.; Utsumi, Y.; Koga, S.; Inoue, S.; Fujikawa, S.; Arakawa, K.; Matsumura, J.; Oda, K. Conducting pathways in north temperate deciduous broadleaved trees. IAWA J. 2008, 29, 247–263. [Google Scholar] [CrossRef]
- Zimmerman, M.H.; Brown, C.L. Trees: Structure and Function; Springer-Verlag: New York, NY, USA, 1971. [Google Scholar]
- Huber, B.; Schmidt, E. Weitere thermoelektrische Untersuchungen über den Transpirationsstrom der Bäume. Tharandter Forstl. Jahrb. 1936, 87, 369–412. [Google Scholar]
- Taneda, H.; Sperry, J.S. A case-study of water transport in co-occurring ring-versus diffuse-porous trees: Contrasts in water-status, conducting capacity, cavitation and vessel refilling. Tree Physiol. 2008, 28, 1641–1651. [Google Scholar] [CrossRef] [PubMed]
- De Oliveira Reis, F.; Campostrini, E.; de Sousa, E.F.; e Silva, M.G. Sap flow in papaya plants: Laboratory calibrations and relationships with gas exchanges under field conditions. Sci. Hortic. 2006, 110, 254–259. [Google Scholar] [CrossRef]
- Hultine, K.R.; Nagler, P.L.; Morino, K.; Bush, S.E.; Burtch, K.G.; Dennison, P.E.; Glenn, E.P.; Ehleringer, J.R. Sap flux-scaled transpiration by tamarisk (Tamarix spp.) before, during and after episodic defoliation by the saltcedar leaf beetle (Diorhabda carinulata). Agric. For. Meteorol. 2010, 150, 1467–1475. [Google Scholar] [CrossRef]
- Jacobsen, A.L.; Pratt, R.B.; Tobin, M.F.; Hacke, U.G.; Ewers, F.W. A global analysis of xylem vessel length in woody plants. Am. J. Bot. 2012, 99, 1583–1591. [Google Scholar] [CrossRef] [PubMed]
- Zimmermann, M.H.; Jeje, A.A. Vessel-length distribution in stems of some American woody plant. Can. J. Bot. 1981, 59, 1882–1892. [Google Scholar]
- Nagata, A.; Kose, K.; Terada, Y. Development of an outdoor MRI system for measuring flow in a living tree. J. Magn. Reson. 2016, 265, 129–138. [Google Scholar] [CrossRef] [PubMed]
- Lu, P.; Urban, L.; Zhao, P. Granier’s thermal dissipation probe (TDP) method for measuring sap flow in trees: Theory and practice. Acta Bot. Sin. 2004, 46, 631–646. [Google Scholar]
- Granier, A.; Anfodillo, T.; Sabatti, M.; Cochard, H.; Dreyer, E.; Tomasi, M.; Valentini, R.; Bréda, N. Axial and radial water flow in the trunks of oak trees: A quantitative and qualitative analysis. Tree Physiol. 1994, 14, 1383–1396. [Google Scholar] [CrossRef] [PubMed]
- Wang, Y. The hydrological influence of black locust plantations in the loess area of northwest China. Hydrol. Process. 1992, 6, 241–251. [Google Scholar]
- Wu, Y.Z.; Huang, M.B.; Warrington, D.N. Black locust transpiration responses to soil water availability as affected by meteorological factors and soil texture. Pedosphere 2015, 25, 57–71. [Google Scholar] [CrossRef]
Figure 1.
(a) Schematic of the cut tree experiment, 1 = Mariotte water supply, 2 = Differential pressure sensor, 3 = Data logger, 4 = Valve, 5 = Collar, 6 = Pipe for water level control, 7 = Lashing belt, 8 = Collar; (b) Prototype of a collar, K = Diameter, all dimensions in cm.
Figure 1.
(a) Schematic of the cut tree experiment, 1 = Mariotte water supply, 2 = Differential pressure sensor, 3 = Data logger, 4 = Valve, 5 = Collar, 6 = Pipe for water level control, 7 = Lashing belt, 8 = Collar; (b) Prototype of a collar, K = Diameter, all dimensions in cm.

Figure 2.
(a) Daily rainfall and daily averages of the soil pressure head at the depths of 20 and 40 cm of black locust (upper) and (b) soil hydraulic gradients (middle) for the period from 1 May to 30 June 2012 as well as (c) sums of tree transpiration (Tbl), understory evapotranspiration (ETus), total evapotranspiration (ETtotal), and FAO grass reference evapotranspiration for the period from 2 to 24 June 2012 (bottom).

Figure 3.
Time series of (a) global radiation, vapor pressure deficit (upper) and (b) sap flow density of individual trees with different diameter at breast height (bottom) for the period 21 to 24 June. The legend in the bottom figure provides the diameter (in cm) at breast height of the individual trees.

Figure 4.
Dye-stained area of the sample tree. The dye penetrated only the outermost growth ring. This area represents the hydrologically active sapwood.
Figure 4.
Dye-stained area of the sample tree. The dye penetrated only the outermost growth ring. This area represents the hydrologically active sapwood.

Figure 5.
The possible impact of total active sapwood area on stand transpiration estimate.

Figure 6.
Relationship between the sap flux density and the normalized sensor parameter (k in Equation (3)).
Figure 6.
Relationship between the sap flux density and the normalized sensor parameter (k in Equation (3)).


Table 1.
Sap flow studies carried out in black locust stands across the Loess Plateau region. All the studies used Granier’s original calibration for the calculation of the sap flow densities, i.e., Equation (3). MAT = mean annual temperature, MAP = mean annual precipitation, LAI = Leaf Area Index, DBH = diameter at breast height, AS = sapwood area, AG = stand ground surface, TBL = transpiration of the black locust stand, N.S. = not specified.
| Study Area | Understory | MAT [°C] | MAP [mm year−1] | LAImax | Mean DBH [cm] | Number of Trees [ha−1] | AS/AG [m2ha−1] | Sapwood Thickness [mm] | TBL [mm d−1] | Relationship between DBH and AS | Source |
|---|---|---|---|---|---|---|---|---|---|---|---|
| Mt. Gonglushan, Yan’an 36°25′24″ N 109°31′ 32″ E | Grass and a few scattered shrubs | 10.6 | 498 | 2.89 | 9.3 | 3100 | 5.10 | 5–10 (mean 7.3) | 0.41 | AS = 0.546DBH1.508 | [29] |
| Mt. Gonglushan, Yan’an 36°25ʹ40″ N 109°31′ 53″ E | Small trees and shrubs | 10.6 | 498 | 2.89 | 9.3 | N.S. | N.S. | 7.2–9.2 | N.S. | N.S. | [40] |
| Caijiachuan catchment, Ji county 36°14′ 27″ to 36°18′23″ N 110°39′45″ to 110°47′45″ E | N.S. | 10.0 | 579 | N.S. | 6.9 | 850 | 1.57 | N.S. | <0.2 | AS = 3.4DBH−8.7 | [30] |
| Mt. Gonglushan, Yan’an 36°25′24″ N 109°31′32″ E | Grass and a few scattered shrubs | 10.6 | 498 | 2.73–3.14 | 9.3 | 3100 | 5.09 | 5–10 | 0.32 to 0.49 | AS = 0.546DBH1.508 | [23] |
| Yangjuangou, Yan’an 36°42′ N 109°31′ E | Patches of liana and herbs | 9.8 | 531 | 2.32–2.98 | 9.9–10.8 | 1300 | 3.16 to 3.60 | N.S. | 0.14 to 0.23 | AS = 0.61DBH1.55 | [24] |
| Yangjuangou, Yan’an 36°42′ N 109°31′ E | N.S. | 9.8 | 531 | 2.77 (12 years old) 2.38 (28 years old) | 6.94 (12 years old) 8.93 (28 years old) | 2500 (12 years old) 1200 (28 years old) | 3.16 to 3.60 | 15.4 (12 years old) 8.4 (28 years old) | 0.22 (12 years old) 0.39 (28 years old) | AS = 0.28DBH2.25 (12 years old) AS = 0.25DBH1.81 (28 years old) | [25] |
| Yeheshan forest reserve, Fufeng county 34°31′46″ N 107°54′40″ E | Grass | 12.7 | 580 | 2.4–.8 | 6.0−11 | 2450 (15 years old) | 5.13 to 5.30 | 10 ± 2 | 0.12−0.16 * | AS = 0.4024DBH1.9 | [15] |
| Zhonggou, 35°20′ N 107°31′ E | Grass and a few scattered shrubs | 10.2 | 509 | 2.8 | 10.7 | 1006 (33 years old) | 0.61 | 3.43 | 0.08 * | AS = 0.0604DBH1.882 | This study |
* This estimate is based on Granier’s original calibration but Ma et al. [15] developed a tree-specific calibration based on lab experiments.
Table 2.
Summary of the calibration of Granier’s sensors for different ring-porous tree species. The coefficients a and b are fitting parameters for converting the measured temperature differences into sap flow densities according to Equation (3).
Table 2.
Summary of the calibration of Granier’s sensors for different ring-porous tree species. The coefficients a and b are fitting parameters for converting the measured temperature differences into sap flow densities according to Equation (3).
| Tree Species | Characteristics of the Tree and Stem Segments | a [kg m−2 s−1] | b [–] | Calibration Set-Up | Source |
|---|---|---|---|---|---|
| Elaeagnus Angustifolia (Russian Olive) | Diameter 4.36 cm, water-conducting sapwood area 1.70 cm2 | 9.30 | 1.65 | Lab experiments on cut stem segments: water was pulled through stem by applying varying pressure gradients, whereby the pressure was increased in several smaller steps ranging from 0.001 to 0.14 MPa m−1 | [14] |
| Gleditsia Triacanthos (Honey Locust) | Diameter 5.06 cm, water-conducting sapwood area 0.73 cm2 | 30.7 | 1.40 | ||
| Qercus Gambelii (Gambel Oak) | Diameter 4.37 cm, water-conducting sapwood area 0.35 cm2 | 58.1 | 1.88 | ||
| Sophora Japonica (Japanese Pagoda) | Diameter of stem segments 4.47 cm, water-conducting sapwood area 0.51 cm2 | 11.90 | 1.24 | ||
| Quercus Pedunuculata (English Oak) | Diameter of stem segments between 4 and 5 cm | 0.119 | 1.231 | Lab experiment on cut stem segments: water was forced through stem segments under pressure, flow rate was varied by adjusting the water pressure | [26] |
| Quercus Petraea (Sessile Oak) | Diameter of the stem 13.7 cm | 0.119 | 1.231 | Cut tree experiment: water flow through the tree due to transpiration | [62] |
| Quercus Alba (White Oak) | Juvenile trees, diameter between 6.5 and 9 cm | 0.128 | 1.47 | Potometer experiments: juvenile trees were cut and placed in containers, water flow through the cut stems due to transpiration | [16] |
| Ulmus Americana (American Elm) | Juvenile trees, diameter between 6.5 and 9 cm | 0.272 | 2.57 | ||
| Qercus Gambelii (Gambel Oak) | 4–7 years old, diameter of the stem segment was between 5 and 6 cm | 9.99 ± 6.18 (ranging from 2.38 to 18.1) | 1.24 ± 0.19 (ranging from 1.05 to 1.50) | Lab experiments on cut stem segments: water was pulled through stem by applying varying pressure gradients, whereby the pressure increased in several smaller steps | [55] |
| Robinia Pseudoacacia (Black Locust) | 15 years old stand, diameter 6–10 cm, 97–102 cm long, sapwood area 12.6–31.5 cm2 | 0.051 | 1.18 | Lab experiments on cut stem segments: water was pulled through stem by applying a series of pressure 0.005–0.04 MPa, whereby each pressure was achieved by varying the height of the reservoir and held for 30 min | [15] |
| Robinia Pseudoacacia (Black Locust) | 33 years old stand, diameter 14.3 cm, 13 m long, active sapwood area 7.16 cm2 | 3.29 (ranging from 2.70 to 3.89) | 1.231 | Cut tree experiment, water flow through the tree due to transpiration | this study |
Table 3.
Water balance components of a black locust stand with understory determined in periods with little or no rainfall. ETtotal was determined using the zero-flux-plane method (soil water balance, Equation (1)), ETus was measured using a weighable lysimeter (Equation (2)), TBL was determined using the heat dissipation method (Equations (3) and (4)), and Tresidual was calculated from the difference between ETtotal and ETus. ETFAO = grass reference evapotranspiration, ET = evapotranspiration, T = transpiration, US = understory, BL = black locust.
| Period | Days | Rainfall (Open Land) | ETFAO | ETtotal (Soil Water Balance) | ETus (Lysimeter) | TBL (Sap Flow) | Tresidual (ETtotal − ETus) | Difference between the Two Transpiration Estimates (TBL − Tresidual) |
|---|---|---|---|---|---|---|---|---|
| [mm] | ||||||||
| 2 June 2012–24 June 2012 | 23 | 4.4 | 77.3 | 82.2 | 51.0 | 27.7 (1.2 *) | 31.2 | 11% |
| 29 May 2013–7 June 2013 | 10 | 2.2 | 39.0 | 34.4 | 24.7 | 13.9 (1.4) | 9.7 | 30% |
| 12 June 2013–18 June 2013 | 8 | 0.7 | 25.2 | 23.2 | 17.4 | 7.0 (1.1) | 5.8 | 26% |
| 23 June 2013–30 June 2013 | 8 | 1.1 | 39.0 | 33.2 | 23.5 | 10.4 (1.3) | 9.7 | 7% |
| 28 July 2013–6 August 2013 | 10 | 0.3 | 46.2 | 39.7 | 30.6 | 12.1 (1.2) | 9.1 | 33% |
| 12 August 2013–23 August 2013 | 12 | 0.0 | 51.7 | 41.8 | 29.5 | 14.0 (1.2) | 12.3 | 14% |
(*) The transpiration rates of the black locust stand in mm d−1 are shown in parentheses.
© 2018 by the authors. Licensee MDPI, Basel, Switzerland. This article is an open access article distributed under the terms and conditions of the Creative Commons Attribution (CC BY) license (http://creativecommons.org/licenses/by/4.0/).
Share and Cite
MDPI and ACS Style
Schwärzel, K.; Zhang, L.; Strecker, A.; Podlasly, C. Improved Water Consumption Estimates of Black Locust Plantations in China’s Loess Plateau. Forests 2018, 9, 201. https://doi.org/10.3390/f9040201
AMA Style
Schwärzel K, Zhang L, Strecker A, Podlasly C. Improved Water Consumption Estimates of Black Locust Plantations in China’s Loess Plateau. Forests. 2018; 9(4):201. https://doi.org/10.3390/f9040201
Chicago/Turabian StyleSchwärzel, Kai, Lulu Zhang, Andreas Strecker, and Christian Podlasly. 2018. "Improved Water Consumption Estimates of Black Locust Plantations in China’s Loess Plateau" Forests 9, no. 4: 201. https://doi.org/10.3390/f9040201
Note that from the first issue of 2016, this journal uses article numbers instead of page numbers. See further details here.