Article

Degradation Kinetics of Lignocellulolytic Enzymes in a Biogas Reactor Using Quantitative Mass Spectrometry

1
Bioprocess Engineering, Max Planck Institute for Dynamics of Complex Technical Systems, 39106 Magdeburg, Germany
2
System Microbiology, Department Bioengineering, Leibniz Institute for Agricultural Engineering and Bioeconomy (ATB), Max-Eyth-Allee 100, 14469 Potsdam, Germany
3
Environmental Microbiology, Institute of Environmental Technology, Faculty of Process Sciences, Technische Universität Berlin, Ernst-Reuter-Platz 1, 10587 Berlin, Germany
4
Institute of Agricultural and Urban Ecological Projects, Berlin Humboldt University (IASP), Philippstr. 13, 10115 Berlin, Germany
5
Biosystems Engineering Division, Humboldt Universität zu Berlin, Albrecht-Thaer-Weg 3, 14195 Berlin, Germany
6
Division of Glycoscience, Department of Chemistry, School of Engineering Science in Chemistry, Biotechnology and Health (CBH), Alba Nova University Center, Royal Institute of Technology (KTH), Roslagstullsbacken 21, 10691 Stockholm, Sweden
7
Bioprocess Engineering, Otto von Guericke University Magdeburg, Universitätsplatz 2, 39106 Magdeburg, Germany
8
Applied Biosciences and Process Engineering, Anhalt University of Applied Sciences, Bernburger Straße 55, 06366 Köthen, Germany
*
Author to whom correspondence should be addressed.
These authors contributed equally to this work.
Fermentation 2023, 9(1), 67; https://doi.org/10.3390/fermentation9010067
Submission received: 14 December 2022 / Revised: 5 January 2023 / Accepted: 5 January 2023 / Published: 12 January 2023

Abstract

:
The supplementation of lignocellulose-degrading enzymes can be used to enhance the performance of biogas production in industrial biogas plants. Since the structural stability of these enzyme preparations is essential for efficient application, reliable methods for the assessment of enzyme stability are crucial. Here, a mass-spectrometric-based assay was established to monitor the structural stability of enzymes, i.e., the structural integrity of these proteins, in anaerobic digestion (AD). The analysis of extracts of Lentinula edodes revealed the rapid degradation of lignocellulose-degrading enzymes, with an approximate half-life of 1.5 h. The observed low structural stability of lignocellulose-degrading enzymes in AD corresponded with previous results obtained for biogas content. The established workflow can be easily adapted for the monitoring of other enzyme formulations and provides a platform for evaluating the effects of enzyme additions in AD, together with a characterization of the biochemical methane potential used in order to determine the biodegradability of organic substrates.

Graphical Abstract

1. Introduction

Biogas reactors produce renewable energy by degrading agricultural crops, animal waste, livestock residues, and other industrial by-products. Biogas production should preferably be carried out with by-products and waste products in order to reduce the use of energy crops and increase the sustainability of the process. Through anaerobic digestion (AD), organic matter is converted into biogas, composed mainly of methane and carbon dioxide. The AD process consists of distinct steps and is catalyzed by complex microbial communities. In the first step, biomass is broken down by bacteria and archaea into amino acids, sugars, and shorter-chain carbohydrates. This hydrolysis is hampered by the recalcitrant structure of lignocellulosic substrates, composed of cellulose, hemicellulose, pectin, lignin, extractives, and various inorganic materials [1,2,3]. Therefore, long retention times are required for the lignocellulose-rich substrates in the anaerobic digester [3]. Although, bacteria are capable of synthesizing hydrolytic enzymes, such as cellulases and hemicellulases. However, even with a longer retention time, lignin cannot be degraded under anaerobic conditions [2,4]. Physical, chemical, and biological pre-treatments, such as acid hydrolysis and steam explosion [3], as well as enzymatic, fungal, and bacterial pre-treatment to enhance substrate conversion, are the focus of numerous investigations [5]. Treatment or pre-treatment with enzymes is especially advantageous as this accelerates the process [6,7].
A promising strategy to improve the degradation of lignocellulosic biomass is the addition of enzymes derived from cellulose-consuming fungi. The application of fungal enzymes is advantageous because they can be extracted from the by-products of industrial mushroom cultivation, resulting in sustainable processes with low costs [8]. However, Binner et al. [9] have shown that externally added enzymes are often structurally unstable under the conditions required for AD.
The effect of enzyme supplementation is often quantified by measuring the biochemical methane potential (BMP). Here, for a more comprehensive evaluation of the effects of external enzymes on AD, the structural stability of fungal enzymes in AD was investigated using quantitative mass spectrometry. Therefore, a preparation from the edible fungus L. edodes, containing lignocellulolytic enzymes, such as cellulase, xylanase, and pectinase, was investigated.

2. Materials and Methods

2.1. Bioreactor Set-Up and Sampling

Two identical continuous stirred tank reactors (CSTRs) were operated to evaluate the structural stability of the supplemented enzymes in the biogas reactor medium. The CSTRs had a total volume of 24 L, with a working volume of approximately 16.5 L. Operation of the CSTRs was described in a previous study on the semi-continuous AD of whole-crop cereal silage (wheat: rye [1:1], DAH Energie, Oberkrämer, Germany) at an organic loading rate of 3.5 g of organic dry mass (ODM) L−1 d−1 under mesophilic conditions at 38 °C [10]. During this experiment, 75 µL of fungal enzyme preparation was added to the biogas reactor per L reactor volume, daily. The inoculum for the reactor start-up was obtained from an agricultural biogas plant (Kaim Agrar-Energie, Nauen, Germany). The collection of reactor content for subsequent experiments was conducted six months after inoculation under steady-state conditions and 21 h after the addition of substrate. The mean biogas yields for both CSTRs were 0.63 L g−1 ODM and 0.60 L g−1 ODM, respectively, with a methane percentage of 54%. The reactor content was frozen in liquid nitrogen immediately after sampling and stored at −20 °C until further analysis.

2.2. Enzyme Preparation

Partially purified lignocellulolytic enzymes obtained from the by-products of industrial mushroom cultivation were prepared as previously described [8] with minor modifications. Briefly, a spent mushroom substrate from the cultivation of L. edodes was chopped after the fruiting bodies were harvested. An enzyme extract was generated by watering, pressing, and filtering the chopped residues. The resulting liquid (pressed juice) was centrifuged at 4 °C for 5 min at 20,000× g (Sigma Zentrifugen, Osterode, Germany). The supernatant was concentrated ten-fold using tangential flow filtration (Lab scale TFF System, Merck, Darmstadt, Germany) with a 10 kDa MWCO membrane (Biomax, Merck, Darmstadt, Germany). The concentrated enzyme extract was supplemented with maltodextrin and sodium benzoate to final concentrations of 4% and 0.5% for conservation, respectively, and stored at −20 °C.

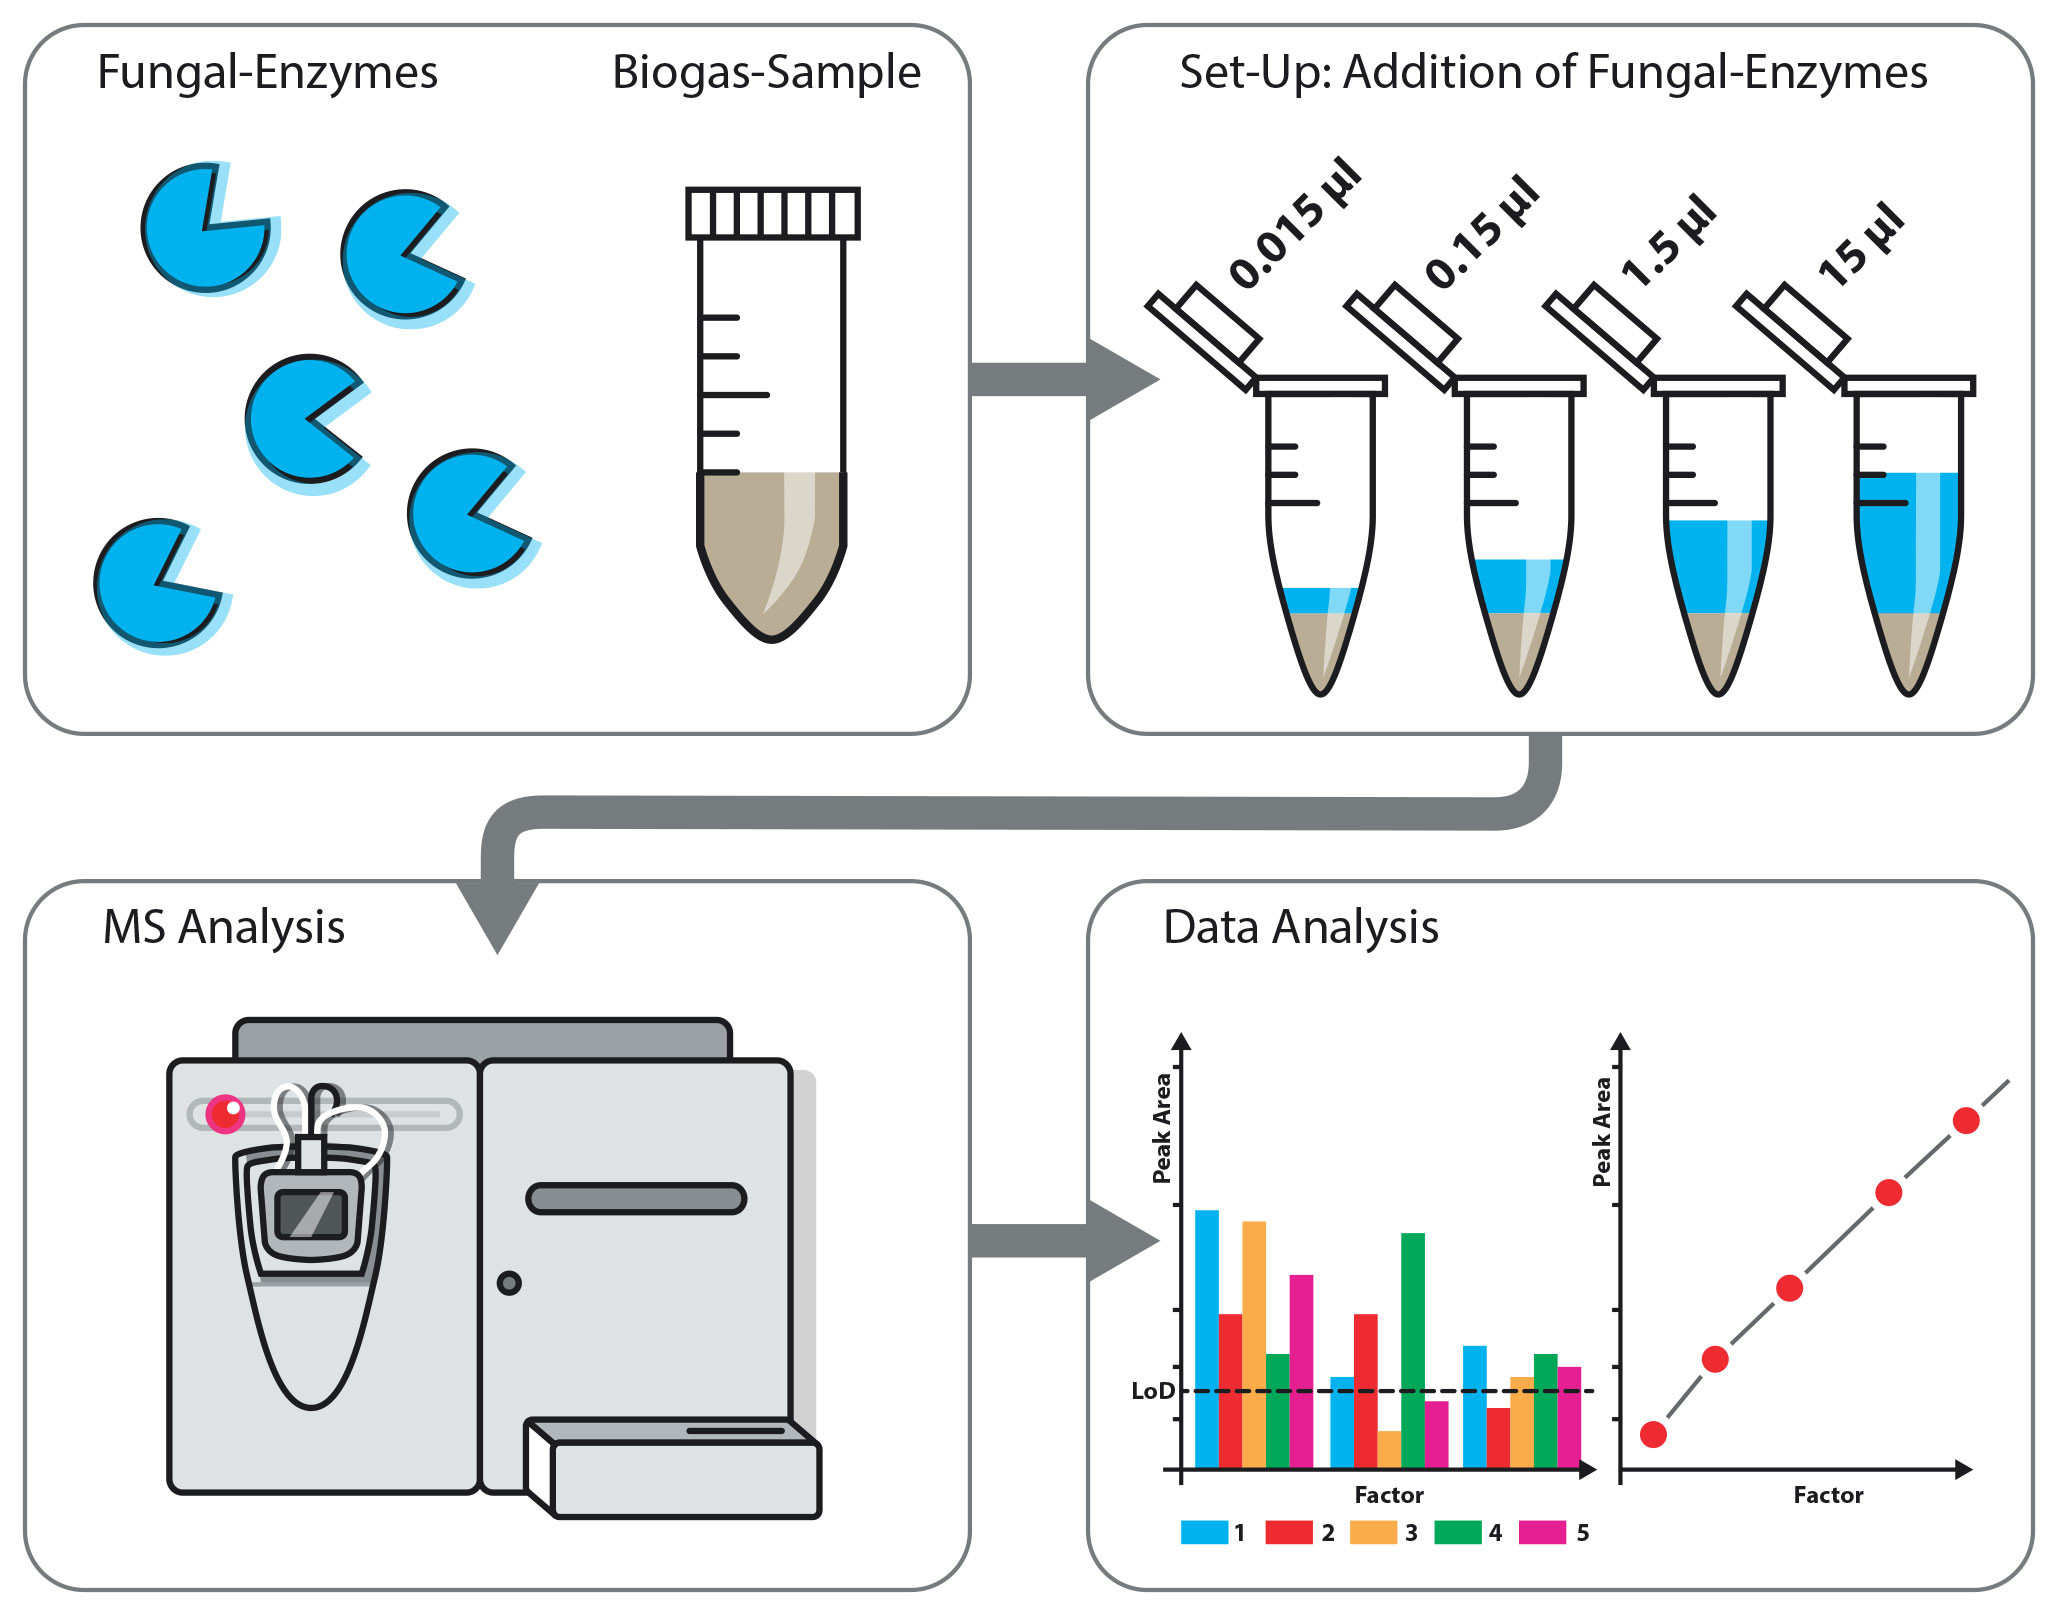
2.3. Addition of Fungal Enzymes

To assess the structural stability of the fungal enzymes in the preparation, various dilutions were added to 2 mL of reactor content. The volume of fungal enzymes was set to 0.015 µL (factor 1), 0.15 µL (factor 10), 1.5 µL (factor 100), and 15 µL (factor 1000). Factor 1 corresponds to the amount of enzyme added to the reactors during the experiment as described above, whereas the multiplied factors (10-, 100-, and 1000-fold) were added in order to determine the sensitivity of the quantitative mass spectrometry and to provide stronger signals for measuring the structural stability of the fungal enzymes. A control sample of the biogas reactor medium (no treatment), was served as a blank. After adding the fungal enzyme preparation, the bioreactor medium was incubated at 37 °C and sampled after 0, 4, 10, and 24 h.

2.4. Sample Preparation

2.4.1. Protein Precipitation

The phenol extraction was performed according to the protocol of Heyer et al. [11]. In brief, a 2 mL sample was added into a 15 mL tube with 5 g of silica beads (Ø = 0.5 mm), 2 mL of sucrose solution, and 3.5 mL of phenol solution (10 g of phenol dissolved in 1 mL of ultrapure water). Then, the proteins were extracted by adding an equal volume of trichloroacetic acid (20%, w/v, Sigma Aldrich) to the samples. After incubation for 1 h at 4 °C, the samples were centrifuged (10 min, 16,400× g, 4 °C) (Micro Star 17R, VWR, Darmstadt, Deutschland) and precipitated twice with 1.5 mL of ice-cold acetone (80% v/v, 99.8%) and ethanol (70%, v/v, 99.8%) for 15 min, respectively. The dried pellets were resuspended in 200 µL of urea buffer (8 M of urea (Applichem) in 0.1 M of Tris-HCl, pH 8.5).

2.4.2. Protein Quantification

The protein concentrations were determined in triplicates using a modified amido black assay as reported previously [11]. Briefly, 300 µL of amido black solution was added to 50 µL of the sample and mixed. After a centrifugation step (5 min, RT, 16,400× g), the supernatant was discarded, and the pellets were washed twice with 10% acetic acid in methanol in order to remove the unbound staining solution. The pellets were then dissolved in 0.1 M of sodium hydroxide and the absorbance was measured at 615 nm using a spectrophotometer (Genesys 10S UV-Vis spectrophotometer, Thermo Scientific, Waltham, MA, USA).

2.5. Tryptic Digestion

Tryptic digestion of the proteins was performed according to a modified filter-assisted sample preparation protocol described elsewhere [12]. For this purpose, a sample volume equivalent to 100 µg of protein was diluted with 8 M of urea to a total volume of 200 µL. The samples were then loaded onto a 10 kDa filter (Pall Nanosep, VWR, 516-8492) in a 1.5 mL reaction tube. After washing with 200 µL of urea buffer, the samples were treated with 40 mM of dithiothreitol (20 min, 300 rpm, 56 °C) and 0.55 M of iodoacetamide (20 min, 300 rpm, room temperature (RT), in the dark) and centrifuged (10,000× g, 10 min, RT, also for subsequent steps). The filter was washed once with 100 µL of urea buffer and three times with 50 mM of ammonium bicarbonate. For subsequent tryptic digestion, 200 µL of trypsin solution (2.5 μg mL−1 trypsin in ammonium bicarbonate buffer; Trypsin mass spectrometric (MS)-approved, Serva) was added to the filter. The samples were then incubated at 37 °C and 300 rpm for 2 h and centrifuged. The samples were washed with 50 µL of extraction buffer (50 mM of ammonium bicarbonate +5% LC-MS grade acetonitrile) and 50 µL of water (LC-MS grade). The flow-through from the trypsin incubation and the two subsequent washing steps was collected and 30 µL of each was transferred to separate tubes for acidification. Three microliters of trifluoroacetic acid (99.99%, w/v, Sigma Aldrich) were added and the samples were centrifuged (10 min, 4 °C, 10,000× g) (Micro Star 17R) before being transferred to vials for mass spectrometric measurements.

2.6. Chromatography and Mass Spectrometry

Analysis of the samples was performed using a liquid chromatography (LC)-coupled mass spectrometry system. Three microliters of each sample were injected and separated by an UltiMate® 3000 nano splitless reversed phase nanoHPLC (Thermo Fisher Scientific), equipped with a reversed-phase trap column (nano trap cartridge, 300 μm i.d. × 5 mm, packed with Acclaim PepMap100 C18, 5 μm, 100 Å, nanoViper) and a reversed-phase separation column (Acclaim PepMap RSLC, C18, 2 μm, 75 μm, 50 cm). The gradient was set from 5 to 35% mobile phase B (LC-MS grade acetonitrile, 0.1% formic acid, (99% v/v)) at a flow rate of 0.4 μL min−1. The LC was coupled with a timsTOF Pro mass spectrometer (Bruker Daltonik GmbH), equipped with a captive spray ionization source operated in a positive ion mode with a capillary voltage of 1400 V and a capillary temperature of 200 °C. In total, three different modes were used for the MS measurements: Parallel Accumulation–Serial Fragmentation (PASEF) with a 120 min gradient, a Sequential Window Acquisition of all Theoretical Mass Spectra (SWATH-MS) [13], and multiple reaction monitoring mode (MRM) with a 30 min LC gradient. The spectra acquisition rate was set to 7.5 Hz for SWATH-MS and 4 Hz for MRM. For SWATH-MS, the scan range for MS1 was set to 400–1000 m/z with 24 isolation windows of 26 m/z (1 m/z overlap). For all three modes, the resulting total cycle time for a complete scan of the mass range was 3.2 s. The collision energy ranged from 27 to 48 eV (slope = 0.042; intercept = 9.45). The scan range for MS2 was set from 150 to 2200 m/z.

2.7. Data Analysis

The PASEF data were processed using the spectrometry-based pro software CompassData Analysis (vs. 5.3, Bruker Daltonik). The mgf files were searched with MASCOT against a database containing the Uniprot genome of the fungus L. edodes. For the initial analysis, the open-source software Skyline (vs. 19.1) [14] was used to analyze the raw files from the MRM and SWATH-MS measurements. In order to validate the spectra, the dat files from the MASCOT searches were used to set-up a spectral library containing peptide spectra of L. edodes. The parameters of the software were set to “enzyme = trypsin”, “maximal missed cleavages = 0”, and “structural modifications = carbamidomethyl (cysteine)”. The peptide areas were exported as CSV files and processed into pivot tables with excel.
In order to compare the MRM and SWATH-MS results and to determine the half-life constant of kinetic degradation for ten selected peptides of the fungal enzymes, a limit of detection (LoD) and a limit of quantification (LoQ) was introduced. The calculations were based on the peak area of blank samples (factor 0, time point 0) for every peptide for the measured duplicates. The LoD was determined as the sum of the average peak area of the two replicates (xmean) and the standard deviation (ysd) times 3.29. In order to determine the LoQ, the standard deviation was multiplied by ten, as described previously [15,16].
LoD = xmean + 3.29∙ysd
LoQ = xmean + 10∙ysd
In order to quantify the degradation of the enzymes, the peak area values from the MS measurements were fitted by first-order kinetics. From this, the values for the half-life (t1/2) of each selected peptide were calculated using the formula for exponential degradation and the decay constant of the regression fit (b):
t1/2 = ln(2)/b

3. Results and Discussion

3.1. Detection of Enzyme Proteins

The addition of lignocellulose-degrading enzymes for the improvement of biogas production processes has been described previously in the literature and was tested in various experimental studies [9,17,18]. Since the structural stability of enzyme preparations is crucial for efficient application, reliable methods for assessing the structural stability of these proteins are needed. In contrast to studies that have been conducted in this field that used mainly semi-quantitative techniques [9,19], this study aimed to monitor the degradation kinetics of the lignocellulolytic enzymes of fungal origin using an MS-based approach. Consequently, the first step was to develop a quantitative MS-based assay that would allow the detection of enzymes in AD samples.
In order to investigate the sensitivity of our workflow, the fungal enzymes were added to samples of the biogas reactor content at different concentrations. For the first assessment, standard PASEF measurements and subsequent database searches against the genome of L. edodes were carried out. Although the detection of fungal enzymes with cellulolytic activity failed in the samples representing working concentrations in the bioreactor (factor 1, factor 10), higher concentrations, in particular factor 1000, enabled the detection of proteins from L. edodes (Table 1 and Figure S1). In contrast, hydrolytic enzymes from bacteria (glucanase, xylanase) were detected with high abundance in the biogas reactors [20] using the applied workflow [11] combining phenol extraction and mechanical disruption in the bead mill. The low abundance of fungal proteins in highly sensitive PASEF measurements, as well as the limitation of PASEF in quantification using spectral counts, required the setup of SWATH-MS and MRM techniques as more sensitive and quantitative MS methods.

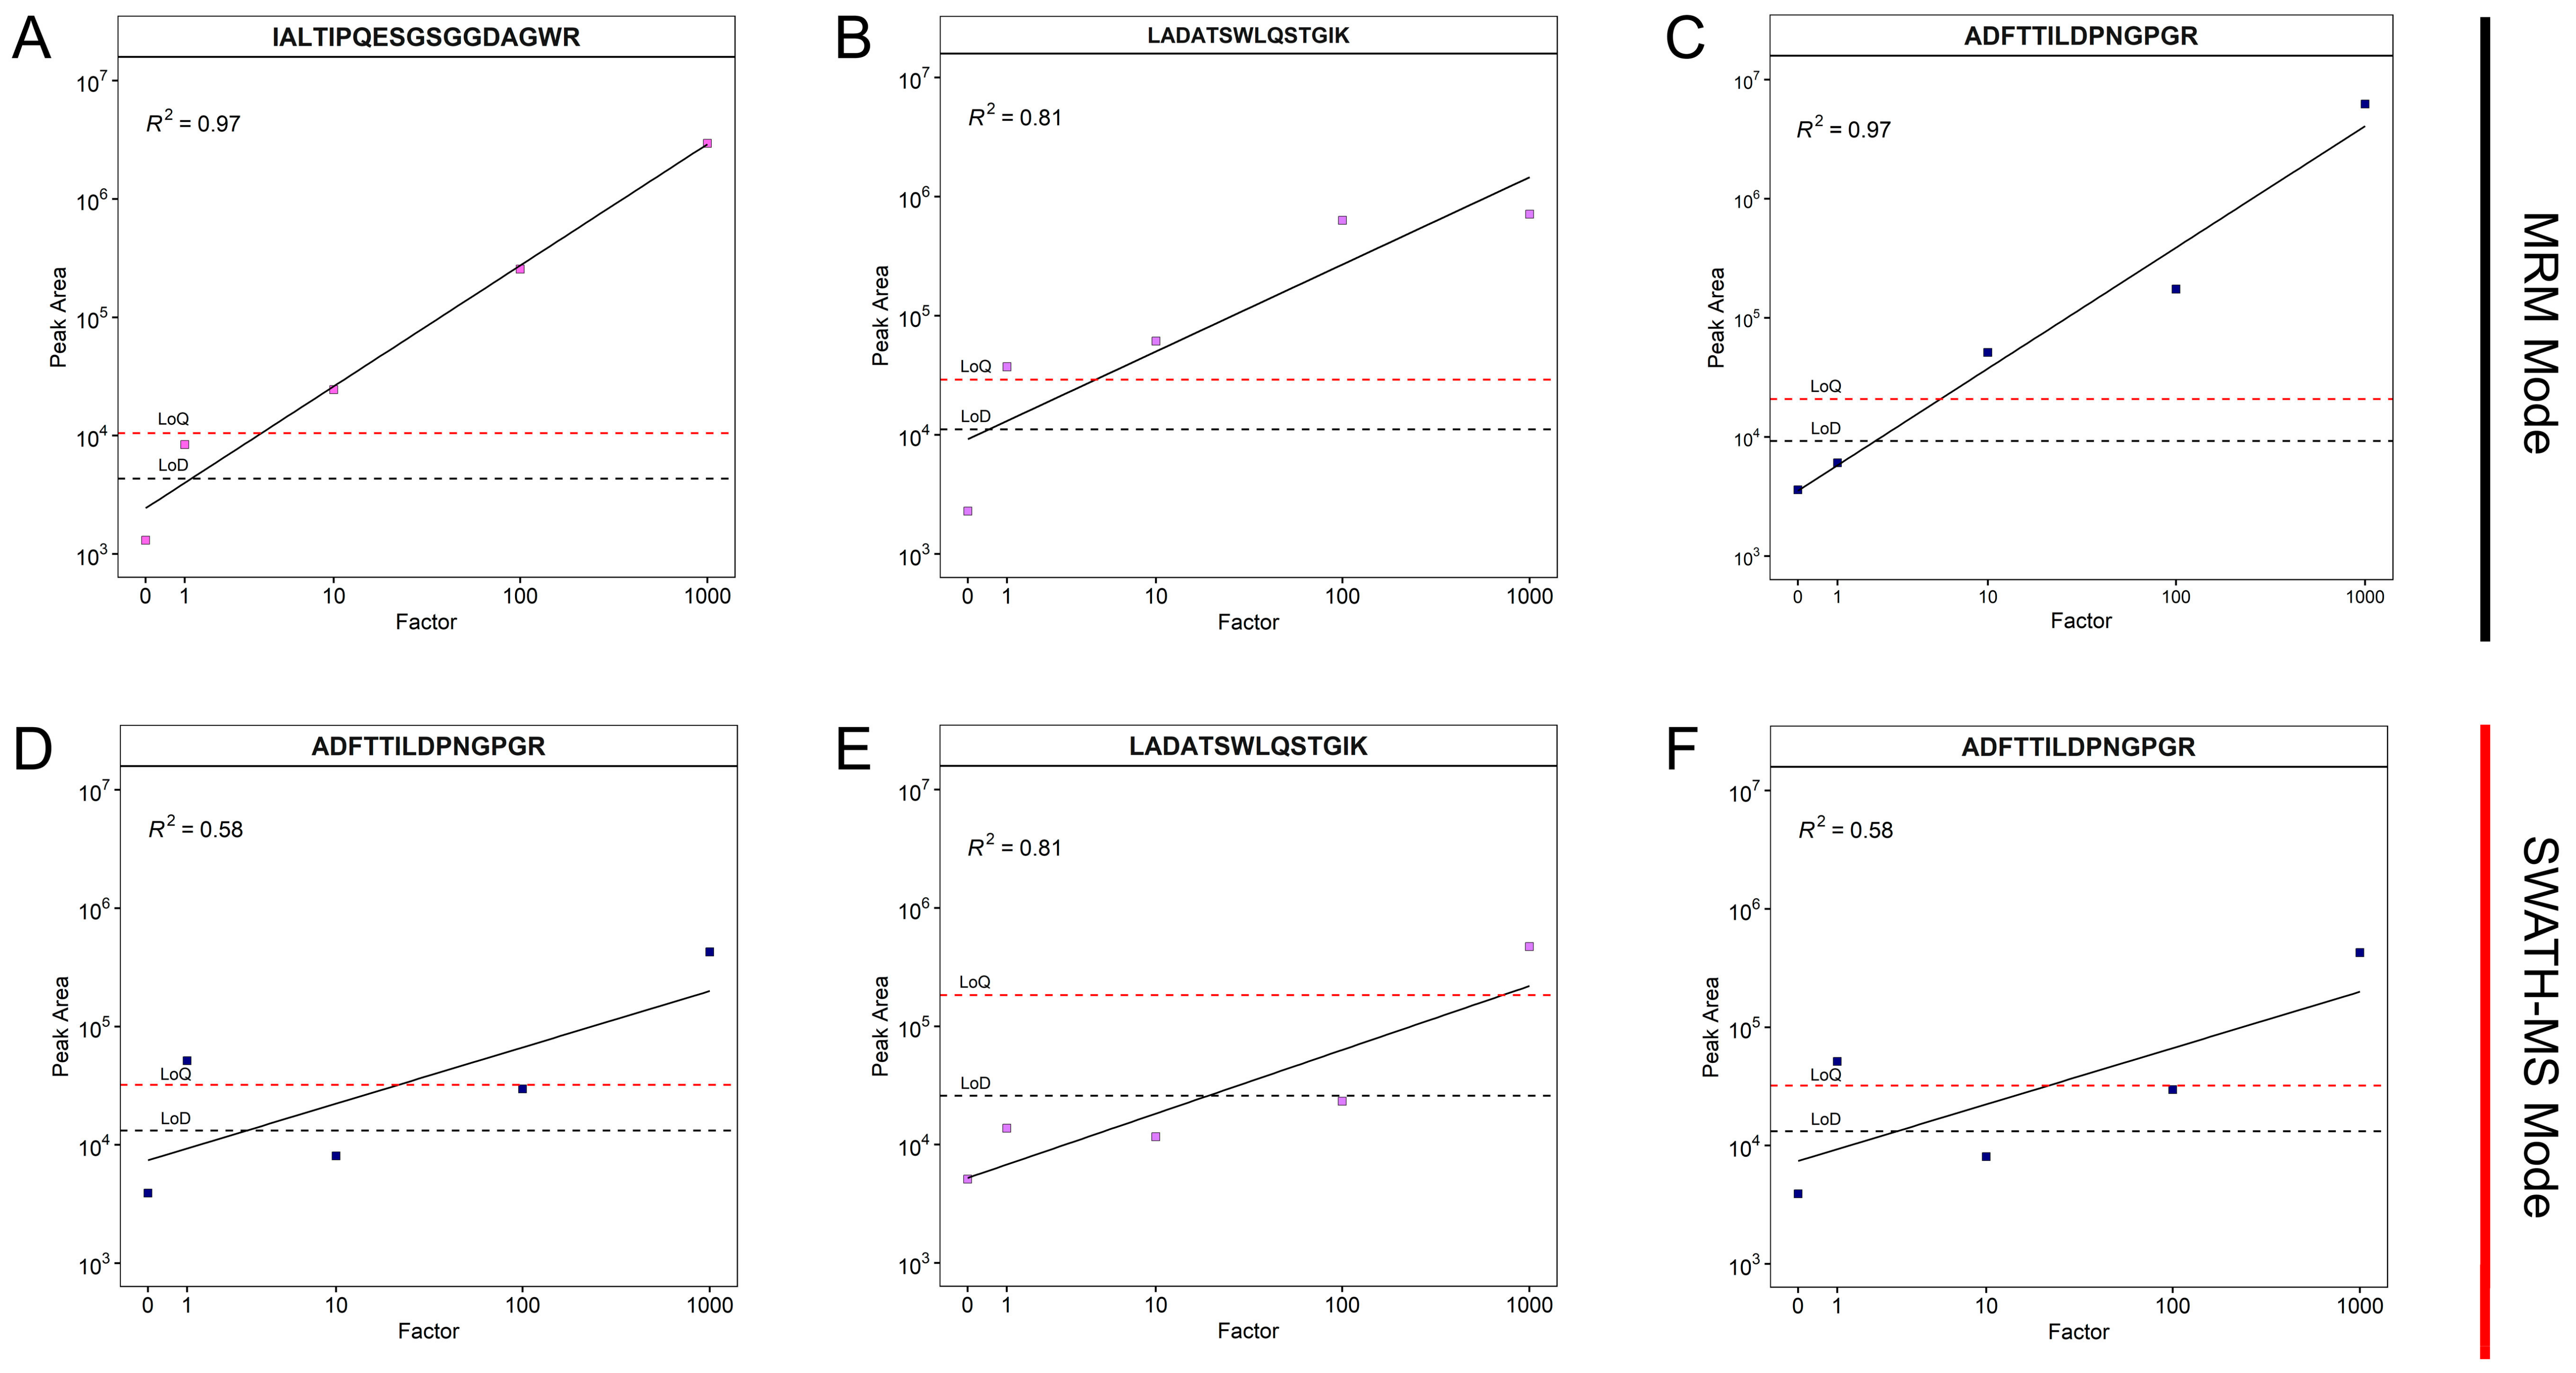
3.2. Selection of Signature Peptides and Validation of the Assay

Based on the detected fungal enzymes in the AD samples using PASEF at factor of 1000, the discovered proteins were filtered for peptides specific to the lignocellulolytic enzymes. We focused on the technical criteria: detectability, mainly intensity and signal-to-noise ratio. In addition, we aimed for a wide coverage of the different families of hydrolytic enzymes. Finally, ten peptides were selected for further investigation of the degradation dynamics based on the initial SWATH-MS measurements (Table 2).
To facilitate the detection of the selected peptides, SWATH-MS and MRM were tested in order to maximize the signal-to-noise ratio and intensity. The signal-to-noise ratio and intensity were 5-fold higher in the MRM mode than in SWATH-MS, resulting in an overall higher sensitivity compared to SWATH-MS (Figure 1, Figures S1 and S2 ). Furthermore, the linearity of the peak area ranged from a factor of 1 to a factor of 1000 in the MRM mode, whereas in the SWATH-MS mode, the linearity ranged from factor 10 to 1000 only (Figure S1). These results are in accordance with previous studies showing a higher sensitivity and a better signal-to-noise ratio for MRM, especially for complex samples [21,22]. Overall, this suggested that the MRM mode was better suited to detect a small number of the selected peptides due to its precise selection of precursor ions. In contrast, SWATH-MS with widely defined mass windows for precursor selection seems to be better suited to obtain an overview of the proteins and peptides present in samples. In conclusion, SWATH-MS could support the selection of signature peptides, whereas the MRM provides maximum sensitivity.

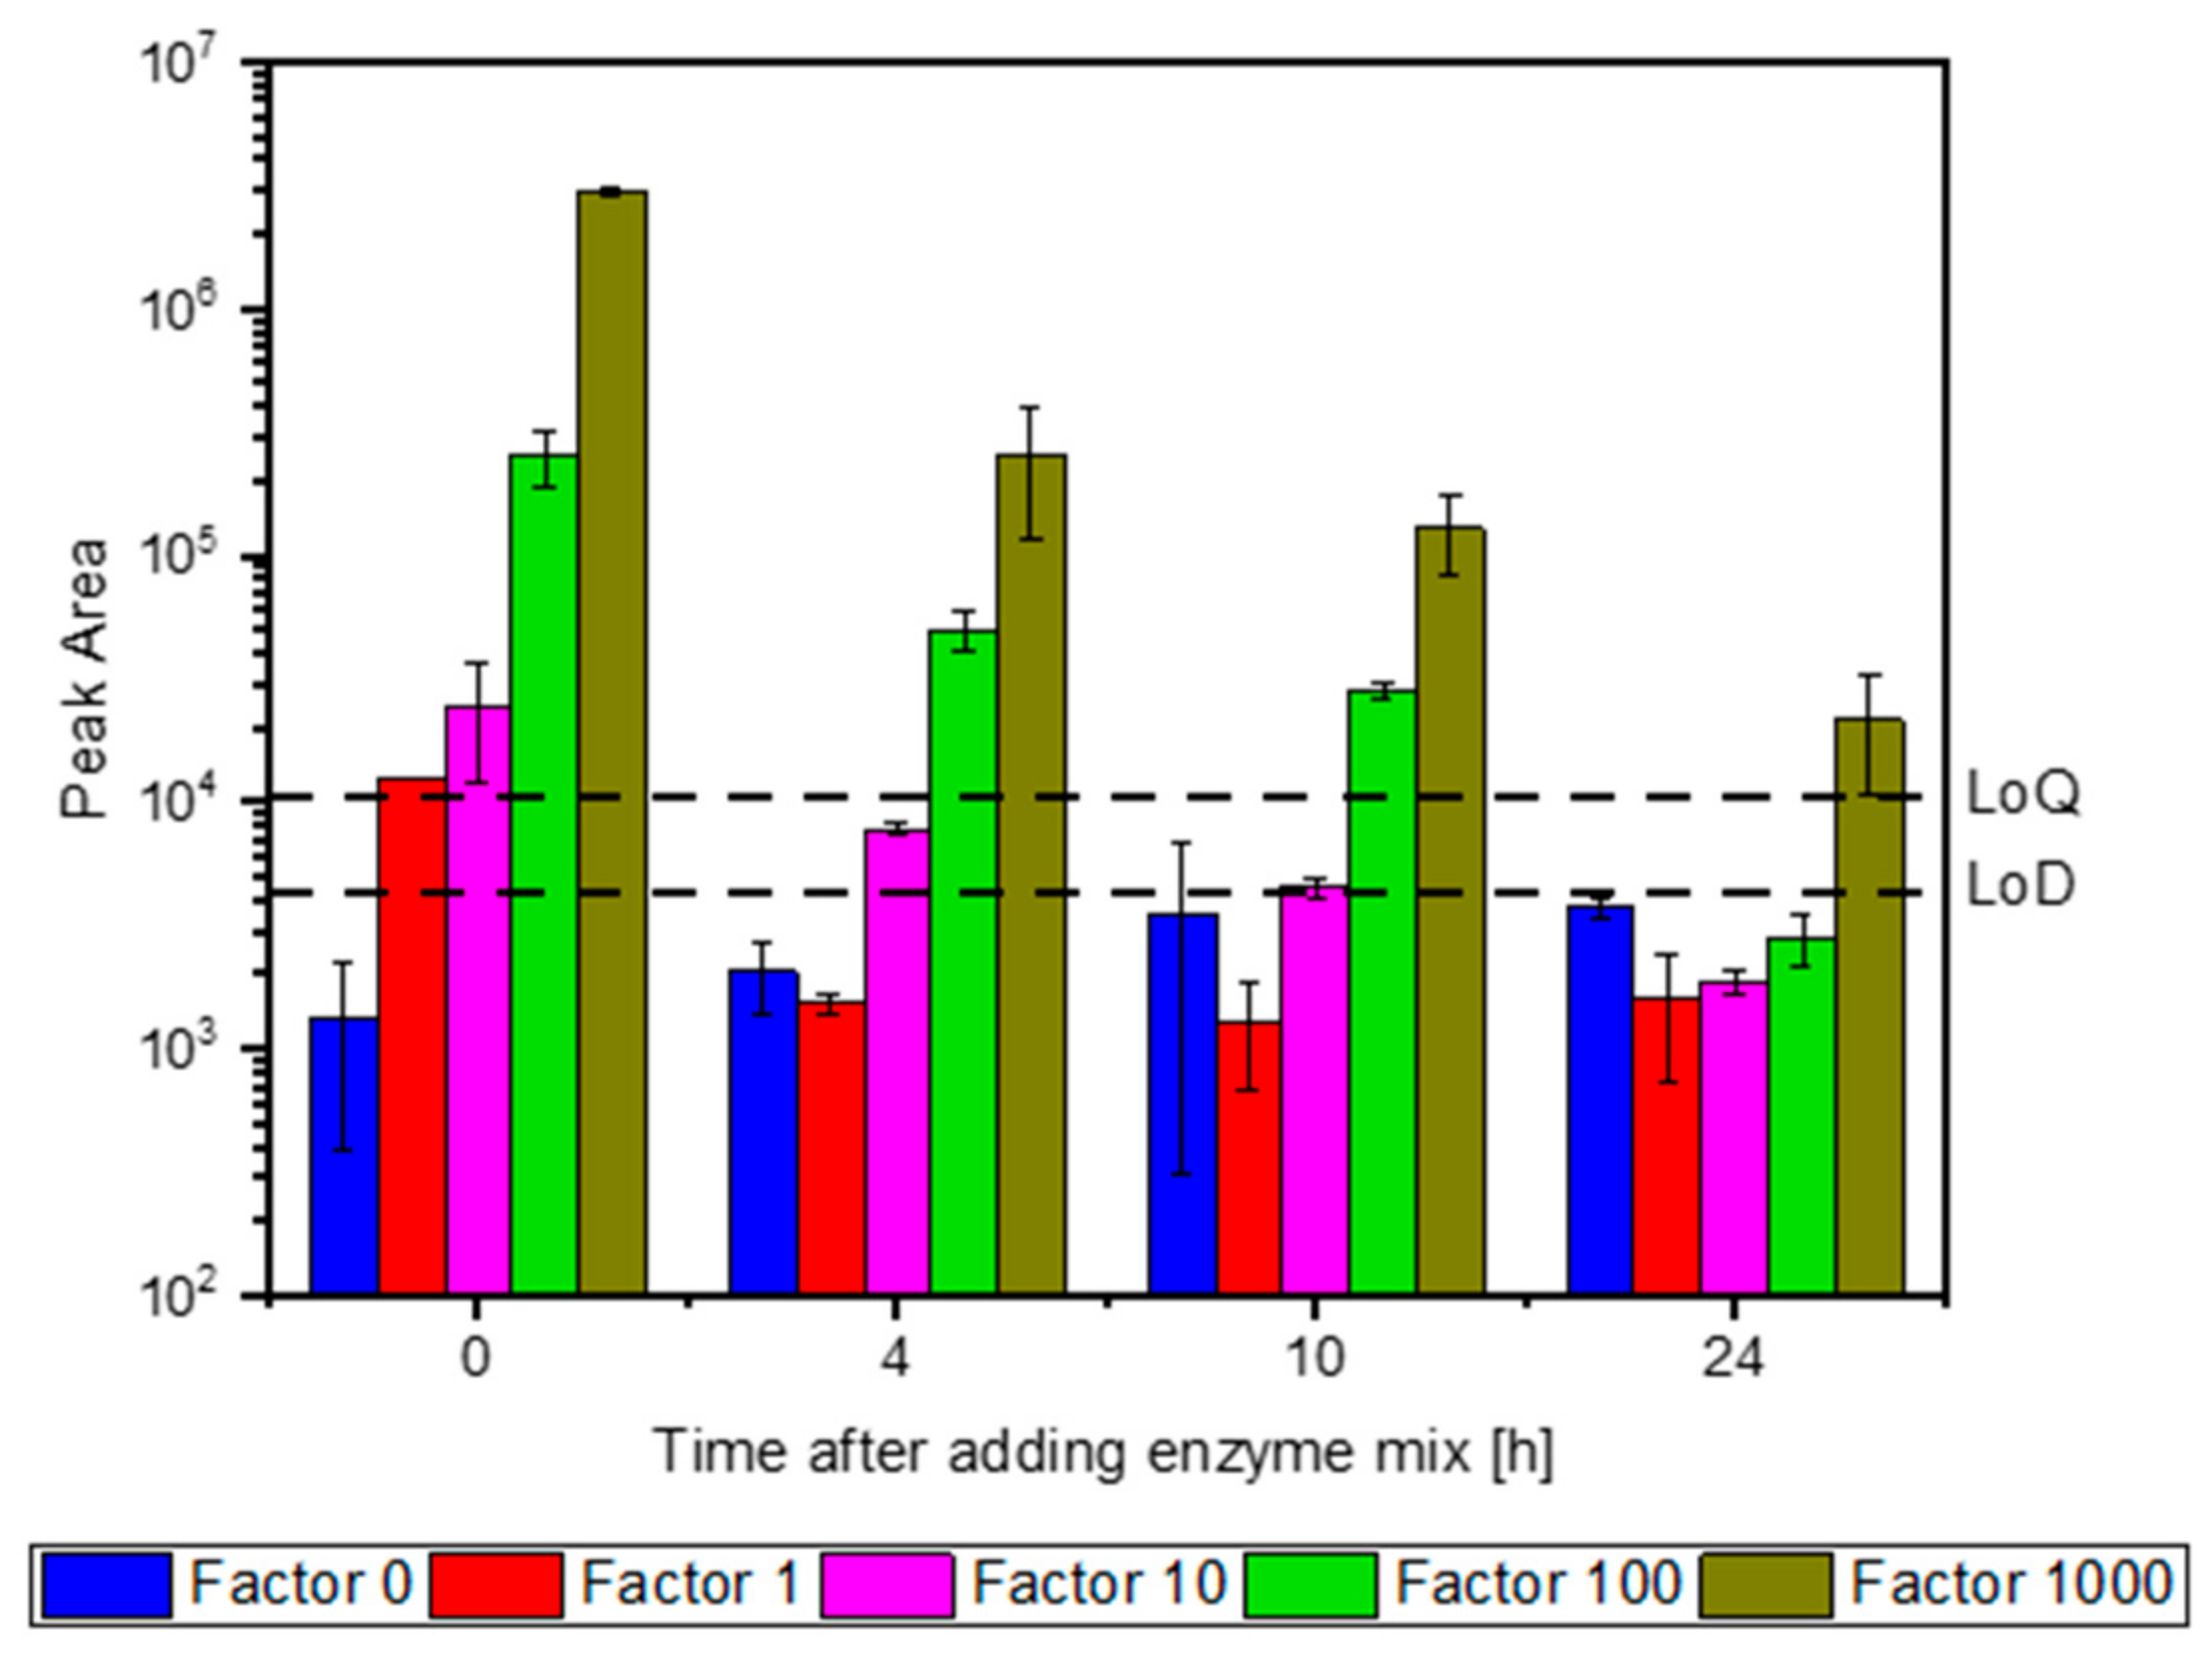
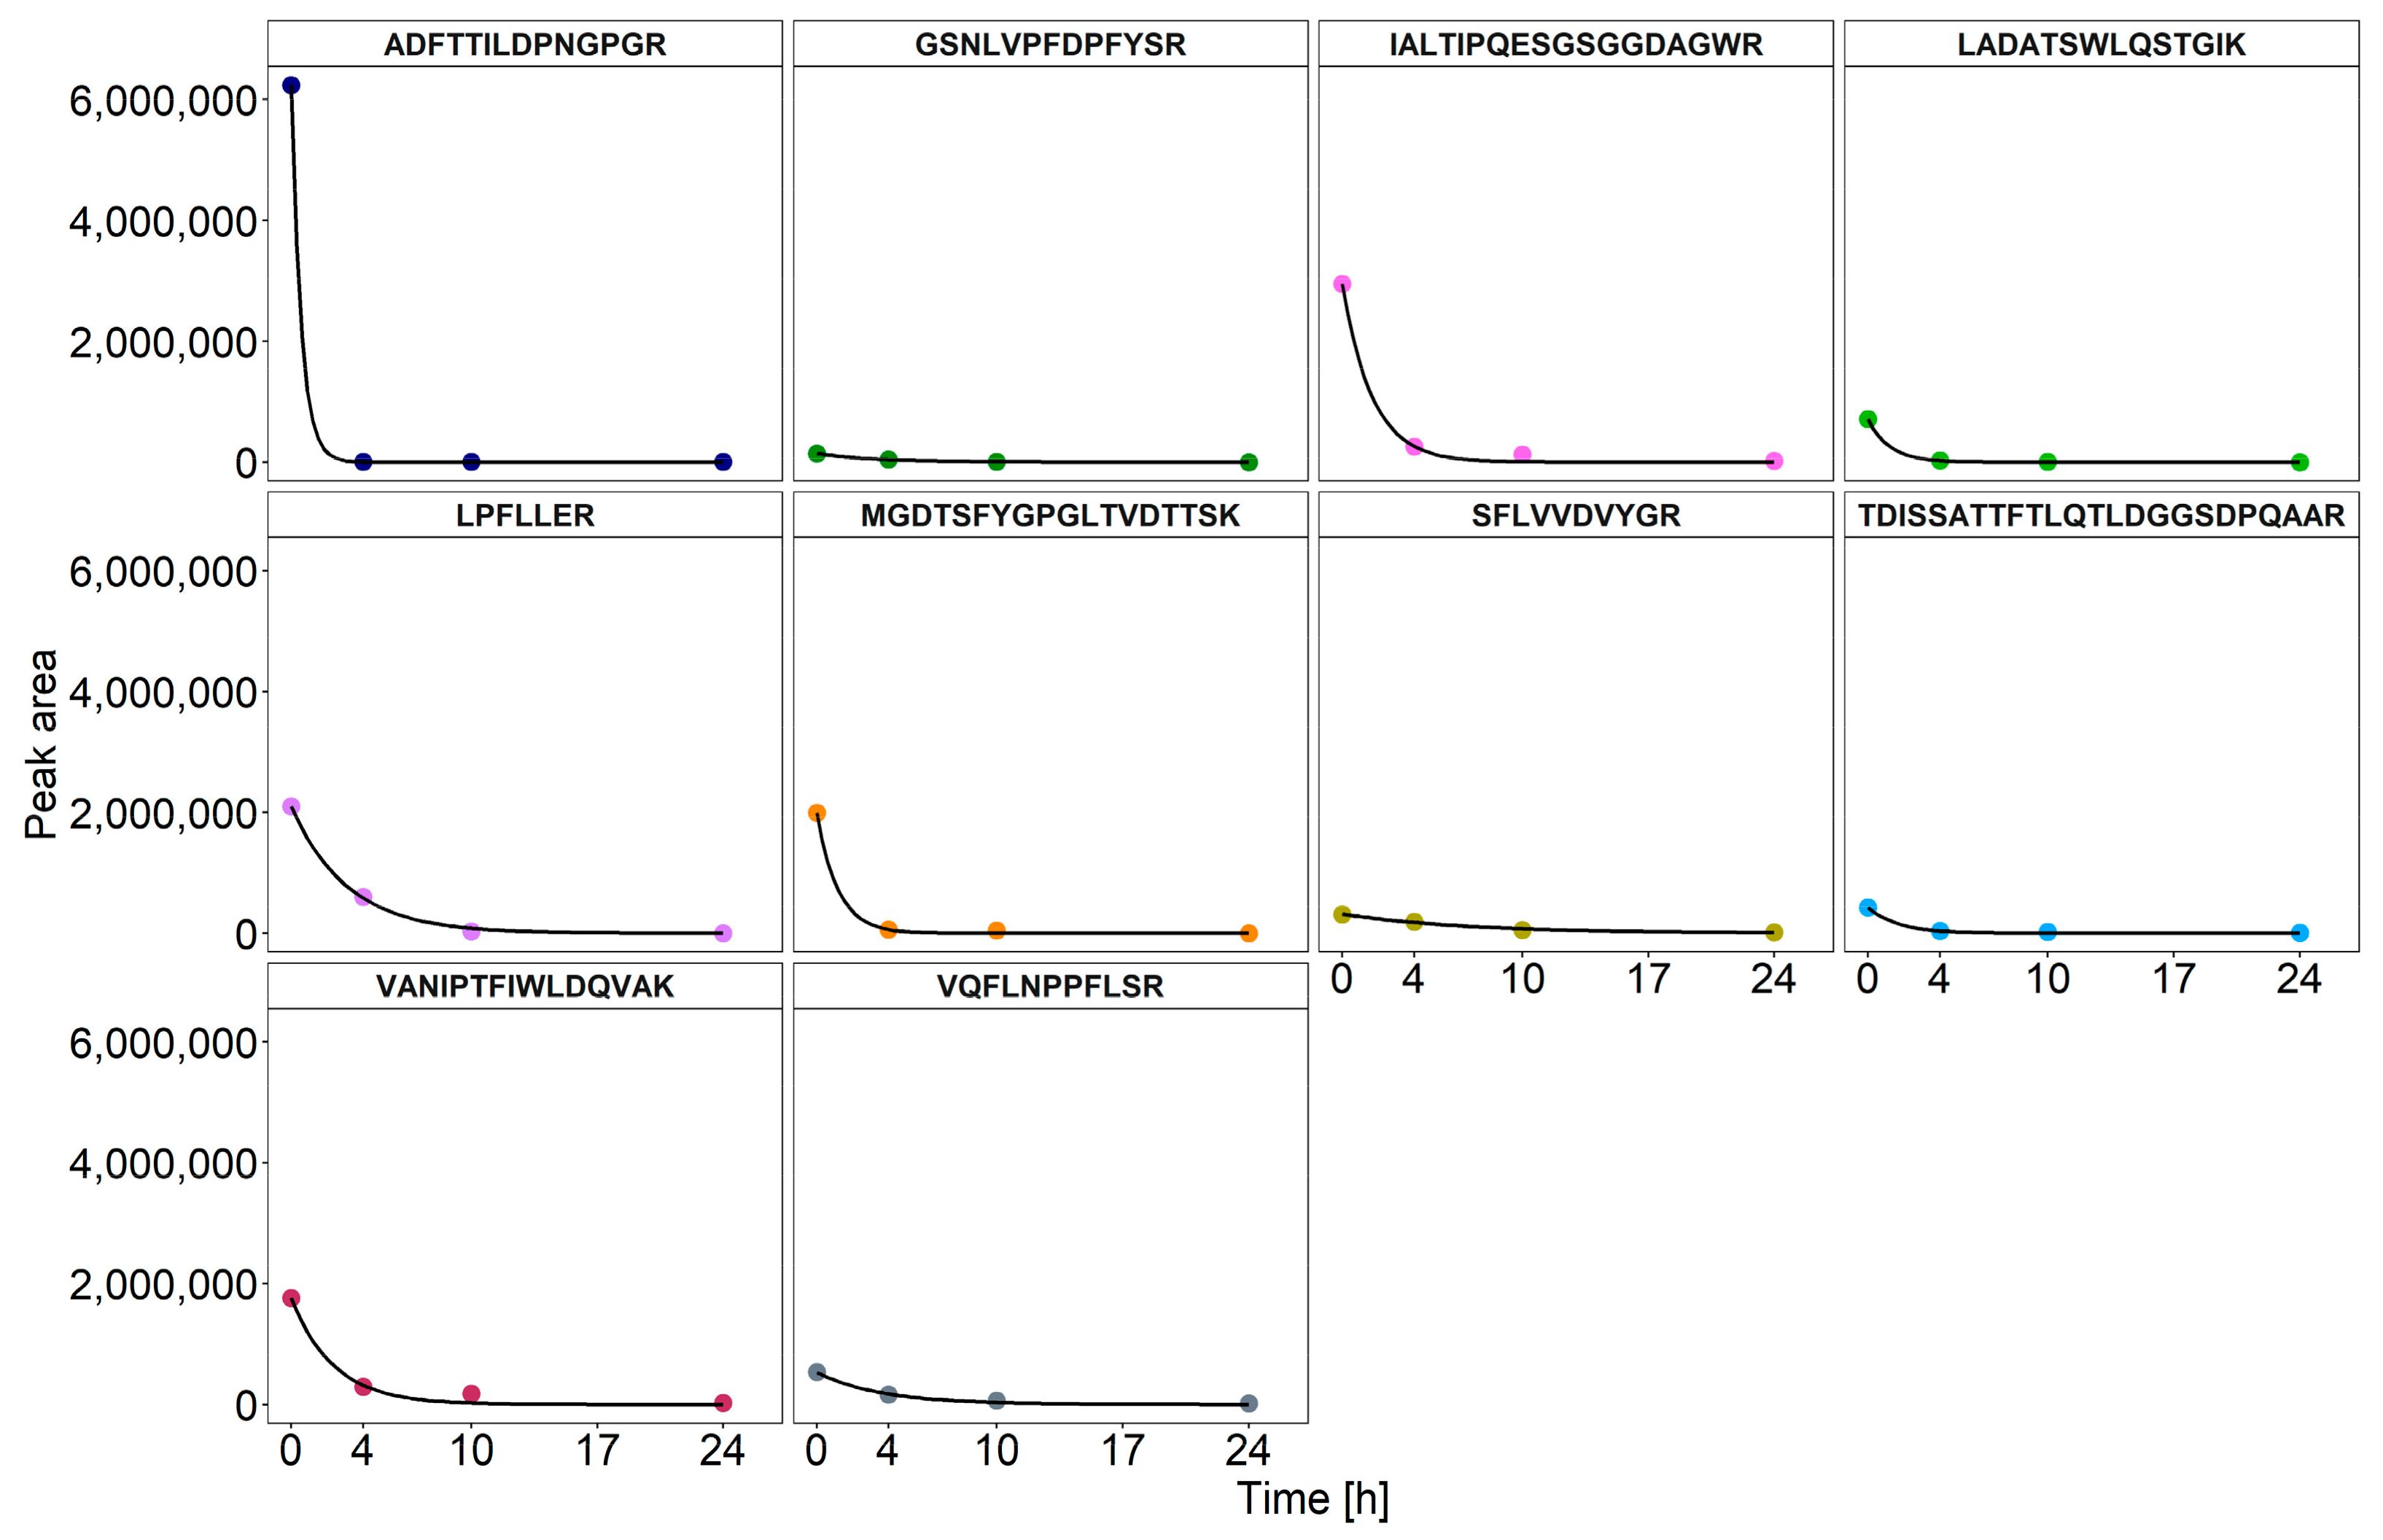
3.3. Dynamics of Enzyme Degradation

After selecting the characteristic peptides, enzyme degradation was further investigated by quantifying these peptides over an incubation period of 24 h. The peak areas were measured for all the selected peptides in order to evaluate the structural stability of the enzyme preparation (presented for the peptide IAL in Figure 2). Immediately after the addition of the enzyme preparation (0 h), all four concentrations of peptide IAL were detectable above the LoD. After 4 h of incubation, the concentration of peptide IAL in factor 1 and factor 10 decreased below the LoD. At 24 h, the peptide IAL was only detectable with an initial concentration of the enzyme preparation that was 1000-fold higher than that applied in the bioreactor (Figure 2).
In order to estimate the degradation kinetics of the fungal enzymes, the peak areas of all the selected peptides were quantified in factor 1000 samples and fitted to first-order kinetics in order to calculate the half-lives (Figure 3). A high correlation coefficient for all the peptides confirmed the assumption of first-order degradation kinetics. The corresponding half-lives of the selected peptides ranged from 0.87 h to 25.66 h, with an average of 1.5 h (Table 3). These results are consistent with previous studies that investigated the structural stability of fungal enzyme preparations in a biogas reactor medium using SDS-PAGE. In particular, most of the fungal enzymes with cellulolytic activity were degraded within a few hours after their addition [9,17]. In contrast to SDS-PAGE, the mass spectrometric quantification of the fungal enzymes was superior since it provided the half-life constants for distinct enzymes with good reproducibility, as evidenced by comparable values of the two replicates (Table 3). Minor differences could be attributed to the inhomogeneity of the samples from AD even if they originate from the same reactor [23].
Compared to the other peptides investigated, the VAN and LAD peptides had significantly prolonged half-live constants exceeding 20 h. LAD belongs to the glycoside hydrolase family 5, some members of which have high thermal stability due to their molecular structure [24]. Accordingly, the use of enzymes from this family could have some positive long-term effects on cellulose degradation in biogas reactors.
The selection of peptides from multiple enzymes enabled a comprehensive overview about the structural stability of many possible fungal enzymes in a complex sample. However, calculated half-life values may vary when measuring multiple peptides of a single protein [25]. Therefore, the selection of precursors should be adapted to the research question, focussing either on a small number of proteins for the calculation of precise half-life constants or on a more comprehensive set of proteins for the raw estimation of half-life values. This limitation of MRM can be circumvented by using a more recent instrument configuration and measurement mode. In particular, using the dia-PASEF mode available for the timsTOF Pro II mass spectrometer enables the combination of high sensitivity and selectivity for a large number of selected precursors.
The enzyme extract of the white-rot fungus L. edodes [8] has been taken as an example for evaluating the potential for degradation of lignocellulosic biomass in AD. The observed low structural stability of lignocellulose-degrading enzymes corresponded with previous results obtained for other enzyme preparations [9,17]. Moreover, it correlated with the rather poor overall effect of the addition of fungal enzymes on the sampled bioreactors, which showed comparable biogas yields. Fast degradation appears to be a more appropriate reason for the minor effects of enzyme additions than suboptimal reaction conditions [26]. Accordingly, endogenous proteases have been identified in anaerobic digesters [27] and their activity has been confirmed [17].
Nevertheless, this new workflow can easily be adapted to monitor other enzyme preparations by exchanging the selected peptides in the bioinformatic workflow. Thus, it provides a general platform for evaluating the effect of the addition of enzyme preparations on AD in addition to the BMP that is conventionally used. Furthermore, this workflow could also be applied for the quantification of enzymes of the archaeal or bacterial microbial community involved in AD, e.g., methyl coenzyme-M reductase (McrA) as a key enzyme for methanogenesis. If necessary, absolute quantification of the selected enzymes would be possible by adding peptides labelled with stable isotopes as internal standards [28].

4. Conclusions

A mass spectrometric assay was established in order to investigate the structural stability of various enzymes of L. edodes added to AD over a period of 24 h. Monitoring of the selected peptides using MS-based approaches clearly suggested a rapid degradation of most of the lignocellulose-degrading enzymes, with an approximate half-life of 1.5 h.
The observed low structural stability of the investigated lignocellulose-degrading enzymes in AD coincided with previous results obtained from SDS-PAGE measurements. The workflow that was established can easily be adapted for the monitoring of other enzymes and provides a platform for evaluating their effect on AD in addition to BMP. Furthermore, the platform enables the targeted absolute quantification of other key enzymes of AD, aiming for individually customized enzyme preparations.

Supplementary Materials

The following supporting information can be downloaded at: https://www.mdpi.com/2311-5637/9/1/67/s1, Figure S1: Correlation of MRM measurements over different dilutions of the enzyme preparation logarithmically plotted. Given fungal enzyme preparation was added in different dilutions to biogas reactor content and incubated for 24 hours. Peak areas for all measured factors of seven peptides (A–G) are shown with their limits of detection (LoD) and limit of quantification (LoQ). Correlation coefficients are shown in each graph, respectively; Figure S2: Correlation of SWATH-MS measurements over different dilutions of the enzyme preparation logarithmically plotted. Given fungal enzyme preparation was added in different dilutions to biogas reactor content and incubated for 24 hours. Peak areas for all measured factors of seven peptides (A–G) are shown with their limits of detection (LoD) and limit of quantification (LoQ). Correlation coefficients are shown in each graph, respectively.

Author Contributions

Conceptualization, D.B.; methodology, D.B.; formal analysis, E.R., L.N., and J.K.; investigation, K.W., J.K., and D.B.; resources, U.R. and K.W.; data curation, J.K.; writing—original draft preparation, J.K. and K.W.; writing—review and editing, D.B., P.R., M.C., U.R., and U.S. (Ulrich Szewzyk); visualization, J.K. and K.W.; supervision, D.B., U.R., and U.S. (Ulrich Szewezyk); project administration, D.B.; funding acquisition, U.S. (Ulrike Schimpf) and D.B. All authors have read and agreed to the published version of the manuscript.

Funding

The operation of the sampled biogas reactor was realized within the subproject ‘Application and effect of the biocatalysts’ of the joint research project ‘Biocatalysts in bioreactors: monitoring, control and multi-criteria optimization of biogas processes (BIOKAT)’ funded by the BMEL (project carrier: FNR, grant nos. 22402516 and 22403816). Open Access funding provided by the Max Planck Society.

Institutional Review Board Statement

Not applicable.

Informed Consent Statement

Not applicable.

Data Availability Statement

Acknowledgments

The authors thank Anne Ballmann for providing excellent technical assistance regarding protein sample preparation and Marten Suhr for the graphical abstract.

Conflicts of Interest

The authors declare no conflict of interest.

References

  1. Taherzadeh, M.J.; Karimi, K. Pretreatment of lignocellulosic wastes to improve ethanol and bi-ogas production: A review. Int. J. Mol. Sci. 2008, 9, 1621–1651. [Google Scholar] [CrossRef] [PubMed]
  2. Parawira, W. Enzyme research and applications in biotechnological intensification of biogas production. Crit. Rev. Biotechnol. 2012, 32, 172–186. [Google Scholar] [CrossRef] [PubMed]
  3. Speda, J.; Johansson, M.A.; Odnell, A.; Karlsson, M. Enhanced biomethane production rate and yield from lignocellulosic ensiled forage ley by in situ anaerobic digestion treatment with endogenous cellulolytic enzymes. Biotechnol. Biofuels 2017, 10, 129. [Google Scholar] [CrossRef] [PubMed]
  4. Fernandes, T.; Bos, G.K.; Zeeman, G.; Sanders, J.; van Lier, J. Effects of thermo-chemical pre-treatment on anaerobic biodegradability and hydrolysis of lignocellulosic biomass. Bioresour. Technol. 2009, 100, 2575–2579. [Google Scholar] [CrossRef] [PubMed]
  5. Ferdeș, M.; Dincă, M.N.; Moiceanu, G.; Zăbavă, B.Ș.; Paraschiv, G. Microorganisms and Enzymes Used in the Biological Pretreatment of the Substrate to Enhance Biogas Production: A Review. Sustainability 2020, 12, 7205. [Google Scholar] [CrossRef]
  6. Ometto, F.; Quiroga, G.; Pšenička, P.; Whitton, R.; Jefferson, B.; Villa, R. Impacts of microalgae pre-treatments for improved anaerobic digestion: Thermal treatment, thermal hydrolysis, ultrasound and en-zymatic hydrolysis. Water Res. 2014, 65, 350–361. [Google Scholar] [CrossRef]
  7. Szűcs, C.; Kovács, E.; Bagi, Z.; Rákhely, G.; Kovács, K.L. Enhancing biogas production from agroindustrial waste pre-treated with filamentous fungi. Biol. Futur. 2021, 72, 341–346. [Google Scholar] [CrossRef]
  8. Schimpf, U.; Schulz, R. Industrial by-products from white-rot fungi production. Part I: Generation of enzyme preparations and chemical, protein biochemical and molecular biological characterization. Process Biochem. 2016, 51, 2034–2046. [Google Scholar] [CrossRef]
  9. Binner, R.; Menath, V.; Huber, H.; Thomm, M.; Bischof, F.; Schmack, D.; Reuter, M. Comparative study of stability and half-life of enzymes and enzyme aggregates implemented in anaerobic biogas processes. Biomass Conv. Bioref. 2011, 1, 1–8. [Google Scholar] [CrossRef]
  10. Willenbücher, K.; Wibberg, D.; Huang, L.; Conrady, M. Phage Genome Diversity in a Biogas-Producing Microbiome Analyzed by Illumina and Nanopore GridION Sequencing. Microorganisms 2022, 10, 368. [Google Scholar] [CrossRef]
  11. Heyer, R.; Schallert, K.; Büdel, A.; Zoun, R.; Dorl, S.; Behne, A.; Kohrs, F.; Püttker, S.; Siewert, C.; Muth, T.; et al. A Robust and Universal Metaproteomics Workflow for Research Studies and Routine Diagnostics Within 24 h Using Phenol Extraction, FASP Digest, and the MetaProteomeAnalyzer. Front. Microbiol. 2019, 10, 1883. [Google Scholar] [CrossRef]
  12. Wiśniewski, J.R.; Zougman, A.; Nagaraj, N.; Mann, M. Universal sample preparation method for proteome analysis. Nat. Methods 2009, 6, 359–362. [Google Scholar] [CrossRef]
  13. Gillet, L.C.; Navarro, P.; Tate, S.; Röst, H.; Selevsek, N.; Reiter, L.; Bonner, R.; Aebersold, R. Targeted data extraction of the MS/MS spectra generated by data-independent acquisition: A new concept for consistent and ac-curate proteome analysis. Mol. Cell. Proteom. MCP 2012, 11, O111.016717. [Google Scholar] [CrossRef]
  14. MacLean, B.; Tomazela, D.M.; Shulman, N.; Chambers, M.; Finney, G.L.; Frewen, B.; Kern, R.; Tabb, D.L.; Liebler, D.C.; MacCoss, M.J. Skyline: An open source document editor for creating and analyzing targeted proteomics experiments. Bioinformatics 2010, 26, 966–968. [Google Scholar] [CrossRef]
  15. Currie, L.A. Limits for qualitative detection and quantitative determination. In Application to Radiochemistry; Analytical Chemistry Division, National Bureau of Standards: Washington, DC, USA, 1968. [Google Scholar]
  16. Mani, D.R.; Abbatiello, S.E.; Carr, S.A. Statistical characterization of multiple-reaction monitoring mass spectrometry (MRM-MS) assays for quantitative proteomics. BMC Bioinform. 2012, 13 (Suppl. 16), S9. [Google Scholar] [CrossRef]
  17. Odnell, A.; Recktenwald, M.; Stensén, K.; Jonsson, B.-H.; Karlsson, M. Activity, life time and effect of hydrolytic enzymes for enhanced biogas production from sludge anaerobic digestion. Water Res. 2016, 103, 462–471. [Google Scholar] [CrossRef]
  18. Davidsson, Å.; Wawrzynczyk, J.; Norrlöw, O.; Jansen, J.L.C. Strategies for Enzyme Dosing to Enhance Anaerobic Digestion of Sewage Sludge. J. Residuals Sci. Technol. 2007, 4, 1–7. [Google Scholar]
  19. Garcia, N.H.; Mattioli, A.; Gil, A.; Frison, N.; Battista, F.; Bolzonella, D. David Evaluation of the methane potential of different agricultural and food processing substrates for improved biogas produc-tion in rural areas. Renew. Sustain. Energy Rev. 2019, 112, 1–10. [Google Scholar] [CrossRef]
  20. Heyer, R.; Schallert, K.; Siewert, C.; Kohrs, F.; Greve, J.; Maus, I.; Klang, J.; Klocke, M.; Heiermann, M.; Hoffmann, M.; et al. Metaproteome analysis reveals that syntrophy, competition, and phage-host interaction shape microbial communities in biogas plants. Microbiome 2019, 7, 69. [Google Scholar] [CrossRef]
  21. Colgrave, M.L.; Byrne, K.; Blundell, M.; Heidelberger, S.; Lane, C.S.; Tanner, G.J.; Howitt, C.A. Comparing Multiple Reaction Monitoring and Sequential Window Acquisition of All Theoret-ical Mass Spectra for the Relative Quantification of Barley Gluten in Selectively Bred Barley Lines. Anal. Chem. 2016, 88, 9127–9135. [Google Scholar] [CrossRef]
  22. Montemurro, N.; Orfanioti, A.; Manasfi, R.; Thomaidis, N.S.; Pérez, S. Comparison of high resolution mrm and sequential window acquisition of all theoretical fragment-ion acquisition modes for the quantitation of 48 wastewater-borne pollutants in lettuce. J. Chromatogr. A 2020, 1631, 461566. [Google Scholar] [CrossRef] [PubMed]
  23. Schievano, A.; Scaglia, B.; D’Imporzano, G.; Malagutti, L.; Gozzi, A.; Adani, F. Prediction of biogas potentials using quick laboratory analyses: Upgrading previous models for application to heterogeneous organic matrices. Bioresour. Technol. 2009, 100, 5777–5782. [Google Scholar] [CrossRef] [PubMed]
  24. Badieyan, S.; Bevan, D.R.; Zhang, C. Study and design of stability in GH5 cellulases. Biotechnol. Bioeng. 2012, 109, 31–44. [Google Scholar] [CrossRef] [PubMed]
  25. Trötschel, C.; Poetsch, A. Current approaches and challenges in targeted absolute quantification of membrane proteins. Proteomics 2015, 15, 915–929. [Google Scholar] [CrossRef]
  26. Liew, Y.X.; Chan, Y.J.; Manickam, S.; Chong, M.F.; Chong, S.; Tiong, T.J.; Lim, J.W.; Pan, G.-T. Enzymatic pretreatment to enhance anaerobic bioconversion of high strength wastewater to biogas: A review. Sci. Total Environ. 2020, 713, 136373. [Google Scholar] [CrossRef]
  27. Aghtaei, H.K.; Püttker, S.; Maus, I.; Heyer, R.; Huang, L.; Sczyrba, A.; Reichl, U.; Benndorf, D. Adaptation of a microbial community to demand-oriented biological methanation. Biotechnol. Biofuels Bioprod. 2022, 15, 125. [Google Scholar] [CrossRef]
  28. Küchler, J.; Püttker, S.; Lahmann, P.; Genzel, Y.; Kupke, S.; Benndorf, D.; Reichl, U. Absolute quantification of viral proteins during single-round replication of MDCK suspension cells. J. Proteom. 2022, 259, 104544. [Google Scholar] [CrossRef]
Figure 1. Correlation of MRM and SWATH-MS measurements for different dilution factors of the fungal enzyme preparation added to the biogas reactor content and incubated for 24 h. (AC), correlation between the measured peak area of three selected peptides for the MRM mode; (DF), SWATH-MS mode. The titles of the subplots display the peptide sequences. The correlation coefficients are shown in each graph.
Fermentation 09 00067 g001
Figure 2. Degradation kinetics of the peptide IAL. The enzyme preparation was added in different dilutions to the biogas content and incubated over 24 h. IAL represents the ten selected peptides.
Fermentation 09 00067 g002
Figure 3. Degradation kinetics of the peptide IAL for factor 1000. The fungal enzyme preparation was added in different dilutions to the biogas reactor medium and incubated for 24 h. Measurements were carried out in the MRM mode. The exponential fit was performed with R.
Fermentation 09 00067 g003
Table 1. Detected proteins of the fungal enzyme preparation. MASCOT search results are shown as representatives for the factor 1000 sample at 0 h after the addition of the enzyme preparation against the UniProt_Lentinula_Edodes database.
AccDescriptionScoreMassMatchesSequences
A0A1Q3EJ89A0A1Q3EJ89_LENED Glucanase OS = Lentinula edodes OX = 5353 GN = LENED_009211 PE = 3 SV = 1102855,356334
A0A1Q3EU06A0A1Q3EU06_LENED Glucanase OS = Lentinula edodes OX = 5353 GN = LENED_012880 PE = 3 SV = 163662,086216
A0A1Q3E856A0A1Q3E856_LENED Subtilisin-like protein OS = Lentinula edodes OX = 5353 GN = LENED_004953 PE = 4 SV = 162063,032266
A0A1Q3ENW5A0A1Q3ENW5_LENED Beta-xylanase OS = Lentinula edodes OX = 5353 GN = LENED_010993 PE = 3 SV = 1389120,358134
A0A1Q3EGI8A0A1Q3EGI8_LENED Glycoside hydrolase family 55 protein OS = Lentinula edodes OX = 5353 GN = LENED_008227 PE = 4 SV = 138567,56594
Q9C1R4Q9C1R4_LENED Glucanase OS = Lentinula edodes OX = 5353 GN = cbhII-1 PE = 2 SV = 132446,832133
A0A1Q3EBY2A0A1Q3EBY2_LENED Glycoside hydrolase family 5 protein OS = Lentinula edodes OX = 5353 GN = LENED_006487 PE = 3 SV = 131843,55982
A0A0A1I5X1A0A0A1I5X1_LENED Glycoside hydrolase family 5 endoglucanase (Fragment) OS = Lentinula edodes OX = 5353 GN = glu PE = 3 SV = 1231850951
A0A1Q3DWF6A0A1Q3DWF6_LENED Cu-oxidase-domain-containing protein OS = Lentinula edodes OX = 5353 GN = LENED_000509 PE = 3 SV = 127357,232143
A0A1Q3EAX5A0A1Q3EAX5_LENED Glycoside hydrolase family 12 protein OS = Lentinula edodes OX = 5353 GN = LENED_006131 PE = 3 SV = 123726,42273
Table 2. Selected peptides of the given enzyme preparation in this study. The enzyme preparation (from the fungus L. edodes) was added to the biogas reactor content at different concentrations and incubated at 37 °C for 24 h. The resulting mass spectra were matched with the proteome of L. edodes.
ProteinIDPeptide SequenceAbbreviationm/zCollision Energy [eV]LoD MRMLoQ MRMLoD SWATH-MSLoQ SWATH-MS
Glycoside Hydrolase Family 16 ProteinA0A1Q3DXQ1ADFTTILDPNGPGRADF737.3703429265.2420,818.5513,190.2632,121.56
Carbohydrate Esterase Family 15 ProteinA0A1Q3EF14IALTIPQESGSGGDAGWRIAL907.9552484319.9910,469.1010,078.4726,025.36
Glycoside Hydrolase Family 5
endoglucanase (EC 3.2.1.4) (fragment)
A0A0A1I5X1LADATSWLQSTGIKLAD745.89614211,100.8529,059.4925,864.80183,437.42
Glucanase (EC 3.2.1.-)Q96VU3MGDTSFYGPGLTVDTTSKMGD938.9353485227.5511,224.8312,511.1232,676.04
Q9C1R6VANIPTFIWLDQVAKVAN857.9800457526.5219,345.5319,870.9849,686.59
Glycoside Hydrolase Family 5 ProteinA0A1Q3EBY2LPFLLERLPF444.27112737,104.1192,768.7739,710.62105,827.83
Carbohydrate Esterase Family 16 ProteinA0A1Q3DZ58SFLVVDVYGRSFL577.81393124,580.9160,929.9583,059.27221,305.20
Family S53 Protease (Kinesin-like Protein)A0A1Q3DXE6TDISSATTFTLQTLDGGSDPQAATDI1227.093483451.588628.0325,740.5965,377.70
Cupper Radical OxidaseA0A1Q3E003VQFLNPPFLSRVQL659.36933917,981.8237,553.6530,637.3480,912.03
Beta-Mannosidase (EC 3.2.1.25)A0A1Q3E4F1GSNLVPFDPFYSRGSN749.8699429253.6322,135.4548,250.42127,927.94
Table 3. Half-life constants of selected peptides representing the enzyme preparation used in this study. The three peptides (LAD, VAN, and GSN) were excluded from calculations of the average half-life constants as their values significantly exceeded the range of the other peptides.
ProteinPeptideHalf-Life [h]
Replicate AReplicate BAverage
Carbohydrate Esterase Family 15 ProteinIAL1.171.071.12
Glycoside Hydrolase Family 16 ProteinADF0.440.440.44
Glycoside Hydrolase Family 5
endoglucanase (EC 3.2.1.4) (fragment)
LAD22.8422.5122.68
Glucanase (EC 3.2.1.)MGD0.821.501.16
VAN20.6225.6623.14
Glycoside Hydrolase Family 5 ProteinLPF1.693.102.40
Carbohydrate Esterase Family 16 ProteinSFL1.011.571.29
Family S53 Protease (Kinesin-like Protein)TDI1.281.541.41
Copper Radical OxidaseVQL1.381.791.59
Beta-Mannosidase (EC 3.2.1.25)GSN5.277.276.27
Average1.171.781.48
Disclaimer/Publisher’s Note: The statements, opinions and data contained in all publications are solely those of the individual author(s) and contributor(s) and not of MDPI and/or the editor(s). MDPI and/or the editor(s) disclaim responsibility for any injury to people or property resulting from any ideas, methods, instructions or products referred to in the content.

