Review

Understanding Forest Health with Remote Sensing, Part III: Requirements for a Scalable Multi-Source Forest Health Monitoring Network Based on Data Science Approaches

by
Angela Lausch
1,2,*,
Erik Borg
3,
Jan Bumberger
4,
Peter Dietrich
4,5,
Marco Heurich
6,7,
Andreas Huth
8,
András Jung
9,10,
Reinhard Klenke
11,
Sonja Knapp
12,
Hannes Mollenhauer
4,
Hendrik Paasche
4,
Heiko Paulheim
13,
Marion Pause
14,
Christian Schweitzer
15,
Christiane Schmulius
16,
Josef Settele
11,17,
Andrew K. Skidmore
18,19,
Martin Wegmann
20,
Steffen Zacharias
4,
Toralf Kirsten
21 and
Michael E. Schaepman
22
add Show full author list remove Hide full author list
1
Department Computational Landscape Ecology, Helmholtz Centre for Environmental Research—UFZ, Permoserstr. 15, D-04318 Leipzig, Germany
2
Lab for Landscape Ecology, Department of Geography, Humboldt University of Berlin, Rudower Chaussee 16, 12489 Berlin, Germany
3
German Aerospace Center—DLR, German Remote Sensing Data Center—DFD, Kalkhorstweg 53, D-17235 Neustrelitz, Germany
4
Department of Monitoring and Exploration Technologies, Helmholtz Centre for Environmental Research—UFZ, Permoserstr. 15, D-04318 Leipzig, Germany
5
Dpartment of Geoscience, Centre of Applied Geosciences, Eberhard Karls University, Hölderlinstr. 12, D-72074 Tübingen, Germany
6
Department of Conservation and Research, Bavarian Forest National Park, Freyunger Straße 2, D-94481 Grafenau, Germany
7
Faculty of Environment and Natural Resources, University of Freiburg, Tennenbacher Straße 4, D-79106 Freiburg, Germany
8
Department of Ecological Modelling, Helmholtz Centre for Environmental Research—UFZ, Permoserstr. 15, D-04318 Leipzig, Germany
9
Technical Department, Szent István University, Villányi út 29–43, 1118 Budapest, Hungary
10
MTA-SZIE Plant Ecological Research Group, Szent István University, Páter Károly u.1., 2100 Gödöllő, Hungary
11
Department of Conservation Biology, Helmholtz Centre for Environmental Research—UFZ, Permoserstr. 15, D-04318 Leipzig, Germany
12
Department of Community Ecology, Helmholtz Centre for Environmental Research—UFZ, Theodor-Lieser-Str. 4, D-06120 Halle, Germany
13
Data and Web Science Group, University of Mannheim, B6 26, D-68159 Mannheim, Germany
14
Institut of Photogrammetry and Remote Sensing, Technical University Dresden, Helmholtzstr. 10, D-01061 Dresden, Germany
15
German Environment Agency, Wörlitzer Platz 1, D-06844 Dessau-Rosslau, Germany
16
Department of Remote Sensing, University of Jena, Grietgasse 228B, Grietgasse 6, D-07743 Jena, Germany
17
iDiv, German Centre for Integrative Biodiversity Research, Halle-Jena-Leipzig, Deutscher Platz 5e, D-04103 Leipzig, Germany
18
Faculty of Geo-Information Science and Earth Observation (ITC), University of Twente, P.O. Box 217, AE 7500 Enschede, The Netherlands
19
Department of Environmental Science, Macquarie University, NSW 2109, Sydney 2109, Australia
20
Department of Remote Sensing, Institute of Geography and Geology, University of Würzburg, Oswald-Külpe Weg 86, 97074 Würzburg, Germany
21
Faculty of Applied Computer and Bio Sciences, University of Applied Sciences Mittweida, Technikumplatz 17, 09648 Mittweida, Germany
22
Remote Sensing Laboratories, Department of Geography, University of Zurich Irchel, Winterthurerstrasse 190, CH-8057 Zurich, Switzerland
*
Author to whom correspondence should be addressed.
Remote Sens. 2018, 10(7), 1120; https://doi.org/10.3390/rs10071120
Submission received: 13 April 2018 / Revised: 12 June 2018 / Accepted: 6 July 2018 / Published: 15 July 2018
(This article belongs to the Special Issue Remote Sensing of Forest Health)

Abstract

:
Forest ecosystems fulfill a whole host of ecosystem functions that are essential for life on our planet. However, an unprecedented level of anthropogenic influences is reducing the resilience and stability of our forest ecosystems as well as their ecosystem functions. The relationships between drivers, stress, and ecosystem functions in forest ecosystems are complex, multi-faceted, and often non-linear, and yet forest managers, decision makers, and politicians need to be able to make rapid decisions that are data-driven and based on short and long-term monitoring information, complex modeling, and analysis approaches. A huge number of long-standing and standardized forest health inventory approaches already exist, and are increasingly integrating remote-sensing based monitoring approaches. Unfortunately, these approaches in monitoring, data storage, analysis, prognosis, and assessment still do not satisfy the future requirements of information and digital knowledge processing of the 21st century. Therefore, this paper discusses and presents in detail five sets of requirements, including their relevance, necessity, and the possible solutions that would be necessary for establishing a feasible multi-source forest health monitoring network for the 21st century. Namely, these requirements are: (1) understanding the effects of multiple stressors on forest health; (2) using remote sensing (RS) approaches to monitor forest health; (3) coupling different monitoring approaches; (4) using data science as a bridge between complex and multidimensional big forest health (FH) data; and (5) a future multi-source forest health monitoring network. It became apparent that no existing monitoring approach, technique, model, or platform is sufficient on its own to monitor, model, forecast, or assess forest health and its resilience. In order to advance the development of a multi-source forest health monitoring network, we argue that in order to gain a better understanding of forest health in our complex world, it would be conducive to implement the concepts of data science with the components: (i) digitalization; (ii) standardization with metadata management after the FAIR (Findability, Accessibility, Interoperability, and Reusability) principles; (iii) Semantic Web; (iv) proof, trust, and uncertainties; (v) tools for data science analysis; and (vi) easy tools for scientists, data managers, and stakeholders for decision-making support.

Graphical Abstract

1. Introduction

Anthropogenic and natural stressors and disturbances affect all levels of biotic organization in forest ecosystems, potentially affecting their resilience. Relationships among drivers, stressors, disturbances, and effects are complex, often non-linear, and multidimensional on temporal and spatial scales. Adaptation processes on forest species that are both species-specific and regional specifics make causal stress responses and their effects on resilience in ecosystems even more difficult to understand [1]. In order to gain a better understanding of the effects of different stressors and disturbances and support forest managers, decision makers, and politicians in their decisions on forest management, a holistic approach is imperative. This includes data recording, monitoring, analysis, and the assessment of forest health on all levels of forest health monitoring [2] and also a monitoring of biodiversity and forest ecosystem change through effective global coordination [3] good observations, indicators and scenarios of biodiversity and ecosystem services change [4].
There is still a large discrepancy between the information required by forest managers and scientists and the information that is available for understanding and assessing the complexity and multidimensionality of forest health drivers, stressors, disturbances, and effects. Decision makers require information on forest health in high spatial and temporal accuracy, from the local to the global, for short and long-term periods that can be recorded on a low-cost basis. Such information should be comparable among regions and based on harmonized methods. For this reason, forest inventory programs have largely been harmonized [5,6,7]. On the one hand, indicators of forest health used in forest inventory programs are accurate, but on the other hand, their acquisition is time and cost-intensive, so that in most cases plot-based monitoring has to be carried out at long intervals (>1 year).
Today, an increasing amount of forest health data is available from national forest inventories and monitoring programs [8,9], experimental studies of forest ecosystems [10], as well as from remote sensing (RS) data and RS data products [11,12,13,14]. In addition, RS technologies can be used to derive a large range of forest health indicators [6,15,16,17]. Studies increasingly refer to the importance of combining national forest inventory field plots and RS data for assessing forest health [18,19], but only a limited number of countries [20] and operational programs support plot-based national forest inventories monitoring by using close-range and air and spaceborne RS data.
A study on the significance of RS in national forest inventories [20] showed that approximately 71% (32 out of 45 countries) consider their national forest inventory (NFI) to depend on or partly depend on earth observation data. Approximately 31% of those asked (14 countries) found the use of aerial images for NFI to be indispensable. Only around 13% of those surveyed considered RS data to be essential for NFI, whereas 9% of those surveyed found that a combination of aerial images and satellite images was necessary. Another 56% believed that RS data cannot be used for NFI. No country has outlined the use of radar or light detecting and ranging (LiDAR) RS data from air and spaceborne RS sensors or unmanned aerial vehicles (UAV) [20]. In a further study focusing on European countries that was conducted in 2015, 24 out of 34 countries claimed to have made “no changes” in continuing the use of existing information instruments such as RS technologies, whereas eight countries quoted “changes” to their national forest inventories related to the use of new RS technologies [21].
The reasons for a low integration of RS technologies in forest health monitoring are listed in the following. (i) Previously developed RS technologies either do not record certain forest inventory indicators or only record them with insufficient quality. (ii) Complex and large RS data often pose high technical and personal requirements for data management, storage, processing, analysis, and the derivation of forest health indicators. (iii) The processing and analysis of RS data requires highly skilled RS training, extensive expertise, and the access to RS software and RS data with high spatial and spectral resolution. (iv) The methodological approaches, variables, and recording parameters of forest inventory [6] differ from those of close-range, air and spaceborne RS approaches [1]. The plot-based forest inventory is primarily assessed by field visits. For the accuracy of national forest inventories, long-term experience with indicators and easily enforceable standardization targets are required. Difficulties in the recording and assessment of forest inventory indicators not only involve specialist competences, but also physiological, species-specific, bioregional or climate-related knowledge. Reasons underlying the shift in forest health indicators [22,23] might thus easily be misinterpreted by the person processing the forest inventory data.
Plot-based forest inventory indicators are thus a combination of indicators that can primarily be recorded by humans (human-driven), and partly also by the implementation of instruments (machine-driven). (v) Conversely, close-range, air and space-borne RS techniques record machine-driven indicators of forest health such as spectral traits (ST) and spectral trait variations (STV) in a spatially and temporally explicit way [1,24,25]. The accuracy in deriving forest health indicators using RS depends “on the spatial, spectral, radiometric, angular, and temporal resolution of the RS techniques, the distribution of ST/STV in space and their temporal changes, the choice of the modeling method (classification, biophysical/chemical parameter estimation), the geographic data representation (pixel-based or geographic object-based), and the appropriateness of the RS algorithm and its assumptions for the given spectral traits” [25]. The application of data science methods combined with machine-driven forest health indicators (forest inventory, in situ and RS indicators) is objective, quantitative, repetitive, and comparable, and thus the basis for a better understanding of complex processes and drivers of forest health on different scales.
Even though appropriate data and methods are available, no uniform, comparable, multidimensional, and multi-source forest health monitoring network (MUSO-FH-MN) exists, which corresponds to the future requirements of data science in the 21st century. We think that such a network is necessary to enable timely data and process-based decisions in order to guarantee better understanding, modeling, prediction, and assessing of healthy and resilient forest ecosystems.
The goal of this paper is to discuss:
(1)
What is required to bridge the gaps in information, data, models, and tools needed by forest managers and scientists for a better understanding of the complexity and multidimensionality of forest health drivers, stressors, disturbances, effects, and related processes?
(2)
Why are these requirements essential for a better understanding of forest health?
(3)
Which requirements are imperative to establish a multidimensional, multi-source forest health monitoring network in the future?

2. Forest Health

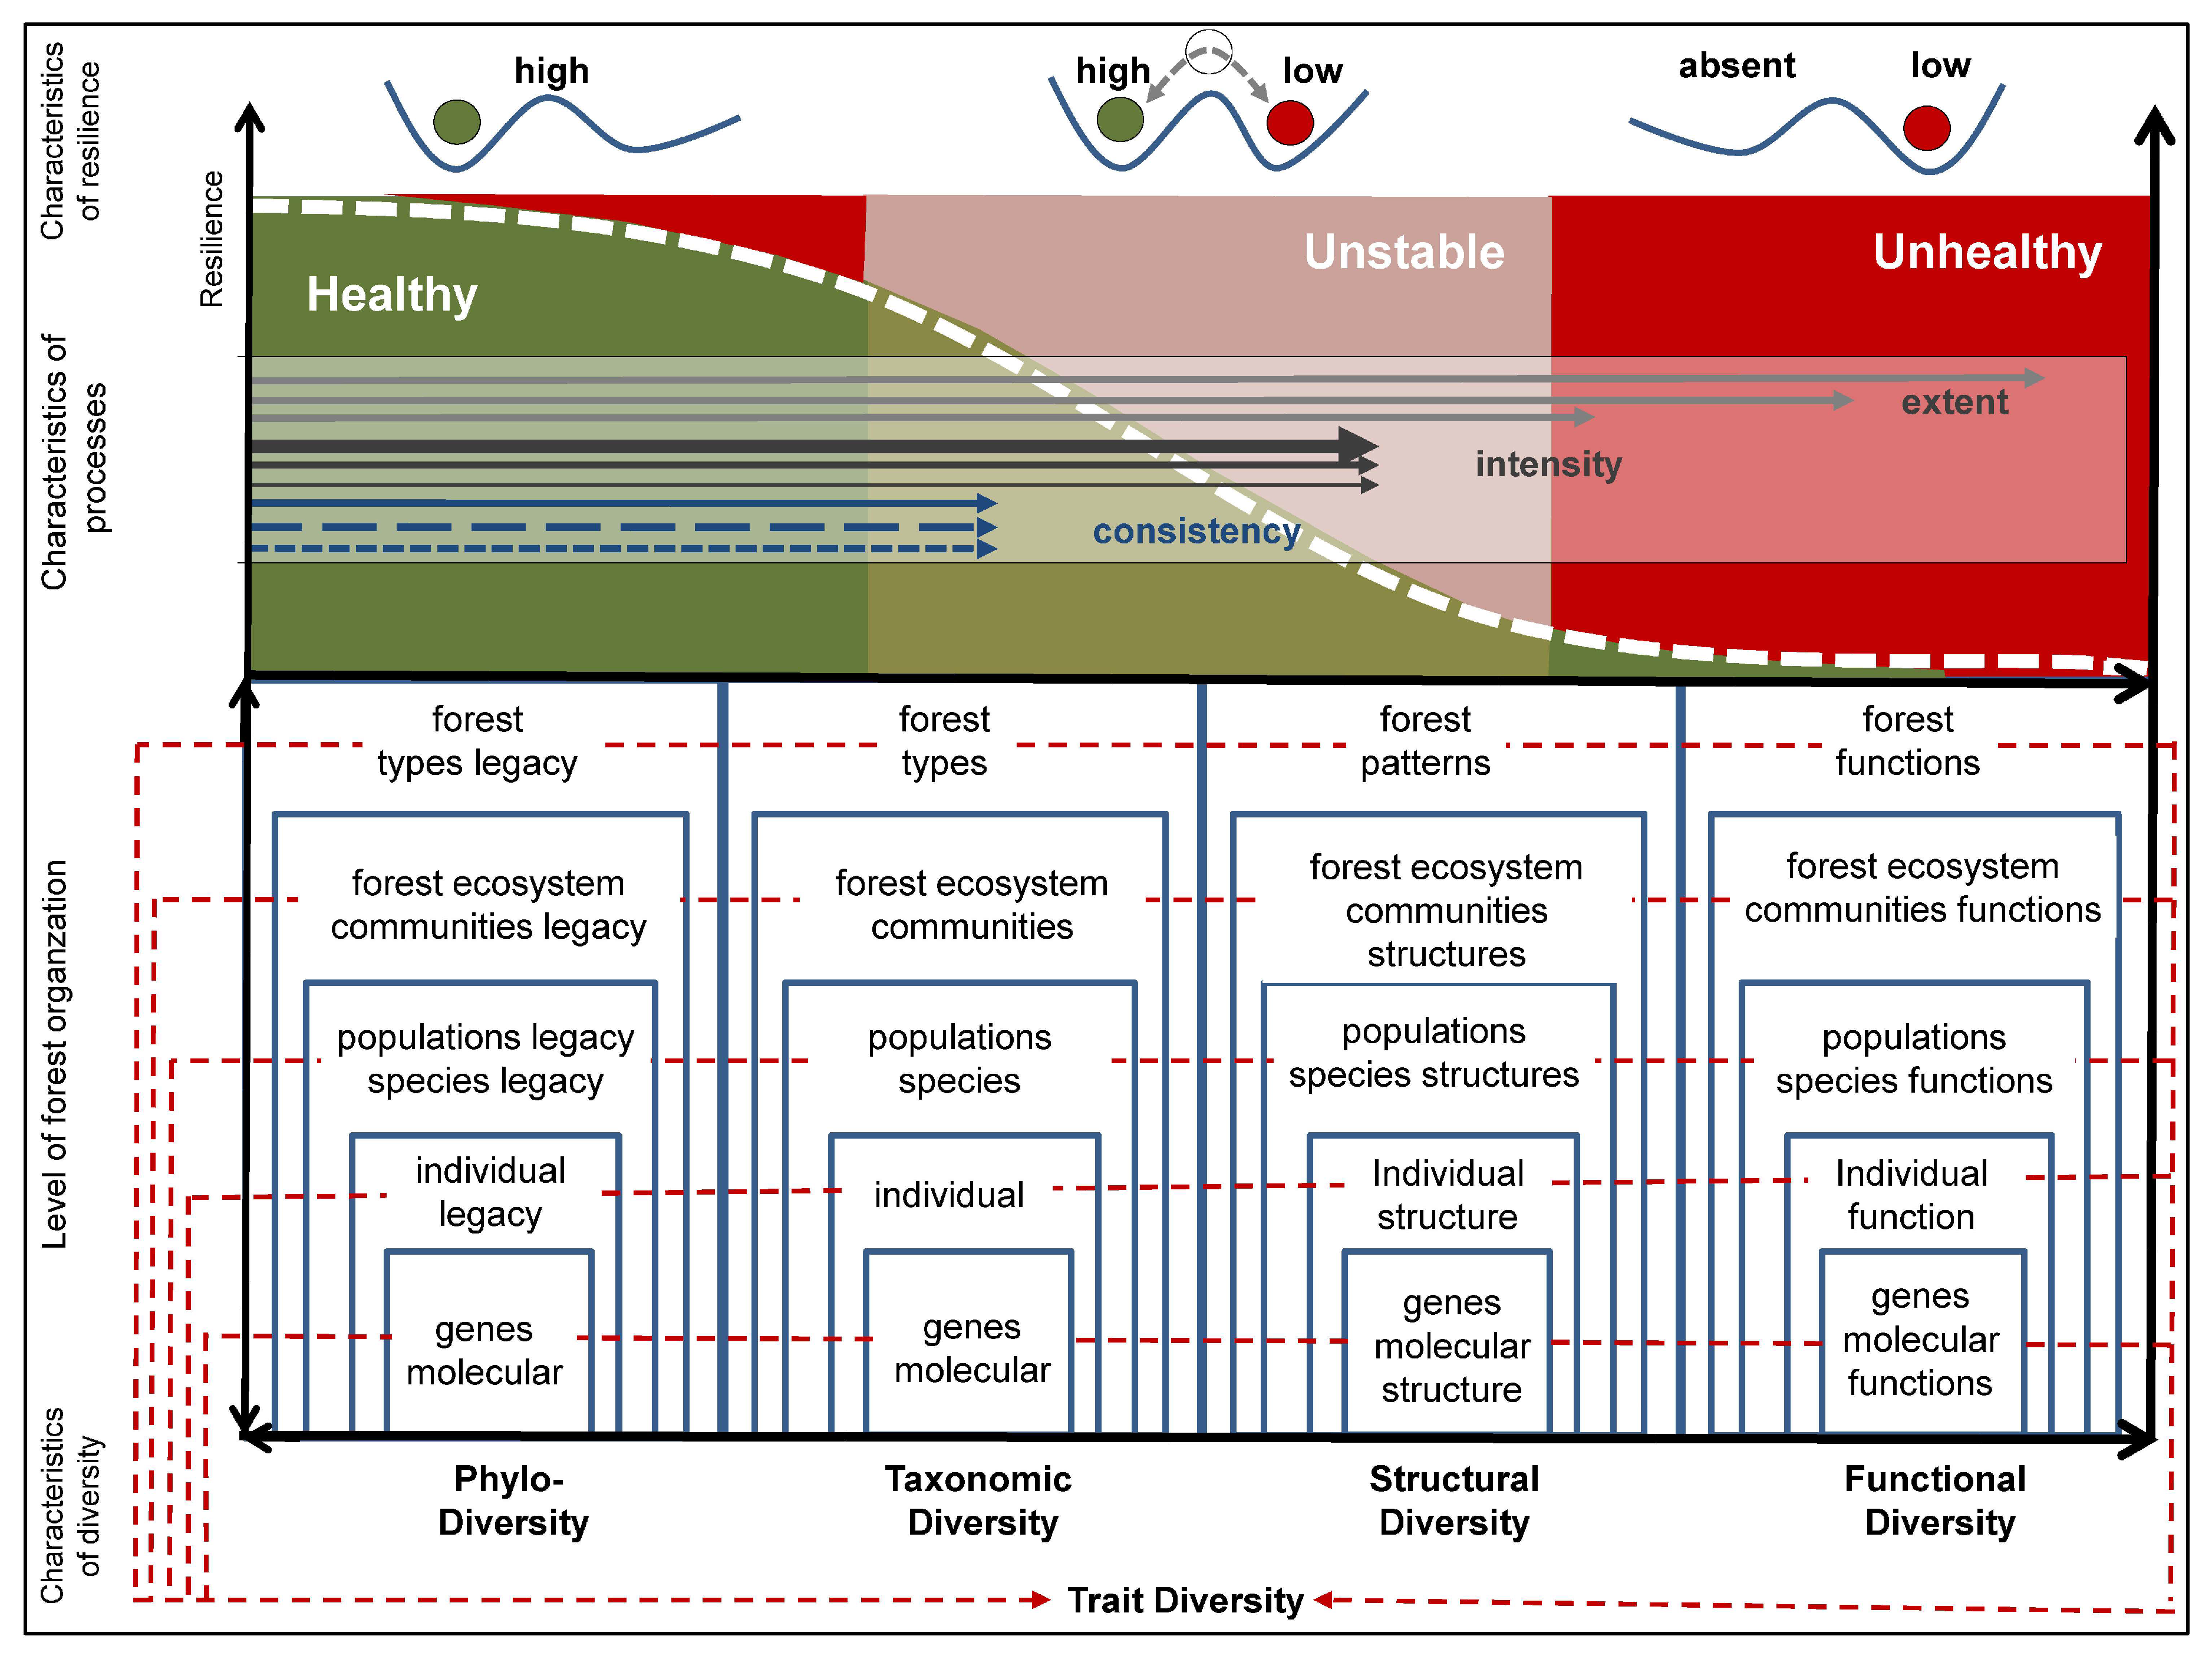
2.1. Understanding Forest Health

Forest ecosystems are exposed to multiple stressors that can destabilize functions, structures, and processes as well as impair the provision of ecosystem services [26]. These multiple stressors mostly interact and co-occur in different ways and on various temporal and organismic scales, which are not yet fully understood.
Therefore, stressors, disturbances, or resource limitation factors can take effect at each development stage or only at specific development stages or time windows of the development, i.e., during the germination, the budding, the flowering, or seed formation of plants, causing functions to become impaired or even destabilized. Moreover, the effects of multiple stressors on different scales of biological organization will vary [27]. The effectiveness of stressors is influenced by process characteristics (chemical, mechanical, and organismic driver), just as much as it depends on the dose and the dose combination of multiple stressors, as well as the characteristics of the effective processes such as range, duration, scope, intensity, continuity, dominance, or overlap of the processes [28].
Furthermore, over longer time frames, multiple stressors can lead to the development of adaptation strategies such the development of CSR plant strategy types (competition—C, stress tolerance—S and ruderal -R) [29,30]. However, stressors will only lead to a change in resilience when there are irreversible changes, making it impossible for the system to return to its initial state (see Figure 1). Accordingly, forest biodiversity is a crucial component of the concepts of ecosystem health and integrity [31,32,33]. These concepts are linked to the self-organizing capacity of ecosystems in the presence of multiple stressors, disturbances, or resource limitations. Healthy forest ecosystems can be defined as vigorous, diverse systems that are characterized by a high resilience on different levels of biotic organization from the gene, molecular, individual, and community level to that of forest ecosystems, with the ability to quickly return to an initial state following external stressors, disturbances, or resource limitations, and withstand negative impacts from external influences [34].

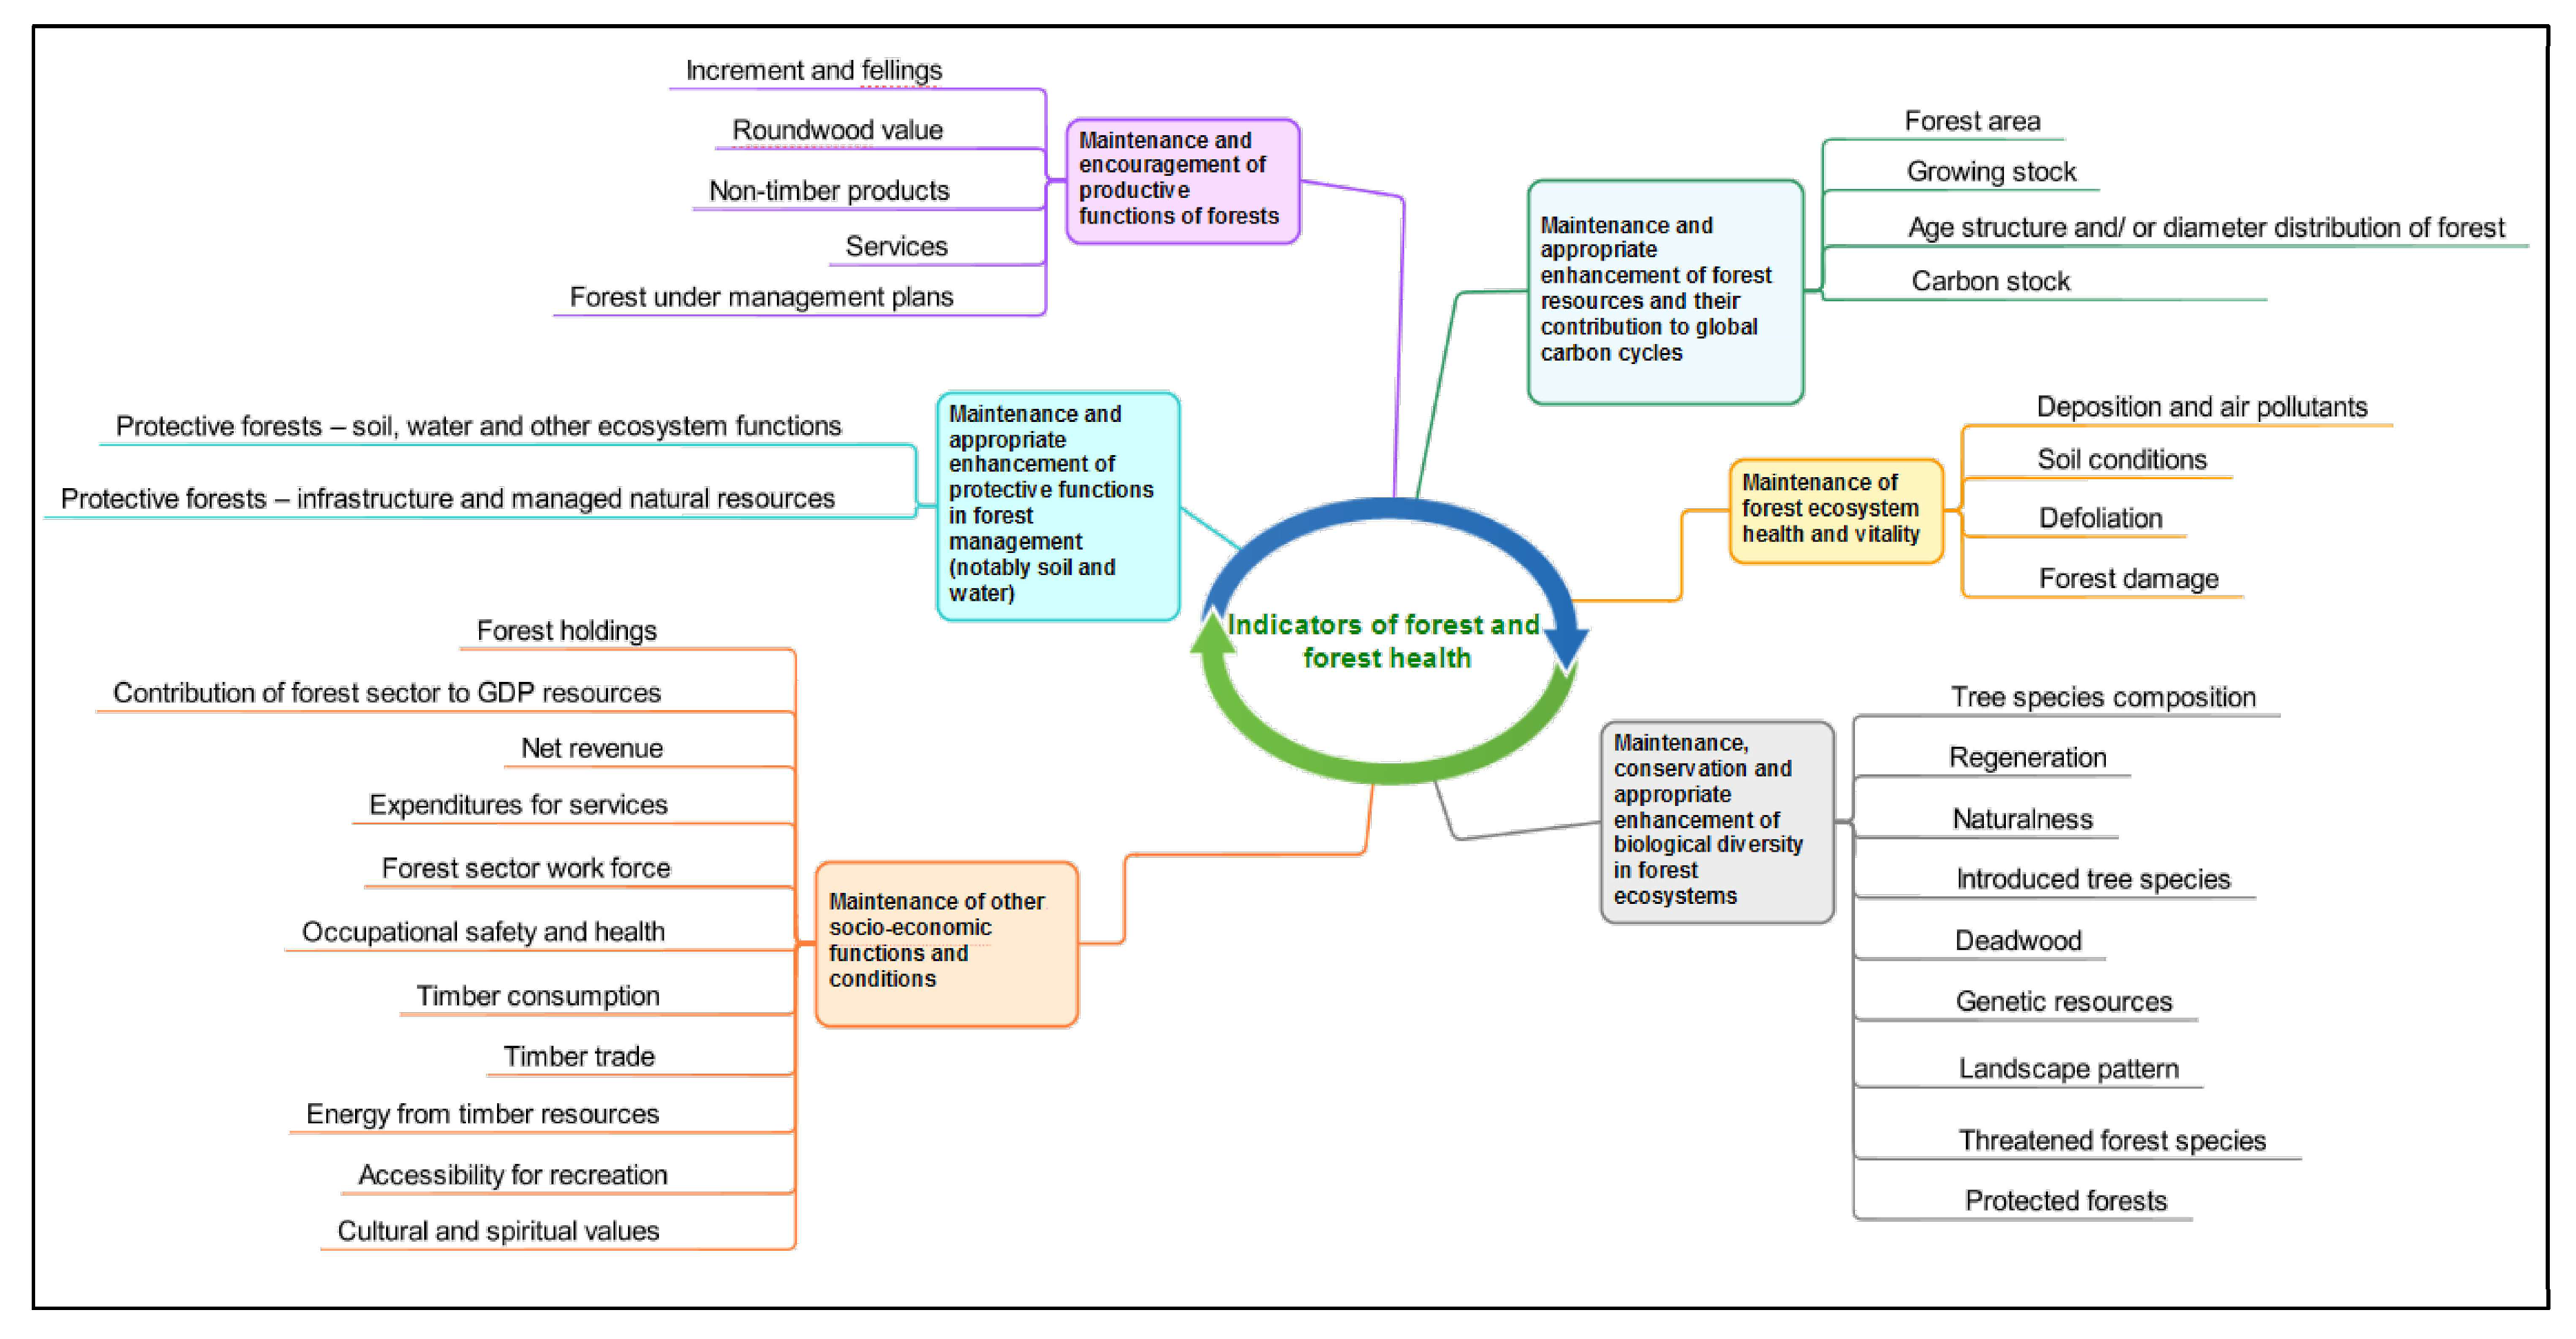
2.2. Indicator Requirements for Monitoring Forest Health

The effects of multivariate stressors on forest ecosystem health are mostly non-linear, complex, and multidimensional. They depend on (i) the spatial or organismic characteristics and scale; (ii) the temporal characteristics and scale; and (iii) the process characteristics and scale. Indicators of forest health need to fulfill these requirements i.e., they must be able to map various organismic, temporal, and process characteristics on different scales. Only then can forest health and its resilience be analyzed, comparable, and predictable. In the course of a greater integration of freely available RS data [12], the indicators must also be suitable for the combination of different in situ and RS approaches. In summary, (sets of) forest health indicators must correspond to the following content-related and methodological criteria:
  • They must reflect status, stress, disturbances, and resource limitations.
  • They must be able to map different (i) organismic; (ii) temporal; and (iii) process characteristics, all across different scales.
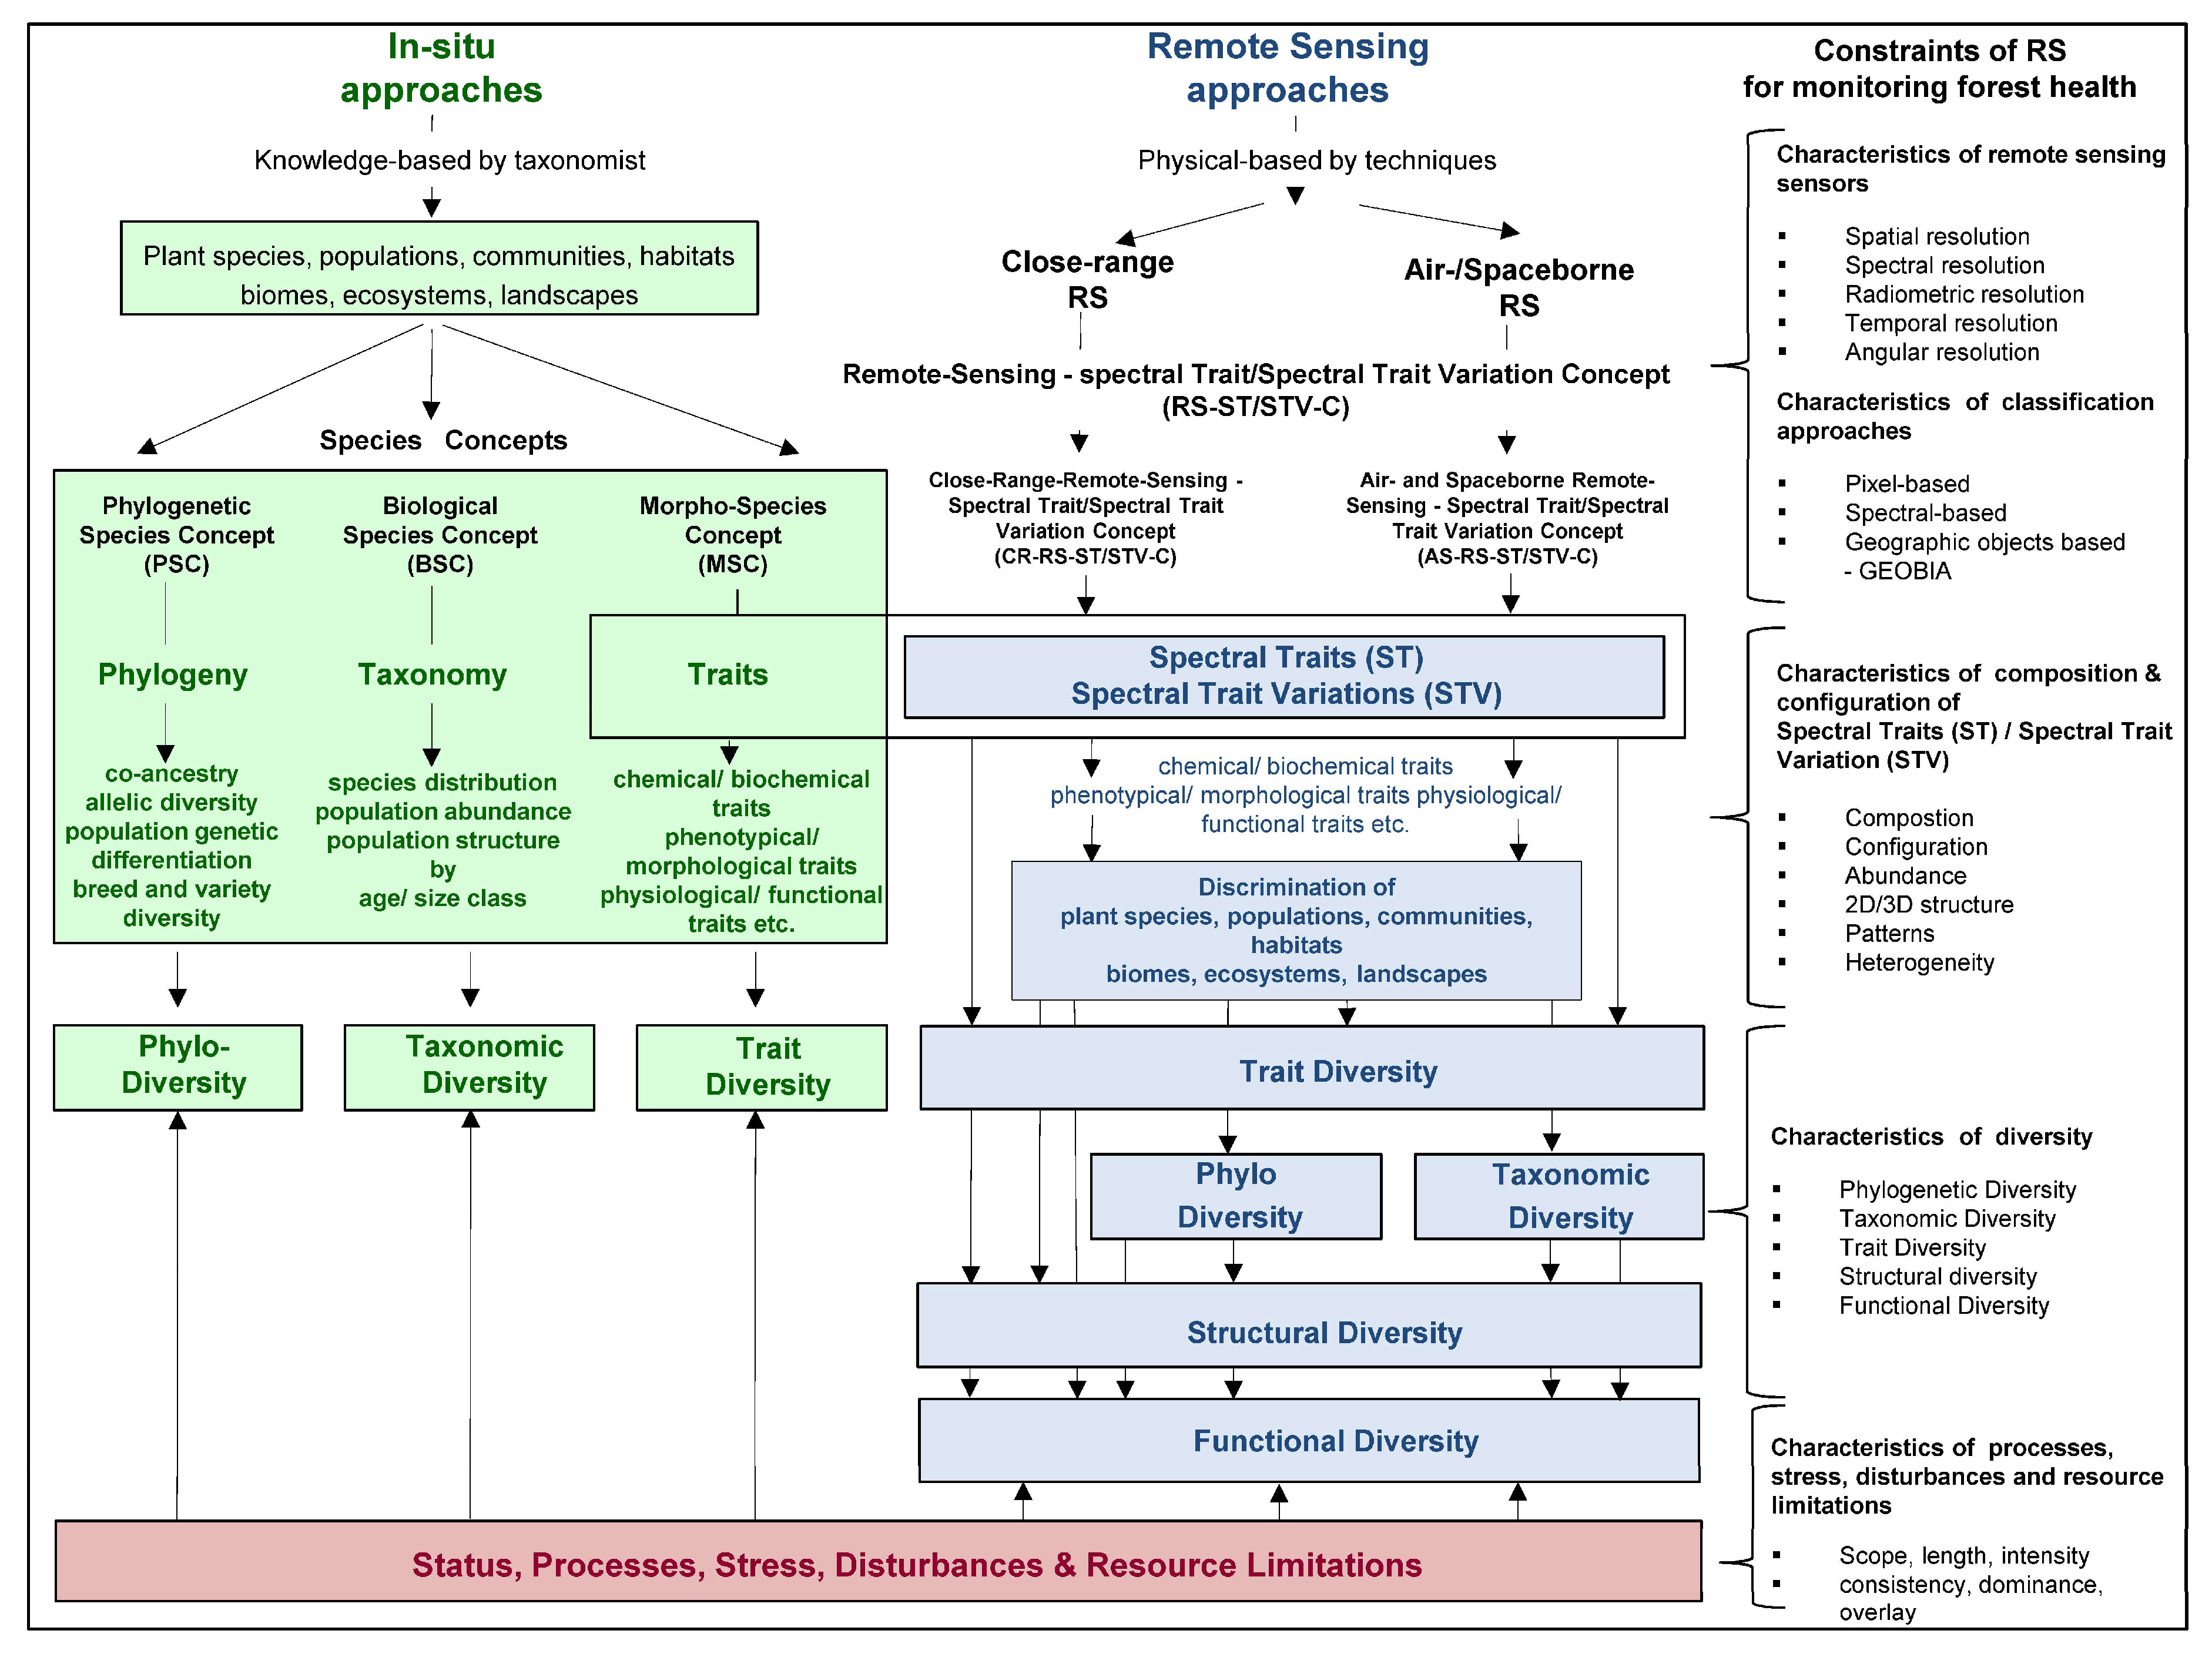
  • They should be recordable by different in situ monitoring approaches (forest inventory monitoring, biological and morphological species concepts, concept of ecological integrity, monitoring of animal distribution, anthropogenic drivers, or abiotic indicators (soil, water, climate, air), as well as close-range and air and spaceborne RS approaches on different platforms).
  • It should be possible to standardize, objectively repeat, and thus compare indicators.
  • Due to the heterogeneity and the complexity of different indicators in big data, all indicators should be transferable into digital form through a human–computer communication interpretation language to meet the requirements of data science.

2.3. Existing Standardized Approaches for Monitoring Forest Health

Forest health monitoring has a long tradition with numerous monitoring programs on the local, regional, national, and international level, in which standardized indicators of FH have been used and developed. In Germany, three levels of forest health monitoring exist (Table 1) that have become representative for Europe, as well as for the initiatives to unite forest monitoring such as the Forest Information System for Europe (FISE, http://data.jrc.ec.europa.eu/collection/FISE; http://fise.jrc.ec.europa.eu/). Here, we describe these three levels of in situ monitoring in Germany.
One is the forest condition monitoring (FCM) (Level-I Monitoring). In this case, the annual condition of the forest is recorded using a systematic sample grid of permanent plots measuring 16 km × 16 km. This is done by visually assessing the canopy condition as an indicator for tree vitality on around 10,000 trees of the most important tree species. Crucial indicators that are considered for FH are e.g., the thinning of tree crowns, fruiting intensity, the yellowing of leaves or needles, infestations by insect or fungi, as well as damage to trunks or tree crowns. Manuals on Level-I Monitoring provide a comprehensive insight into all of the recorded FH indicators.
Another level of in situ monitoring in Germany is referred to as intensive monitoring (Level-II Monitoring). Due to an increasing deterioration of the vitality of numerous tree species, monitoring includes indicators such as foliage condition, information about the soil’s solid phase, foliage content, data on deposition, soil solution, weather conditions, air quality, ground cover, phenology, leaf shedding, as well as visible ozone damage. Such intensive monitoring for the first time enables a better understanding of cause–effect relationships.
Finally, the third level of monitoring forest health is the national forest inventory (Level-III Monitoring). This national forest inventory, which is conducted every 10 years, was initiated by the government as a long-term sample-based national forest monitoring project, and has so far been conducted in 1986, 2002, and 2012. One of the main objectives of the national forest inventory is to obtain information about forest structure, composition, and quantities of round timber. Data collection is conducted on a 4 km × 4 km raster basis. The 4 km × 4 km raster is used in several German federal states, whereas other states have opted to reinforce the network of random samples. For every corner, the block or cluster method is applied, including data collection of the corners of a 150 m × 150 m quadrant [44]. Other major objectives of the German NFI include monitoring the sustainability and balance of forest ecosystems, the growth and yield of forests, forest biodiversity and regeneration, or essential components for understanding FH and its resilience.
There are comparable in situ monitoring programs in a range of countries that point the way to the application of standardized FH monitoring strategies (Table 1).
Some of the central tasks of the United Nations Economic Commission for Europe (UNECE) are to deal with issues concerning environmental protection, such as for example the Geneva Convention on Long-Range Transboundary Air Pollution (https://www.unece.org/env/lrtap/welcome.html). It was under this convention that the Working Group on Effects (WEG) emerged, which is also responsible for coordinating the international monitoring programs. Two of these programs are the International Co-operative Program (ICP) Forest (EU-Level II) and the ICP Integrated Monitoring (ICP IM). Among the largest monitoring programs on the European level are the FOREST EUROPE program of the European Union, as well as the International Co-operative Program on the Assessment and Monitoring of Air Pollution (ICP Forests) that was established in 1990 [21]. The FOREST EUROPE program defines seven criteria to describe the condition of European forests, whereby three criteria monitor the preservation of the forest ecosystem’s health and vitality [21] (see Figure 2).
The European forest monitoring for the protection of forests with annual reports to the ICP Forests was founded through the European Union (EU) Agreement on Long-Range Transboundary Air Pollution as a European monitoring program, and has formed the basis for coordinating sustainable European forestry practices over the last 30 years. The ICP forest monitoring is subdivided into two levels. Level-I serves as an annual long-term monitoring of approximately 6000 sampling measuring 16 km² distributed across Europe. The FH assessment is conducted via visual assessments of the canopy condition, density, and leaf color for specific tree species. Within the Level-II Monitoring, process-oriented studies at selected experimental sites are conducted that are equipped with different in situ sampling probes. In addition, an extensive mapping of air pollution is carried out, and additional FH indicators are recorded such as the development and decomposition of soil nutrients, water availability, and soil and vegetation cover [45].
All national and international in situ programs such as FOREST EUROPE or ICP Forests use sample-based as well as qualitative assessments of indicators that can either be ascertained directly (e.g., species compositions, quantities of dead wood) or assessed by experts (e.g., classes for thinning of crowns, yellowing of leaves/needles). A summary of key forest and tree stand parameters observed in different forest inventories can be found in Pause et al. [46]. The quality, consistency, and thus comparability of partially qualitative assessments often largely depend on the knowledge of the monitoring team. For numerous crucial FH indicators such as tree crown density, thinning, naturalness, or regeneration potential, there are no standardized in situ variables to be measured or direct measurement procedures. These kinds of assessments introduce a high level of uncertainty to the data collection, and subsequently to the analysis, assessment, and prognosis of FH. To account for these uncertainties in the in situ monitoring of FH, extensive specifications were compiled to deal with the in situ uncertainties of FH.

2.4. Initiatives to Unite Indicators, Data, and Approaches

Whilst in situ FH monitoring is applied on the plot level, it is easy to figure out how useful RS techniques can be in recording wall-to-wall information on multiple, temporal, and spatial scales [47]. There are numerous methodological approaches that use RS technologies for the long-term monitoring of FH [48,49,50,51]. With an increasing number and availability of qualitative sophisticated RS data [11,47,52,53,54], free access to the RS data portals in 2008 (starting with the Landsat Mission), and open access research, applications, stakeholders, and political decision makers have introduced a new era of monitoring for FH [12,55].
However, if we are to monitor and understand FH in all of its multi-functionality and complexity as well as assess the effects of multiple stressors, it would make sense to have a monitoring system that combines in situ terrestrial observations and RS approaches, as well as other approaches [2,56,57,58].
However, the linking and establishment of an MUSO-FH-MN requires initiatives that promote the standardization, harmonization, and digitalization of different approaches or techniques on a single platform. This is a goal that is pursued by the Global Forest Observations Initiative (GFOI) (http://www.gfoi.org) and the Forest Information System for Europe (FISE).
The Global Forest Observations Initiative (GFOI) (http://www.gfoi.org/about-gfoi/) supports governments in setting up national systems by providing a platform for coordinating observations, support and guidance on utilizing observations. It also works with national governments that report into international forest assessments (i.e., the global Forest Resources Assessment (FRA) of the FAO) and the national greenhouse gas inventories reported to the United Nations Framework Convention on Climate Change (UNFCCC). Since 2011, the GFOI has been supported with numerous RS data from the Committee on Earth Observation Satellites (CEOS). The availability of this RS data has provided numerous countries with complete RS-based forest cover data, which they require for an annual monitoring of their forests and thus the monitoring of global climate goals. Due to the open data policy and the cooperation with various national space agencies and coordination units, RS data from the Landsat series (USGS—United States Geological Survey) and data from Sentinel-1 (radar) and Sentinel-2 from the Copernicus program have been integrated into GFOI. Other RS data are supplied by space agencies in France (CNES—National Centre for Space Studies), Italy (ASI—Italian Space Agency), Canada (CSA—Canadian Space Agency), Germany (DLR—German Aerospace Center), Japan (JAXA—Japan Aerospace Exploration Agency), Brazil (INPE—Instituto Nacional de Pesquisas Espaciais) and China (CRESDA—Centre for Resources Satellite Data and Application). In the coming years, RS data will follow from Great Britain (NovaSAR—Synthetic Aperture Radar -Mission) and Argentina (SAOCOM—Satellites for Observation and Communications-Mission). By 2025, such cooperation will guarantee a global FH monitoring supported by RS data. With the Forest Information System for Europe (FISE), which is hosted by the EU-JRC—Joint Research Centre, (http://forest.jrc.ec.europa.eu), a harmonized forest data management and information system was established by the EU in 2015 to save, monitor, assess, and predict goals set by the EU and its member states in forest strategies, such as the preservation of forest multi-functionality or forest biodiversity. With this harmonization, FISE pursues the following objectives:
  • Set up a collection of harmonized Europe-wide information on the multi-functional role of forests and forest resources.
  • Provision of harmonized forest datasets that were developed from EU funding, including Horizon2020, LIFE +, Copernicus, etc.
  • Integration of diverse information systems (e.g., European Forest Fire Information System—EFFIS) and data platforms (e.g., European Forest Data Center, EFDAC) into a dynamic modular system that combines data (in situ forest data, forest data based on Copernicus RS information) and models into applications.
  • Linking existing forest-related policy fields of the EU to relevant networks and initiatives in the context of forest information.
  • Foster the availability of geo-data that are standardized throughout Europe, irrespective of national borders and with a high degree of spatial accuracy, in line with the INSPIRE directive (infrastructure for spatial information in Europe).
  • Provision of a digital information on the distributions of the most important forest tree species and changes in forest dynamics.
    o
    Assessment of the suitability of tree species and forest types for current and future climate conditions, biophysical mapping, and assessment of ecosystem services in the forest;
    o
    Measurement of changes to the provision of these services as a consequence of anthropogenic and natural disturbances; economic assessment and ecological and economic audits.
  • Several modules have been developed within FISE: (i) forests and natural disturbances such as fires and pests; (ii) forest and the bioeconomy; (iii) forests and climate change; and (iv) forest and ecosystem services.
The successful implementation of FISE constitutes the first crucial step toward the harmonization of data, approaches, and indicators to record, store, analyze, assess, and predict the effects of multiple drivers, and can be regarded as a pioneer for the digital harmonization of FH in Europe. Beyond these achievements, a future MUSO-FH-MN requires a critical consideration of the “resilience” of existing FH monitoring programs and initiatives in order to overcome the impending challenges of the 21st century in data management, analysis, or prognosis. Such an MUSO-FH-MN can provide a data-driven, rapid, cost-effective, flexible, and consistent assessment and decision-making support system for scientists, forest managers, or stakeholders. In order to meet these challenges, numerous requirements will be discussed in detail in the following chapters.
Furthermore, there are numerous other networks and activities, which should also be included in a future MUSO-FH-MN (see Table 2).

3. Requirements to Understand the Effects of Multiple Stressors on Forest Health

Statement: 
Our knowledge about the effects of stressors and disturbances on the biodiversity and functioning of forest ecosystems is still limited.
In order to understand the effects of stressors and disturbances on forest ecosystems, we need to investigate interactions between different trophic levels (e.g., soil organisms and plants), interactions between the biotic and abiotic environment (soil, water, trees), as well as different aspects of biodiversity (taxonomic, phylogenetic, (epi-)genetic, phenotypic/functional). A comprehensive understanding is crucial for Soil–Plant–Landscape modeling, forecasting stress effects, and implementing forest management strategies. All of the existing approaches, i.e., (i) tree and forest lysimeters; (ii) close-range RS approaches such as plant/forest phenomics facilities, controlled environmental facilities (Ecotrons), local tree experiments; and (iii) biodiversity–ecosystem functioning (BEF) experiments need to either be extended or re-established.
Level 1: Tree and forest lysimeters: Milly [68] was the first to indicate the role of soil mixture storage as a means of identifying the link between precipitation and evapotranspiration. The investigation of soil characteristics, hydrology, and structural properties of the vegetation on small scales is important in order to understand the mentioned link [69]. In this respect, tree or forest lysimeters are particularly suitable for long-term high frequency measurements, and thus for understanding effects of stress on tree physiology, such as effects of water stress, high salinity, nutrient deficiency, or drought stress [69,70,71,72,73]. Indeed, our knowledge about the interactions of soil matrix characteristics, soil moisture, and trees are currently derived from forest lysimeters, but information about the spectral response interactions to phenotype of the trees is still not available. To close this gap, the tree phenotype-spectral response in tree and forest lysimeters needs to be complemented with transmitters using a wireless sensor network [1,74], as well as close-range RS techniques with different sensor characteristics (3D stereo camera, LiDAR technique, 2/3 D thermal camera, hyperspectral thermal cameras, or hyperspectral sensors).
Level 2: Forest inventory plots: The inclusion of the ICP Forests monitoring network (see Chapter 1.3), which assesses tree condition and vitality on a 16 × 16 km grid over Europe [42,75] or other sample plot networks of national forest inventories, is crucial for ground truth information of forest health. Here, it is particularly important to establish and integrate different RS sensors such as optical or thermal sensors or 3D sensors on different close-range RS platforms such as towers or wireless sensor networks to monitor high frequency spectral information for different forest species in forest inventory plots. These are essential interfaces that provide important information for model and air and spaceborne RS calibration and validation.
Level 3: Plant phenomics facilities, Ecotrons, spectral tree laboratory experiments: One of the most important challenges in forest stress physiology research is the spectroscopic recording of plant species phenotypes in order to gain a better understanding of the links among the phylogenetic relationships of species, their genotype, epigenetics, and phenotype. The genotype of a plant species comprises crucial hereditary information about the DNA. Epigenetics provide information beyond DNA sequences, giving us an understanding of how genetics, the environment, and anthropogenic drivers work together to shape forest ecosystems. The phenotype of a plant represents its anatomical, morphological, and physiological characteristics (traits), and reflects the interactions of trees with their environment, and thus with stressors and disturbances. The affects the phylogenetic, taxonomic, structural, and functional traits of trees, and helps determine a specific phenotype [76,77]. A better understanding of tree stress physiology can be gained by recording the spectral traits (ST) of individual plants and combining this trait information with information on the phylogenetic relationships of species, as well as their genotype and epigenetics. This can be achieved by recording phenotypical plant traits in plant phenomics facilities [78,79,80] or in controlled environmental facilities (Ecotrons) [81]. Here, non-invasive measurement methods such as RS techniques can be implemented in an automated manner, enabling a holistic and quantitative recording of the phenotype of a plant species over its entire life cycle at a reasonable cost [82,83]. It is not only the phenotypical traits of the aboveground parts that can be recorded, but also those of seeds or roots [84], as well as the abiotic characteristics of soil and soil water. Entire soil/soil water—tree—spectral response interactions have so far only been measured in Ecotrons, and partially in spectral tree laboratory experiments. Hence, it is imperative to set up forest phenomics facilities that are similar to plant phenomics facilities with additional instruments in the future.
Level 4: Biodiversity–ecosystem functioning (BEF) experiments: The increase in monospecific plantations increases abiotic and biotic stress and disturbances in forest ecosystems. Hence, biodiversity–ecosystem functioning experiments are required to answer questions about the interactions of forest biodiversity (with different aspects: phylogenetic, functional, structural, taxonomic) with ecosystem functions [61,85,86]. Furthermore, BEF experiments are crucial for answering questions about the response of forest species to stressors and disturbances and thresholds in the response of species [87]. With this, we can gain important insights into post-disturbance trajectories and the individual and combined effects of stressors and disturbances on forest diversity [24]. An example is the resilience of a forest in the light of climate change. To investigate stress–response interactions, BEF experiments should include gradients such as those of latitude, climate, biomass, or experimental diversity [88,89]. Scherer-Lorenzen et al. [64] for example established the large-scale long-term BEF experiment BIOTREE (BIOdiversity and ecosystem processes in experimental TREE stands) on different sites with temperate tree species in order to explore BEF relationships along geological and climatological gradients.
Level 5: Forest landscape types: Long-term forest monitoring experiments for different forest landscape types and eco-regions are extremely helpful in understanding relationships between global forest biodiversity and forest ecosystem functioning as well as the underlying processes. TreeDivNet is a global network of tree diversity experiments that consists of 18 experiments on 36 sites in five eco-regions. TreeDivNet provides insights into the ecosystem functions (e.g., pest resistance potential, carbon sequestration) of diverse plantations [61]. The FunDivEUROPE Exploratory Platform is a network of forest test plots along tree species diversity gradients in six major European forest types, which aims at understanding the effects of species diversity on forest ecosystem functioning [63]. More BEF experiments with tree diversity manipulations have been conducted in Europe, America, Africa, Asia, and Australia [10]. Bruelheide et al. [10] for example established a BEF experiment with 40 tree species in the subtropical part of China to explain the role of tree and shrub species richness for carbon storage and soil erosion. Establishing wireless sensor networks as well as long-term ground truth monitoring data with a high frequency in time for air and spaceborne RS data (see requirement 5) in BEF experiments is urgently required in order to understand the spectral response (amplification factors, mutually exclusive factors) of forests and the effects of phylogenetics, (epi-)genetics, and phenotype on the spectral response.

4. Requirements for Using RS Approaches to Monitor FH

Statement: 
There are only a limited number of short and long-term ground truth measurements for the calibration and validation of RS data for forest health.

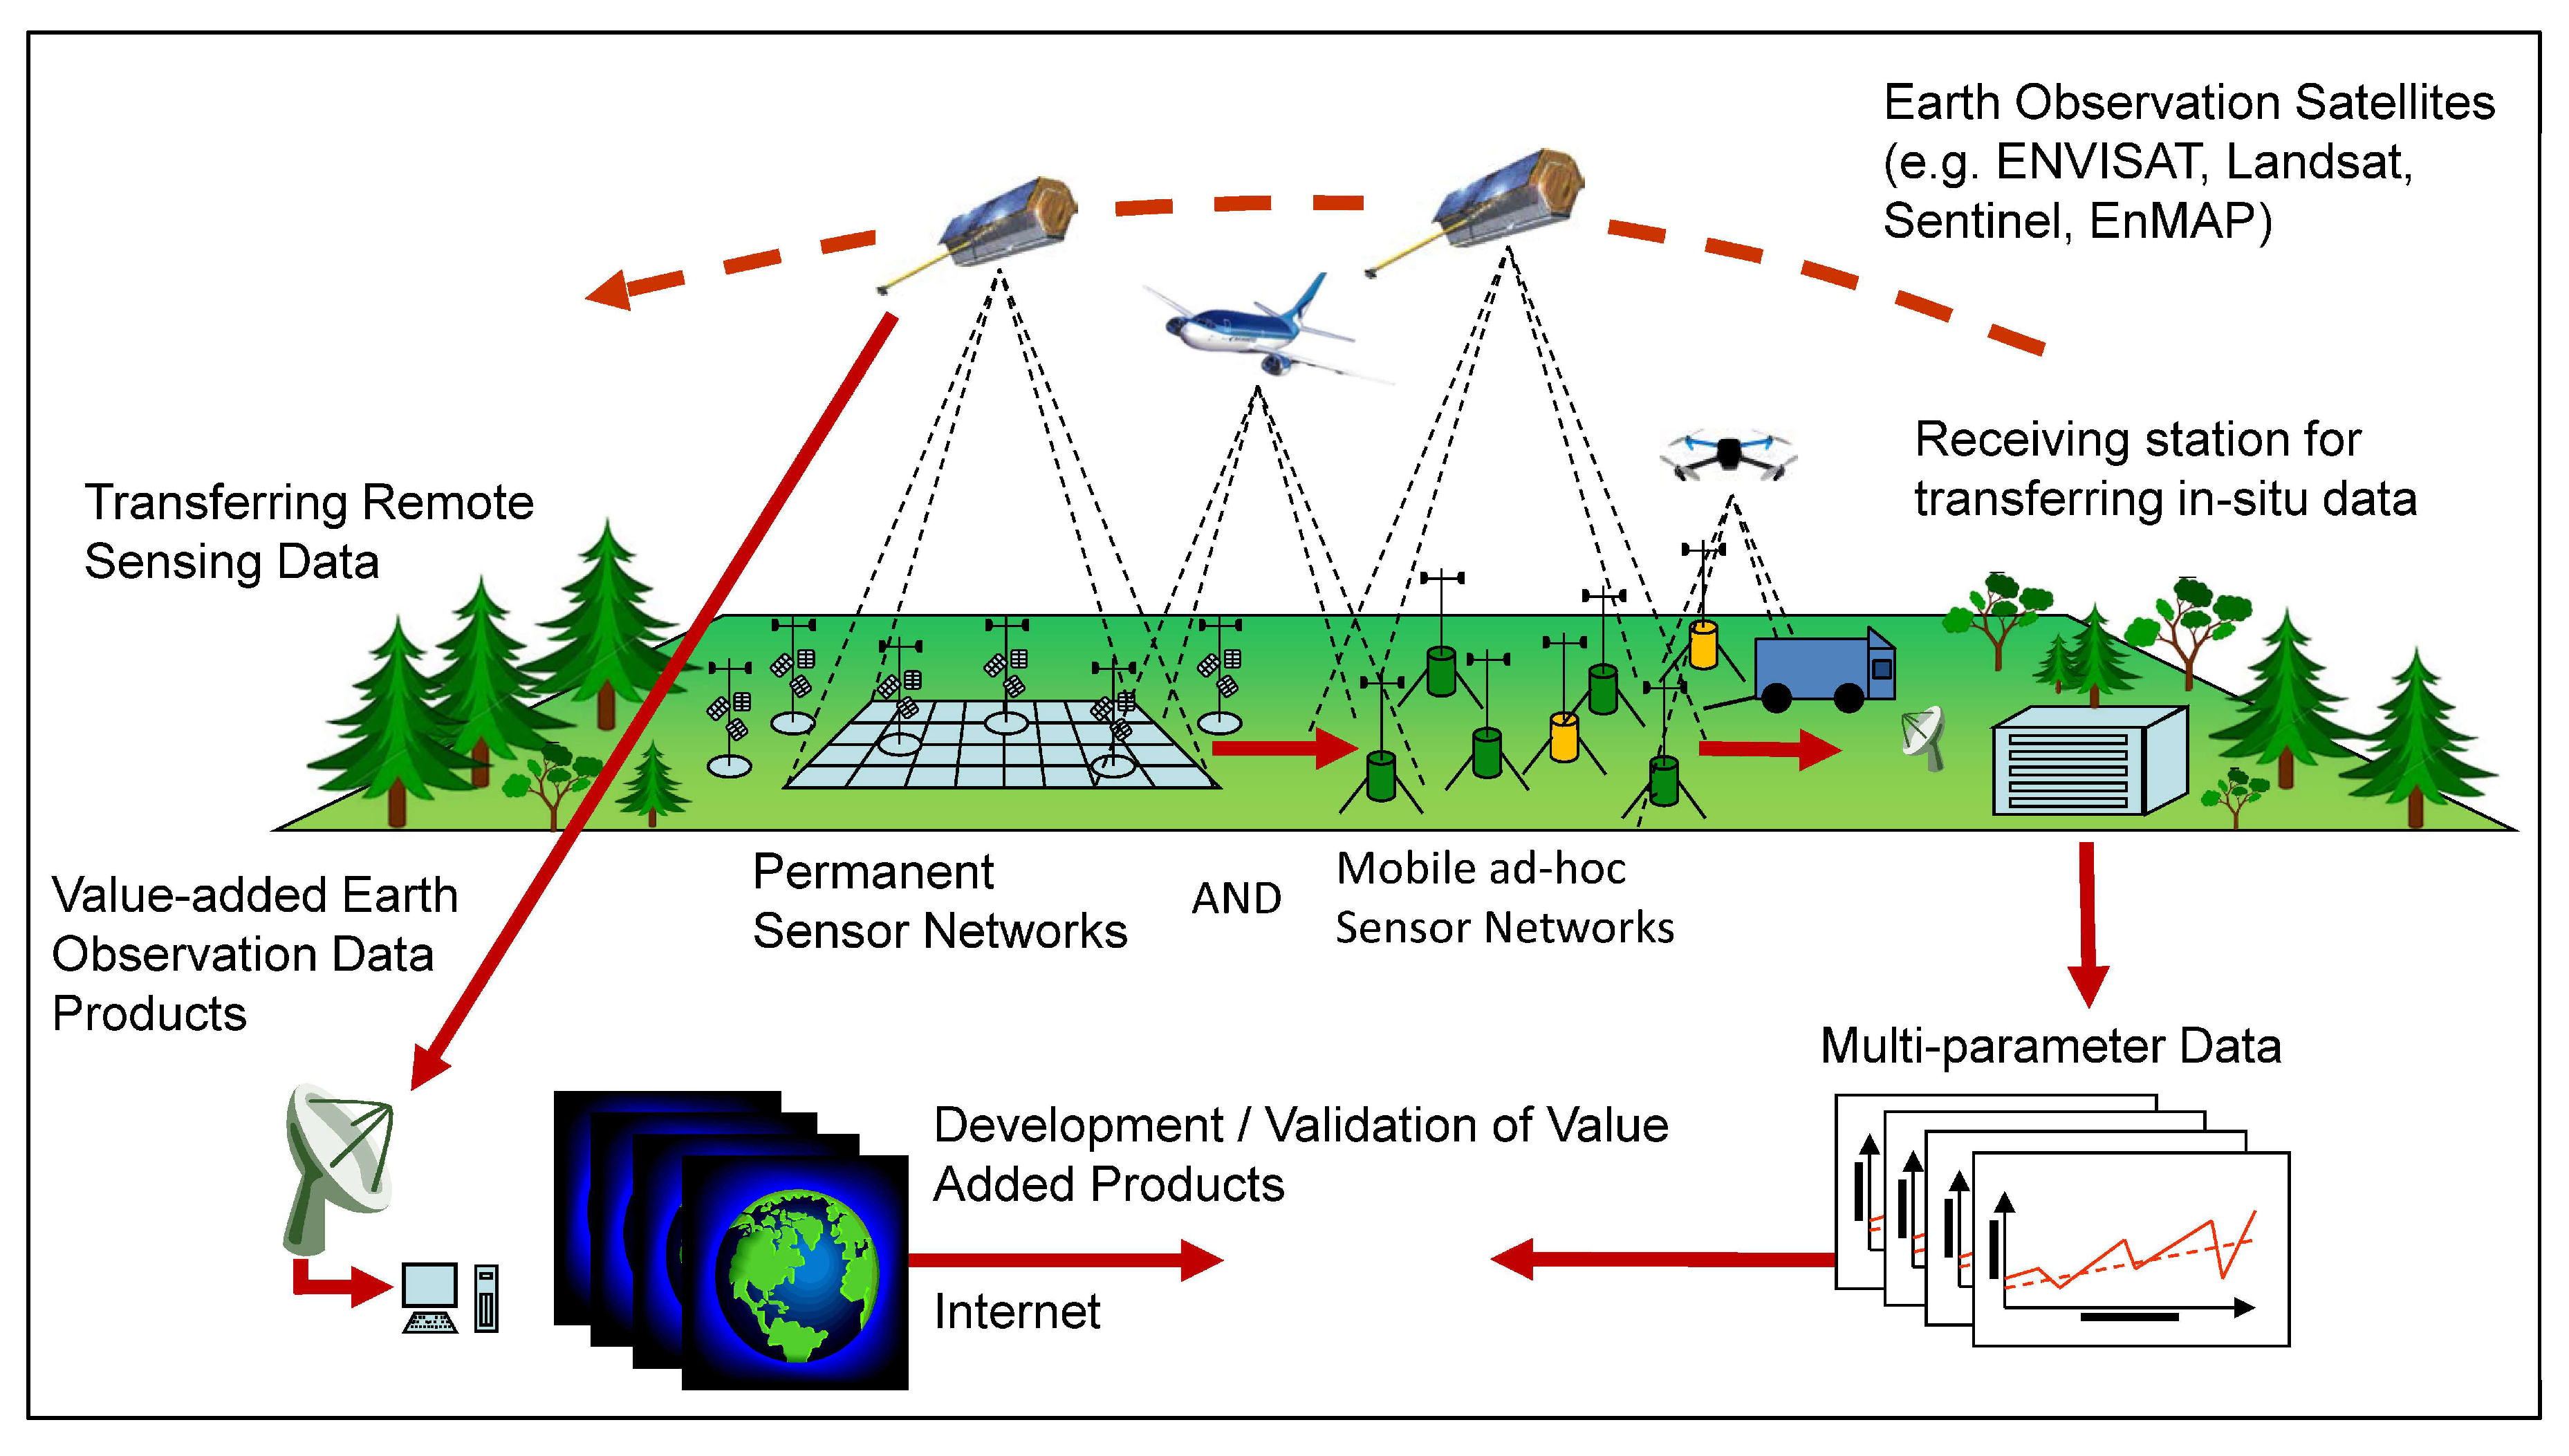
4.1. Requirements for Spatial Short and Long-Term Ground Truth Measurements on Different Scales

There exist crucial requirements for spatial short and long-term ground truth measurements on different scales for the calibration and validation of RS data in order for it to be able to react timely to disturbances and recognize their long-term effects. Traits and trait variation-based drivers exist on different spatio-temporal scales of forest ecosystems [90]. Therefore, a future MUSO-FH-MN requires calibration and validation experiments as well as calibration and validation sites where different close-range air and spaceborne RS sensors can be implemented on different sensor platforms, and on different spatial and temporal scales. Suitable calibration and validation experiments are:
  • Level 1—tree and forest lysimeters [70,71,72,73];
  • Level 2—forest inventory plots [42,75];
  • Level 3—close-range RS approaches such as plant/forest phenomics facilities, Ecotrons, and local tree experiments [78,79,80,81,84,91,92].
Suitable calibration and validation sites are:
  • Level 4—(forest) biodiversity–ecosystem functioning experiments [10,61];
  • Level 5—forest landscape types, communities, and ecosystems [93,94,95,96,97,98].
In the future, wireless sensor networks, microsensor techniques, as well as citizen science applications need to be integrated into MUSO-FH-MN [47]. Webcams, vehicle cameras, smart glasses, camera traps, tablets, and smartphones for science and citizen science might be equipped with complex sensors and sensor combinations such as multispectral, hyperspectral, 3D thermal, or 3D depth cameras, making it possible to derive FH indicators both cost-effectively and flexibly. New developments such as the “HawkSpex® mobile” app are already able to simulate a hyperspectral camera (also referred to as a light spectrometer), recording the spectral fingerprint of objects by using the different colors reflected in combination with intelligent algorithms. Today, a large variety of environmental monitoring apps exist, e.g., for detecting and classifying animal and plant species. Examples are “Pl@ntNet” (https://play.google.com/store/apps/details?id=org.plantnet&hl=de); apps for fire management [99]; “EpiCollect” [100] for collecting data on epidemiology, ecology, and species community; “eBird” [101] for the location of bird species; “ESM-app” [102], which maps ecosystem services; “mPING” [103] for collecting information about different climate conditions (e.g., hail, snow, rain) and the timing of precipitation, or apps such as “mySeason” [104] to classify vegetation phenology based on Earth observation data. A comprehensive instrumentation to measure abiotic variables as well as indicators of forest intensity and forest management will provide a better understanding of the response of forest ecosystems to stress and disturbances as well as the underlying processes. In the future, MUSO-FH-MN should be linked to short and long-term measurements of spectral plant traits and their variation at calibration and validation sites, close-range RS techniques, applications of citizen science, and the successful calibration and validation of air and spaceborne RS sensors (Figure 3).

4.2. Requirements for Merging Different FH Modeling Approaches

In a future MUSO-FH-MN, different methodological approaches, platforms, and networks as well as vegetation models need to be integrated or merged to provide short to long-term statements about FH. Different modeling approaches currently exist for describing forest dynamics at different scales with different complexity [106]:
  • RS model approaches, in situ species traits, in situ species approaches [58].
  • RS model approaches, forest models:
    • tree level growth model [107]
    • individual-based forest model [106,108], and
    • forest growth model (eco-physiological model, [109])
    • combining imaging spectroscopy, digital object models, and 3D canopy modelling [110]
  • Physical-based RS model, empirical-based RS model for forest species [111].
It is interesting to link such forest models with remote sensing measurements. Forest models can then be used to assess the long-term effect of stress and disturbances or derive additional attributes (e.g., productivity, carbon balance/sequestration, future species composition). Forest models have already been combined successfully with height information derived from RS LiDAR data [112]. Forest fragmentation can be analyzed using dedicated metrics, based on RS input, and combined with forest models to analyze changes at forest borders [113,114].

4.3. Requirements for Linking Different Approaches to RS Techniques

“Ecologists are increasingly looking at traits—rather than species—to measure the health of ecosystems” [115]. Furthermore can traits and their variations be monitored on all spatial-temporal scales [116]. As a result, FH indicators can be developed for all spatial and temporal scales. To calibrate and validate RS data as well as discriminate between ST/STV, we need to link spatial and temporal scales of RS platforms and technologies.
However, depending on their spatial, spectral, radiometric, directional, and temporal characteristics, RS sensors are in the position to record only specific ST/STV and related indicators. Therefore, one sensor alone or the data of one vegetation period only is often not sufficient to quantify ST/STV. Only the multisensorial use (radar, optical, thermal, laser) as well as high repetition rates, as with Sentinel-2A/B (3–5 days), will enable quantifications of ST/STV and the derivation of FH indicators [1]. Future developments of RS technologies will focus on other ST/STV than the ones that now can be recorded, such as for example by applying 3D thermal sensors or 3D forest X-ray sensors [1], or by increasing the temporal resolution of RS sensors. For an effective forest health monitoring, multisensorial and multi-temporal approaches are required.

4.4. Requirements for Merging RS Data from Different Sources

There are a multitude of different sensors available, and these differ in sensor characteristics, including their spatial, spectral, radiometric, angular, and temporal resolution. Merging data is an excellent method for reducing data gaps. It is still technically impossible to apply data merging in order to integrate the advantages of high spatial, spectral, and temporal resolution within one kind of sensor [117,118]. First attempts at data merging used pan-sharpening processes to combine a spatially higher resolution pan-chromatic band with synchronously recorded lower resolution multispectral bands [118], which was a common procedure working with Landsat data. This approach was later extended to high-resolution data from different sensors with different methods [119]. In order to merge a large number of spectral bands with high spatial resolution, methods that had initially been developed (principal components analysis, color space transformation) were gradually replaced by approaches such as multiresolution methods (Wavelet) and high-frequency injection methods, in order to maintain an optimal synthetic dataset [118]. The approaches of spatial–spectral merging are complemented by the availability of multi-temporal data through spatio-temporal merging [118]. The most well-known approach here is the Spatial and Temporal Adaptive Reflectance Fusion Model (STARFM) [120], which combines the spatial accuracy of Landsat data with the temporal resolution of MODIS data [121]. There are now available approaches merging spatial, spectral, and temporally high-resolution RS sensors into one dataset [118]. Furthermore, a number of other data-merging approaches have been developed to characterize forest ecosystems e.g. imaging spectroscopy and airborne laser scanning data [122].

4.5. Requirements for Understanding and Handling RS Uncertainties

Remote sensing technology acquires information about the Earth surface or atmosphere, often resulting in data and information that is expected to support land use or land management decisions. The information stored in remote sensing data critically depends on the experimental setup and the system under measurement. As for all experimental data, the recorded values carry observational errors (e.g., Taylor [123]), and errors result in uncertainty. Analogous to error propagation, uncertainty does not diminish when processing the recorded data, e.g., when compensating for atmospheric effects or when deriving products from remotely sensed data. This holds particularly true for aleatory uncertainty (e.g., Kiureghian et al. [124]), which is related to the intrinsic randomness of a measurement resulting in limited data accuracy and precision. Limited optical and spatial sampling bandwidths result in epistemic uncertainty (e.g., Kiureghian et al. [124]) as a consequence of lacking detail/information about the object of investigation. Sensor improvements toward high-resolution spatial and wavelength sampling are aimed at reducing epistemic uncertainty in remote sensing data, practically without the potential to fully overcome the incompleteness of remotely sensed information.
Uncertainty puts the utilization of remotely sensed data under the risk of misinterpretation. The integration and combination of multiple remote sensing datasets sampling the same sites allows for mutually reducing the epistemic uncertainty hampering the utilization of each individual remote sensing dataset. The joint consideration of multiple remote sensing datasets in an integrated analyses and interpretation approach replaces epistemic uncertainty by aleatory uncertainty of the considered further datasets. However, for aleatory uncertainty handling, mathematics offers some reasonable processing techniques, e.g., averaging. In some cases, measurement accuracy and precision, and thus aleatory uncertainty, can be quantified or at least reasonably estimated during data acquisition, which is advantageous compared to epistemic uncertainty. However, while data integration may be a promising way to turn epistemic uncertainty into aleatory uncertainty, which is potentially more controllable in the data processing and utilization process, the data integration of physically disparate data is a challenging problem on its own.
If no generally valid physical theory is available to describe the link between the considered datasets quantitatively, this link must ideally be learned by complex machines, e.g., artificial neural networks. Historically, deterministic transfer functions, which are often derived empirically from calibration measurements, are employed to link physically disparate data or derive products from remote sensing data. While the tuning parameters of such transfer functions can be adjusted, or even probabilistically defined, ontological uncertainty [125] about the general validity of the nature of the used transfer functions remains. Ontological uncertainty is usually associated with a state of ignorance not recognized by human interpreters. It cannot be quantified, and may thus unrecognizably hamper a proper utilization and interpretation of remote sensing databases. Here, data analytics approaches based on learning machines finding data interrelations in an unbiased manner free of preconceptions may be the only way toward honest and quantitative uncertainty handling by turning epistemic uncertainty into aleatory uncertainty without introducing additional ontological uncertainty.

4.6. Requirements for Standardizing RS Monitoring Approaches

RS approaches need to be standardized. The following problems are evident. (i) Different RS instruments of a comparable RS target measurement have different fields of view that correspond to different technical designs. (ii) RS has different sensor characteristics and (iii) different acquisition parameters [1,126,127]. Furthermore, in addition to technical differences, (iv) the setup and the procedures of the experiment also influence the spectral signal of RS sensors [128]. Previous approaches to standardization that have worked well include close-range RS approaches, e.g., the fully automatic operating plant phenomics facilities [83] and Ecotrons [81], which are placed in a controlled environmental facility, and the eddy flux tower, which integrates different non-invasive measuring technologies as well as RS sensors [129]. Moreover, the spectral database SPECCHIO [130] (www.specchio.ch) guarantees long-term usability, the sharing of metadata, and ground truth spectral information. For all Landsat metadata data (for Landsat 1–5 MSS, Landsat 4–5 TM, Landsat 7 ETM+, Landsat 8 OLI and Pre-Collection are the metadata standardized available at https://landsat.usgs.gov/landsat-bulk-metadata-service [131].
For airborne and spaceborne RS trait approaches, there are currently two approaches to standardizing RS data: (i) the simulation of RS data and (ii) methods of transfer modeling. The development of sensor simulation software such as end-to-end simulation (EeteS) [127] also enables a concrete analysis and understanding of the effects of various RS instrumental and spectral environmental configuration parameters on the imaging process.

5. Requirements for Coupling Different Monitoring Approaches

Statement: 
Different FH monitoring approaches have different goals, advantages, and limitations that need to be merged.
No single FHM approach is suitable to record the various driver stress responses from short to long-term and local to global scales. Therefore, monitoring approaches need to be combined and coupled [58] to compensate for the disadvantages of one approach with the advantages of another.

5.1. In Situ Approaches beyond Forest Inventory Approaches

A number of concepts exist that can support FH monitoring approaches. These are the phylogenetic species concept (PSC) [132], the biological species concept [133], the morphological species concepts (MSC), and the remote sensing—spectral trait/spectral trait variation approach (RS-ST/STV-C) [25] (Figure 4).
The mapping of forest species based on the biological species concept provides answers to fundamental questions such as on species richness, abundance, diversity, or distribution. Based on taxonomic units (Figure 4), the biological species concept is however limited in terms of understanding the causes of changes in forest species composition [134,135]. The species traits approach, which is based on the morphological species concept [136], provides an alternative approach to understanding changes in forest species composition and related changes in forest health. Information about trait and trait variations helps us understand, explain, and predict “why organisms live where they do and how they will respond to environmental change” [137] such as stressors and disturbances. Environmental conditions, land-use intensity, stress, or disturbances select for species with appropriate traits [138,139,140,141]. Traits can thus indicate resource depletion [142,143,144], as well as define the state of ecosystems, the presence of certain environmental conditions [144,145,146], and dispersal strategies [144,147,148] or indicate functional diversity [149], disturbances, and shifts in ecosystems [150,151,152]. Especially when investigated along environmental gradients, traits help us understand short and long-term effects of environmental changes [144]. Still, approaches based on the phylogenetic, morphological, or biological species concepts are limited in terms of time, money, and resources, making a comparable FH monitoring challenging.

5.2. RS Approach for FH Monitoring

Remote sensing approaches are based on the spectral trait/spectral trait variation concept [24], which records traits and trait variations as a proxy of the spectral signal in forest ecosystems. Therefore, spectral RS patterns and heterogeneity can be used as a proxy for plant trait diversity and the factors shaping this diversity [24,25] (see Figure 5).
Traits and trait variations can be measured at different spatial and temporal scales [116], from the gene [153] up to the landscape [149] and global level [154] meaning that driver stress responses can be recorded by close-range airborne and spaceborne RS [1]. Trait-based approaches are well suited to assess trait-related ecosystem services in a spatially explicit fashion across land cover types and scales [155,156]. In contrast to forest inventories, which are based on species concepts, RS approaches are limited in the discrimination of species [157,158]. An accurate discrimination of forest species or communities by RS depends on (i) the characteristics of ST and STV in a forest ecosystem; (ii) the density, shape, and distribution of ST/STV; (iii) the spectral, radiometric, spatial, angular, and temporal characteristics of RS sensors; (iv) the choice of the classification method (pixel-based or geographic object-based approach); as well as (v) how well the RS algorithm and its assumptions fit the RS data and the spectral traits of the species using RS in the forest ecosystem [25]. When tree species can be discriminated with RS, then RS is a valuable tool for FH monitoring. RS is the only approach that allows a timely, cost-effective, objective, repeatable recording and assessment of the short and long-term status, disturbances and resource limitatons of the forest ecosystem (see requirement 4) [159].

5.3. Phenotyping

Phenotypes are observable and measurable traits [160] (morphology, physiology, behavior, and other phenotypic traits) that are shaped by the interaction of genetic material (genetics) and environmental factors (epigenetics) as well as stress, disturbances, or resource limitations. Therefore, the phenotype represents a crucial link between the genome, the environment, stress, and disturbances encountered where organisms live, evolve, and change. They are important for building the “Tree of Life” [161]. Phenotypic definitions and data are not only found in genomics, system biology, taxonomy, developmental biology, medicine, and evolutionary biology; they are also found in in ecological and environmental sciences, and have been described for numerous fields [160,162].
The phenotyping approach has been used for example to define species, understand their phylogenetic development, pathological status, and impacts from stress, and assess adaptations to altered environmental conditions. Phenotypical plasticity provides an indication of the strength, type, and intensity of effects of environmental factors on the organism. Environmental factors, disturbances, and adaptation processes can have an impact (through epigenetic processes) on the phenotype or in the form of phenotypic plasticity and the adaptive capacity of forest plant species [163]. Therefore, the phenotype is a filter for status, change, stress, disturbances, or resource limitations for organisms on different scales of biological organization. As the phenotype of a species is described by its traits (“traiting”), it can be recorded through the concept of RS-ST/STV-C on different platforms [24]. Both phenotypes and traits are subject to the same characteristics, which are summarized in Table 3.
Phenotypes and traits exist in all disciplines of ecology and “should be shared across biology” [160]. Therefore, for the future MUSO-FH-MN, it is imperative to establish a phenotyping and network across forest ecology, from the genetic, molecular, individual, plant species, and community levels to the behavior of ecosystems, and across biology and vegetation ecology [160].

5.4. Ecological Integrity

The framework of ecological integrity has been proposed for measuring the self-organizing capacity of ecosystems [32]. It comprises a set of indicators that combine “biotic and abiotic aspects of ecosystems with ecosystem structures and processes” ([33], p. 1378). The combination of these different aspects is crucial for gaining a holistic and integrative approaches and understanding of the state of an ecosystem [174], as well as its changes in response to stressors and disturbances. Ecological integrity can thus be used as a framework for assessing forest health.
The indicators that are used for measuring ecological integrity are indicators of biotic diversity (e.g., diversity of plant species), abiotic heterogeneity (e.g., habitat heterogeneity), energy budget (e.g., aboveground biomass), matter budget (e.g., carbon and nitrogen stocks in vegetation and soil), and water budget (e.g., leaf area index, the soil water index, or soil moisture retrieval) [33]. Some of these indicators have to be measured using in situ methods; some can be measured by RS. Recently, a range of indicators for different aspects of ecological integrity have been proposed [33] with linkages to the Essential Biodiversity Variables (Section 6.2.2). The remote sensing—spectral trait/spectral trait variation approach, by mapping traits related to e.g., the water or energy budget, might provide valuable indicators of ecosystem integrity, covering short to long-term and small to large scales.
The future MUSO-FH-MN should integrate the framework of ecological integrity. This might help with comparing results of forest health monitoring (FHM) to results of the monitoring of the state and health of other (non-forest) ecosystems. For example, ecological integrity has lately been recommended for application in all sites of the International Long-Term Ecological Research network (ILTER) [33].

6. Requirements for Using Data Science as a Bridge

Statement: 
Although 90% of the world’s data was generated over two years, around “50% of all research and experiment data (corresponding to some US$28B/year) are not reproducible, and over 80% of it never makes it to a trusted and sustainable repository” [175].

6.1. Open Science

Worldwide research uses a long-standing, domain-specific, and domain-overarching research infrastructure, comprising disciplinary and interdisciplinary commissions and cooperation. Previously established infrastructures for storage and accessing data are important forerunners for the reorganization of data science. However, previous research structures, commissions, and data storage methods will in no way meet the current and future challenges of data science [175]. Approximately 90% of the world’s data and information were generated within only two years [176]. Due to errors in research design and realization, together with the wrong development of previous data science in recording, saving, processing, and linking research data, approximately 50% (corresponding to some US$28B/year) of all research data and information can no longer be reproduced [177]. It is very probable that over 80% of research data have never been saved in a sustainable repository, enabling access or analysis at a later stage [175]. Read et al. [178] claimed that only 12% of the United States (US) National Institutes of Health-funded datasets, information, or experiments have been demonstrably deposited in recognized repositories. The consequences of these undesirable developments in data science are a tremendous waste of not only capital, but in particular the loss of research data, which are the basis for gaining knowledge, and transferred to our application case, a better understanding of complex environmental issues such as forest health.
Furthermore, the multidimensionality, complexity, and handling of big data with syntactic and semantic heterogeneous data and for the most part the lack of standardized approaches in data management, monitoring, protocols, models, analysis, and assessments will prove to be the greatest challenge. Currently, data science can be regarded as the best option for bridging the gap and solving these problems. Data science comprises numerous components, which will be described in the following chapters (see Figure 6).

6.1.1. Open Data Policy and Free Data Access

The costs for FH monitoring using both spatial and temporal high resolution RS data are not conducive for achieving a future MUSO-FH-MN. Therefore, open access to data should form the basis for a future MUSO-FH-MN. Crucial factors for the success of data science for in the context of forest health are the open data policy and free data access to RS data and RS data products, GIS, and other data acquired for monitoring forest health. However, there are considerable differences between the imaging systems with regard to an open data policy and the free access to the data. In most cases, it is only the large earth observation programs that provide all data free of charge.
Light detection and ranging (LiDAR) sensors placed on airborne or unmanned aerial vehicle (UAV) platforms can provide a range of forest inventory data [1,179,180]. After Barrett et al. [20], 15 countries around the world showed great interest in using LiDAR data for their future NFI monitoring schemes and as forest health indicators. However, LiDAR data are rarely available as open data, and even when they are, no coherent recording period is available for larger areas. This makes the derivation of regular and large-scale parameters difficult or even impossible. One reason behind a rather low utilization rate is the cost of acquiring wall-to-wall LiDAR data. One GPS receiver currently costs $10,000 (USD) [20], and the price for airborne laser scanning ranges from 50 Euro/km² to 150 Euro/km². The use of cheaper LiDAR-UAV alternatives to record FH is possible, but the inaccuracy of LiDAR-UAV is around 20 cm, compared to 5 cm with airborne laser scanning.
To complement regional LiDAR-UAV and airborne laser scanning recording with cheaper spaceborne laser scanning or freely accessible data, the future use of the first satellite-supported laser-based instrument such as the Geoscience Laser Altimeter System (GLAS) (http://attic.gsfc.nasa.gov/glas, experimental time 2003–2010) is expedient. Spaceborne laser scanning will enable the quantification and assessment of 3D vegetation structures such as stand structure, volume or biomass using satellites on a regional to a global scale for the first time to achieve a spatial resolution of 1 m [1,181]. The same applies to spatially high-resolution optical sensor data such as WorldView-3, which currently has high costs and limited availability [182].
With the opening of the Landsat archive in 2008 [183], the use of RS for NFI and FH monitoring has increased dramatically [13,14]. The Landsat missions that were started in 1972 have provided almost 40 years of data continuity, contributing to robust design and engineering as well as data infrastructure and data archiving. These will prove to be of unimaginable value in the long-term monitoring of the dynamics of processes and changes to the Earth, as entire ecosystems are faced with an increasing global population, demand for resources, and climate change [184]. Based on a change to data policy in 2008, all new and archived Landsat data that had previously been for commercial use and archived by the United States Geological Survey (USGS) were made freely available to science and application for the first time in RS research history [12,55,183].
The new data policy revolutionized the use of Landsat data in research and development, industry, and new applications [185]. In this way, it was possible to integrate very early RS data into various monitoring programs for forest health [186]. Moreover, open data access promoted the development of robust standard products and encouraged international cooperation and global networking in the field of biodiversity and ecosystem health research to deal with complex and global human–environment issues through innovative 21st century earth observation methods.
Following the lead given by the opening of the portals, the open data policy was boosted with the free data access for other RS missions such as the Sentinels [187], the EnMAP hyperspectral imager missions [188], as well as the opening of other archived data and newly recorded RS data by IRS-1C, IRS-1D, Resourcesat-1, Resourcesat-2, and Cartosat-1 missions (https://www.gaf.de/content/irs-data-now-available-free-charge-scientific-users). Free and open access satellite data according to the principles of open science, the Research Data Alliance (RDA), and Linked Open Data (LOD) bridges the gap to better understand forest health, and is the key to biodiversity conservation [14].

6.1.2. Open Science Clouds

Open science means that it is possible to implement a robust and sustainable open data management and practices on the discoverability, accessibility, interoperability, and reusability of (forest health) data. For this reason, the establishment of Open Science Clouds such as the European Open Science Cloud (EOSC) [175] is the first milestone for successful data sharing and Linked Open Data (LOD) approaches [189,190], and promoting the sustainable use of information, models, software, protocols, and workflows. The use of open services connects various research disciplines as well as scientists, practitioners, and stakeholders. Therefore, Open Science Clouds lead to a better science and understanding of complex interactions in ecosystems and forest health. The European Open Science Cloud: (i) integrates, uses, and promotes human expertise, resources, standards, best practices, and indispensable research infrastructures; (ii) supports the search for, access to, interoperability, and in particular the reuse of open as well as sensitive data with state-of-the-art storage standards; and (iii) supports the access and the use of data-related elements (standards, software, protocols, workflows) that enable reuse and data-assisted knowledge transfer and innovation [175]. One important example of Open Science Clouds is the Thematic Exploitation Platform (TEP).
NASA opened NASA’s Open Data Portal (https://data.nasa.gov/), which enables access to (i) NASA remote sensing data; (ii) a developer portal for building apps or visualization; (iii) communication tools for open data, codes, and application programming interfaces (APIs); (iv) a catalogue of NASA open source projects available to the public; (v) NASA NEX as a collaboration and analytical platform for combining state-of-the-art supercomputing, earth system modeling, workflow management, and NASA remote sensing data, as well as (vi) a portal for access to documents or references.

6.2. Standardization in Data Analysis

6.2.1. Standardized Data Management Approaches

To link different approaches, data, or monitoring strategies, a future MUSO-FH-MN requires standardized measurement designs and temporal monitoring frequencies. Standardized data management is crucial for the “long-term care” of digital information, offering the possibility to combine recorded data with newly generated information, linking complex and multidimensional information with intelligent analysis approaches as well as knowledge discovery. The principles of Findability, Accessibility, Interoperability, and Reusability (FAIR) are crucial for “good data management” [191]. The FAIR guiding principle not only refers to data, but also integrates tools, workflows, algorithms, models, approaches, frameworks, scales, and indicators [191]. The Research Data Alliance (RDA, https://www.rd-alliance.org) is based on the FAIR principles, and was established with the goal of building a social–technical infrastructure for sharing data and information and developing data standards without barriers across scientific, socio-economic, and governmental backgrounds. Furthermore, EOSC—the European Open Science Cloud for Research Pilot Project (www.eoscpilot.eu) provides a multidisciplinary standardized open platform for research data, knowledge, and services across all scientific disciplines.

6.2.2. Standardization of Essential Variables of Forest Ecosystems

The standardization of forest health monitoring has continuously and successfully been implemented in numerous monitoring programs on the national and international level. This standardization in forest health monitoring that started 30 years ago laid the foundations for establishing standards not only in data management and monitoring, but also in other domains.
However, due to the inherently limited time, staff, and financial resources required for the in situ observations, it is essential to prioritize the planning process, implementation, and maintenance of observers as well as technical observation systems to carry out continuous, comparable, and repetitive measurements. Furthermore, this should be supported and facilitated by the management of monitoring data along the entire chain, from the measurement of raw data to the processing and provision of data, products, information, and services required by scientists, stakeholders and decision makers.
The tremendous complexity and multidisciplinarity of forest health calls for an increasing interaction with big data and big analytics, as well as for the integration of data science approaches. To successfully integrate forest health indicators into data science approaches, the standardization of data management, protocols, and monitoring strategies is crucial to guarantee a rapid realization, a minimalization of transfer errors and uncertainties, cloud computing, as well as the implementation of machine learning algorithms in the analysis, prediction, and assessment of the status, changes, and effects of forest management on forest health.
The concept of Essential Variables (EV) focuses on recording those monitoring variables that can be used as indicators for the state of an ecosystem and its changes, such as forest health or biodiversity. Here, the concept of EV assumes that with a small but essential number of variables, the state and trend of a system can be characterized without losing any significant information about the system [192]. Moreover, the EV are less so individual variables or indicators; they can be rather regarded more as a cluster that is made up of several indicators. Due to the complexity and interactions of ecosystems, the respective EV cannot be regarded independently from one another. Instead, many indicators overlap or form cross-links (see Figure 7).
The Global Climate Observing System (GCOS) was one of the first systems that developed a full set of Essential Climate Variables (ECV) [194]. The Essential Climate Variables laid the foundations for establishing more specific EVs such as the EVs for Weather—EV (led by the WMO—World Meteorological Organization and GAW—Global Atmosphere Watch) [195], the Essential Ocean Variables—EOV headed by the Global Ocean Observing System (GOOS) [193] or in the field of biodiversity the Essential Biodiversity Variables (EBV), (driven by GEOBON) [192,196]. The establishment of Essential GeoVariables—GEV is currently being promoted by the EU-funded project GeoEssential (http://www.geoessential.net/). While the first EV were developed back in 2007 and were soon followed by others, some fields such as agriculture, soils, catastrophes, ecosystems, health, and urban development are still in the initial stages of developing EVs.
Consequently, the establishment of “Essential Forest Health Variables (EFHV)” or Essential Variables for Ecosystem Health seems reasonable for a future MUSO-FH-MN. Preliminary approaches can be found in the Sourcebook of Methods and Procedures for Monitoring EBVs in Tropical Forests with RS [197].

6.2.3. Standardized in Data Analysis (Thematic Exploitation Platforms)

The growing volume of global monitoring data from space, combined with information of in situ data networks, long-term RS archives, information about different approaches, models, or scales, and the inherent growth in big and complex information (structure, format, origin) as well as error budgets, make it imperative to use “Thematic Exploitation Platforms—TEP” (https://tep.eo.esa.int). The principle idea behind TEP is to allow easier access and exploitation of complex information and move processing to complex data rather than the data to the users, including their models and approaches [198]. Data platforms that have been developed by the European Space Agency (ESA) for different purposes use cloud and Hadoop computing with MapReduce environments for in situ forest health and RS data. So far, different thematic oriented TEP exist, including: TEP Forestry (the Forestry Thematic Exploitation Platform) TEPCoastal, TEP Urban, TEP Polar, TEP Hydrology, TEP Geohazards, as well as a TEP for food security.
The basic principles of TEP are to: (a) move the code to the data, including tools and resources; (b) work in a virtual workplace environment with access to relevant non-RS and RS data, processing and analysis tools, platform services, and functions such as tools for data mining, visualization, and the most relevant development tools (IDL-Interactive Data Language, Python, R), or communication tools such as social networks; and (c) access and share data and collaborate among the user community, scientists, and governance. In the future, large-scale worldwide sensor networks and TEP based on the semantic web, ontology, and linked open data/spatially-linked open data approaches [189,199] will form the basis of data archiving, intelligent data processing, integration, retrieval, modeling, and the classification of all RS data and the complex additional data of forest health data and their indicators [200].

6.3. Digitalization

6.3.1. Human-Driven Monitoring

Indicators of forest health on different spatial scales need to be assessed relative to the extent to which they can be monitored by technical systems such as close-range, airborne, and spaceborne RS [1,18]. It will indeed be the case that many of the indicators of forest health can neither be generated nor used or understood by technical systems such as RS. By contrast, these human-driven indicators are only decimal or hexadecimal figures and spectrally remotely-sensed signals for a computer. Hence, the knowledge and expertise of forest managers will be decisive in the successful process of recording and assessing forest health. The following constraints will for example influence the recordability and thus the digitalization of FH indicators with RS. Generally speaking, forest plant traits, trait combinations, and trait variations can be digitalized using RS if (i) the shape, density, and distribution of forest plant traits in space and over time can be recorded by the spatial, spectral, radiometric, directional, and temporal characteristics of the RS sensors; (ii) the classification method is chosen wisely, as a pixel-based or (geographic) object-based approach; and (iii) “the RS algorithm and its assumptions fit the RS data and the spectral traits of the plant species” [25]. Nevertheless, there are still many FH indicators that cannot be recorded or monitored using remote-sensing systems. These indicators still need to be recorded using human-driven monitoring approaches, and then integrated into the system.

6.3.2. Digitalization and Big Data

The rapid development in global information processing along with its integration in all fields of industry, economics, society, and the environment reflects how our human society has entered an age of “big data“. The countless controversial discussions about how best to deal with digitalization and big data emphasize how we are at a historic turning point for making decisions that will have a tremendous influence on the future development and orientation of the research community. On the one hand, the handling of digitalization and big data is seen as a risk; on the other, it is regarded as a great opportunity to solve complex, multidimensional environmental problems.
Contesters of increasing digitalization believe that it is leading to information and data overload, subsequently threatening data and information flows and potentially resulting in a data collapse and the “end of theory in science“ [201]. On the other hand, the aforementioned requirements show that it is not sufficient for a future MUSO-FH-MN to use a single measurement, platform, sensor, monitoring, or modeling approach, focus on a single scale, or consult only one discipline, especially if we aspire to understand forest health in all of its complexity. It is only by linking multi-source approaches, which requires handling digitalization and big data, that the disadvantages of global informatization can be compensated for through the advantages of other approaches.
Big data presents tremendous potential for understanding forest ecosystems and improving sustainable ecosystem management. The crucial scientific potential of monitoring short-term and long-term forest health data lies in revealing patterns and regularities that could lead to new questions, new measurement designs, new perspectives, and possibly new answers [202]. The digital age with big earth data enables us to recognize, record, and reassess patterns and relationships that we could not see before. Also, in connection with Linked Open Data approaches, it enables us to analyze machine learning technologies to come up with statistical predictions about process–response interactions in forest ecosystems, which are not possible with traditional methods. Big data embodies the four Vs: the volume, the velocity, the variety, and the veracity of data. RS data is justifiably described as “big data” with a high volume. In 2014, around 200 on-orbit satellite sensors covered the global atmosphere, land surface, and oceans. The archived data from NASA’s Earth Observing System Data and the Information System (EOSDIS) volume exceeds 7.5 petabytes. In 2012 alone, EOSDIS distributed around 4.5 million gigabytes of data [203]. The Copernicus Sentinels that are currently in orbit produce approximately 12 TB of data per day (http://www.copernicus.eu/news/editorial-2017-achievements).
Increasing demands to spectrally record new traits and processes of land surface, water, and the atmosphere that could not previously be recorded and which are necessary to assess forest health, are progressively increasing not only the volume, but also the velocity and the variety of RS data. In this way, the development of RS sensors is leading to a recording of new three or four-dimensional traits, to the development of RS sensors with an improved spectral resolution (hyperspectral to ultraspectral, 2D to 3D thermal), to the improvement of spatial and directional resolution, as well as to sensors with shorter revisit cycles and larger coverage to compensate for the limitations of a single sensor.
Due to a presidential action taken by President Barack Obama in 2013: “Making Open and Machine Readable the New Default of Government Information” (https://obamawhitehouse.archives.gov/the-press-office/2013/05/09/executive-order-making-open-and-machine-readable-new-default-government-), NASA decided to develop a digitalization strategy (Digital Strategy Report, https://www.nasa.gov/agency/digitalstrategy/index.html), making data, software, and tools accessible to the public, and promoting innovation and ecological research.

6.4. The Semantic Web

The digitalization as well as the linkage of complex, heterogeneous FH data must be built on the Semantic Web or web 4.0 technologies, using the following methodological approaches as a foundation.

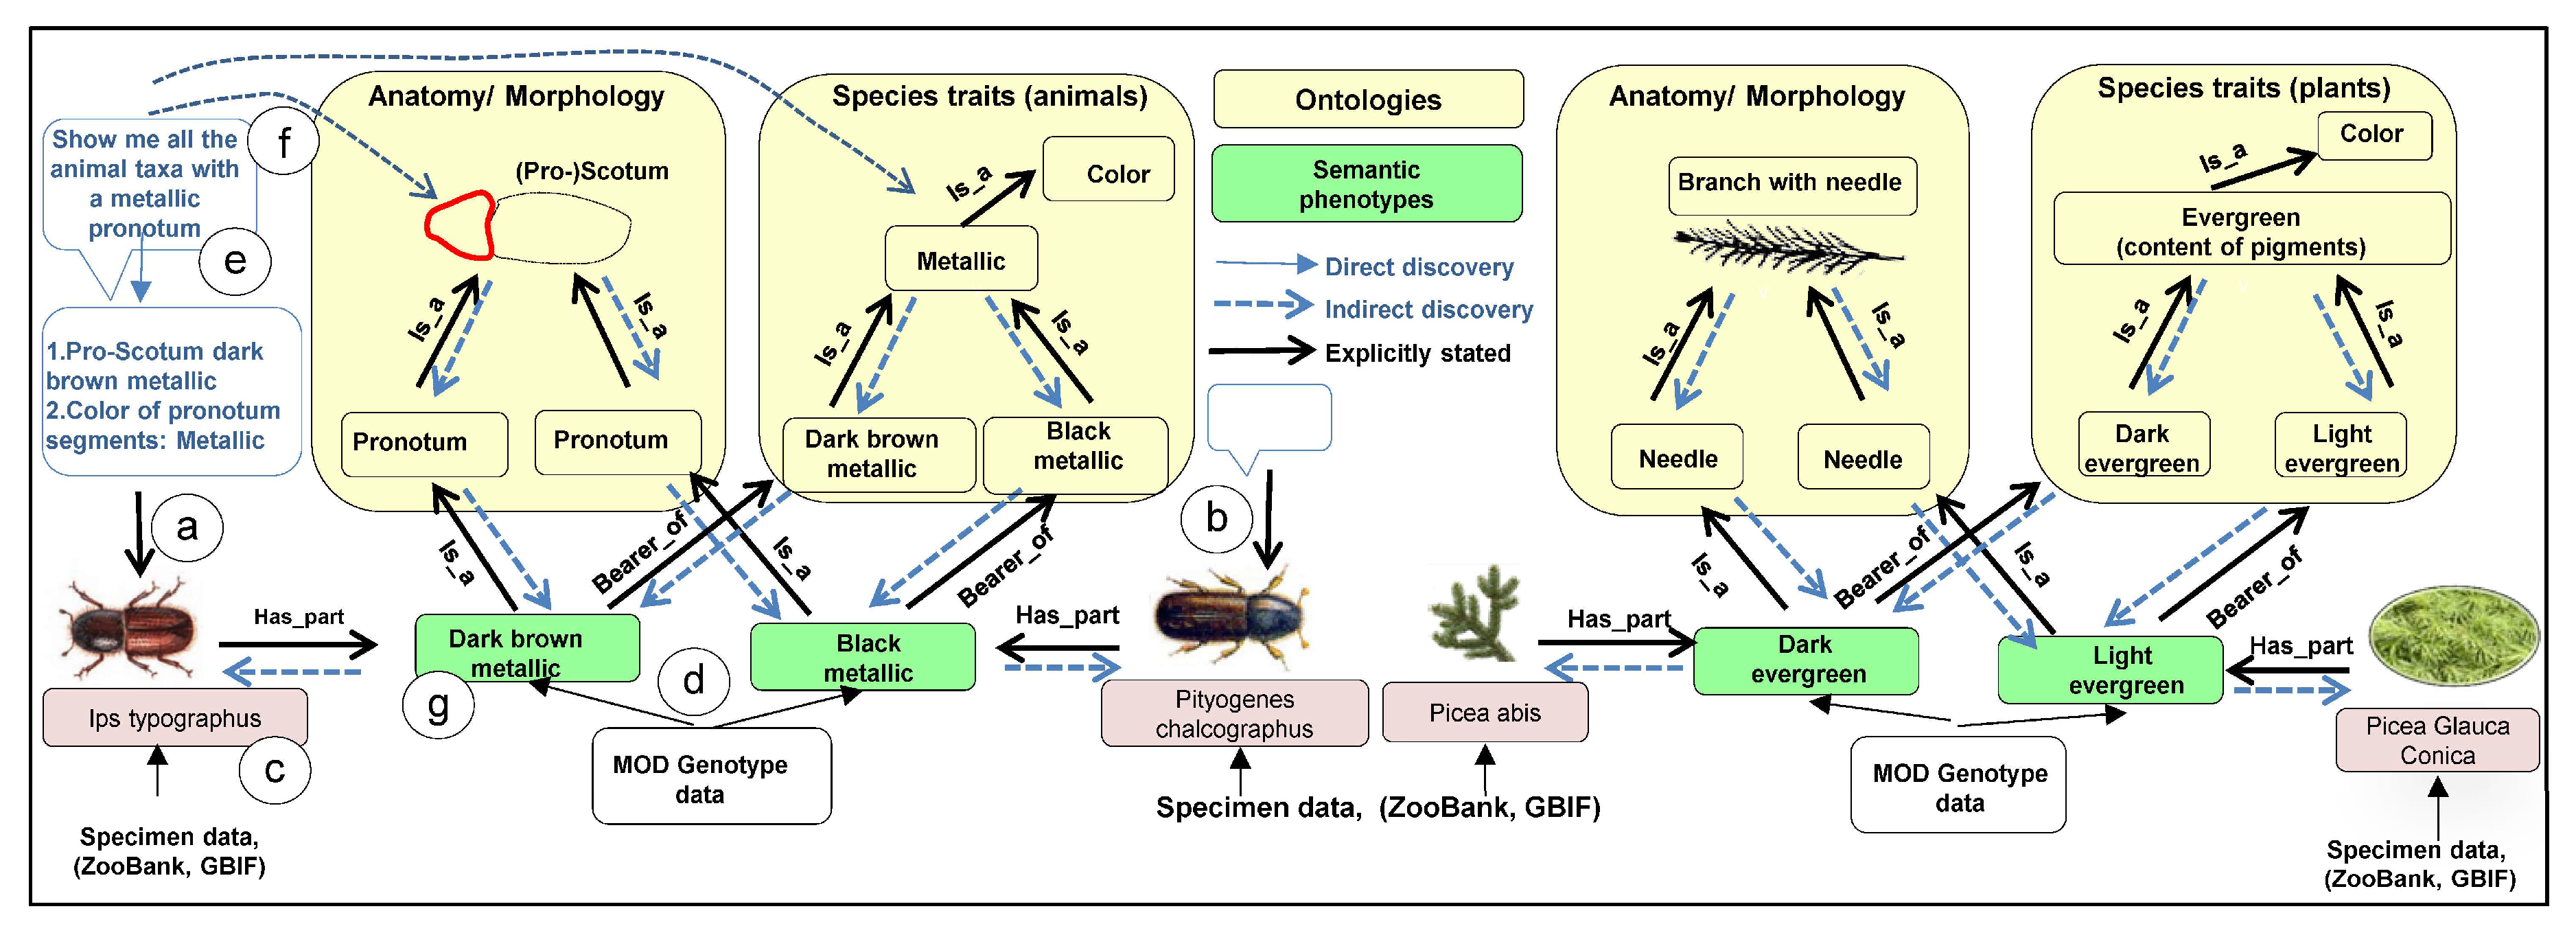
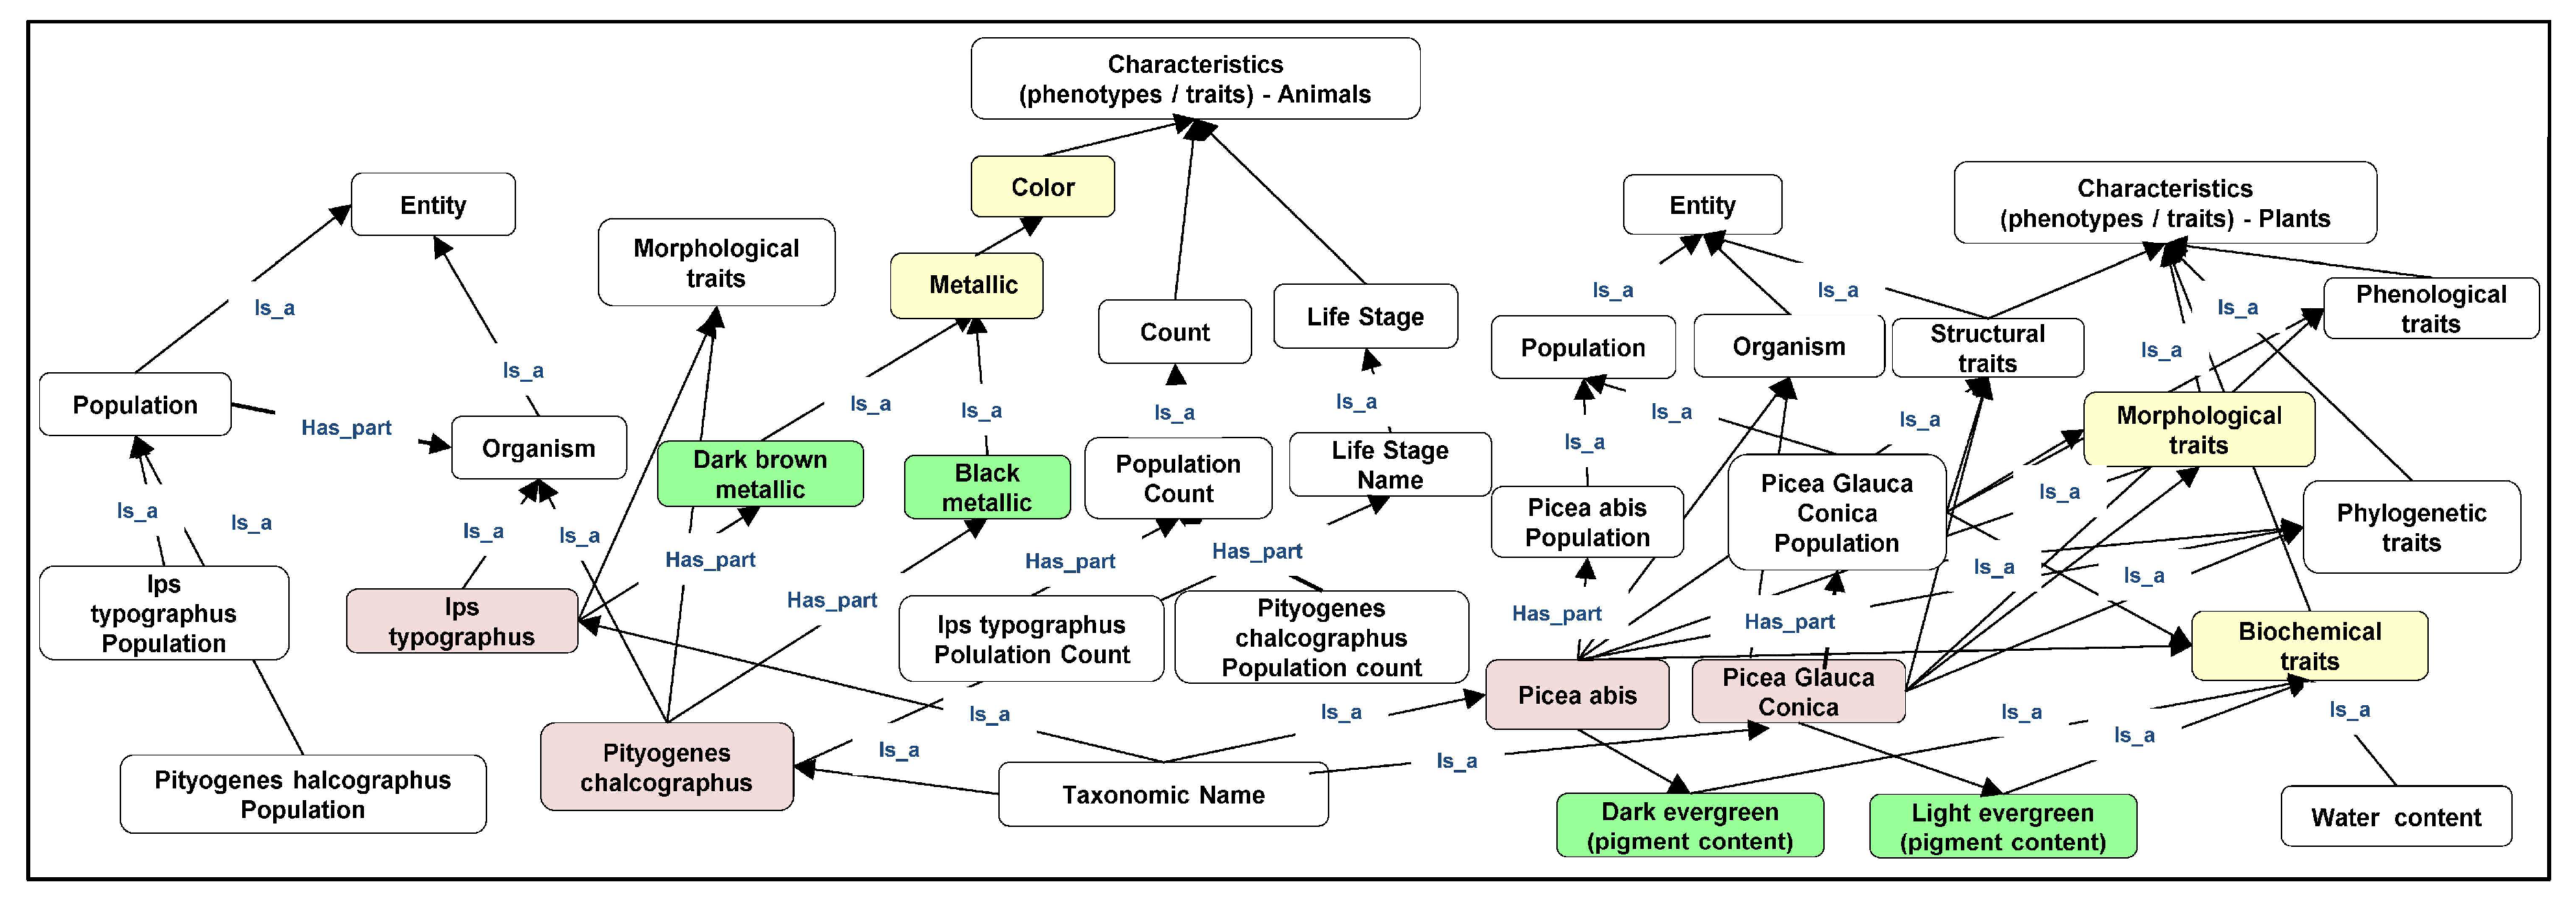
6.4.1. Semantification

For a long time, the lack of a community dimension consensus from human–computer communication interpretation language to describe and integrate FH indicators was the limiting factor and the most pressing shortfall for the digitalization, integration, and coupling of various domains, indicators, and monitoring approaches of forest ecology.
When FH indicators cannot be replaced by technical systems, then languages and tools need to be implemented to transfer human-gained information to machine interactions. Over recent years, the World Wide Web Consortium (W3C, https://www.w3.org/W3C) [204,205] has developed standards for more intelligent computer-controlled information systems, i.e., the Semantic Web, which is also called web 4.0, in order to command more complex human–computer communication (Figure 8). In the Semantic Web, digital information is complemented with formal significance, enabling computers to recognize meaningful relationships between data, record relevant information, and analyze complex information [206]. The semantic web bridges the gap by linking human and computer-driven data, indicators, models, approaches, and measuring instruments, on different platforms and scales, as well as decision makers, and forest managers and others (see Figure 8). For representing forest health data, specific standards have been developed, and recommendations exist for publishing earth observation data, e.g., using the language Resource Description Framework (RDF) data cubes in conjunction with standardized vocabularies for space, time, measurements, provenance, etc. (https://www.w3.org/TR/eo-qb/).
Metadata forms the basis for describing and using Semantic Web technologies, and thus for linking data. Through increasing costs and increasing amounts of information, metadata concepts are required that can be efficiently optimized by electronic networks, uniformly generated, described, and saved by machines, so that they can ultimately be interpreted, linked, and efficiently analyzed. Furthermore, provenance data (see https://www.w3.org/TR/prov-overview/) is essential for the interpretation of data, as it allows tracking data generation processes, and hence helps the interpreting agent to judge the trustworthiness of the sources, resolve conflicting information, and propagate trust scores to the results of the analyses. There exist good examples of using close-range laser scanning approaches in forests toward physically-based semantics across scales [207] and also approaches to combine Semantic Web data with the data mining and knowledge discovery processes [208] to get a deeper understanding of FH processes and their resilience.

6.4.2. Ontologization

The development of semantic models can be illustrated as a so-called semantic ladder (Glossar → Taxonomie → Thesaurus → TopicMap → Ontology). The aforementioned thesauruses can serve as starting points for creating more richly axiomatized ontologies. A thesaurus is defined as “controlled vocabulary designed to clarify the definition and structuring of key terms and associated concepts” [173]. For specific disciplines such as plant traits [172] or soil invertebrates [209], there are already comprehensive thesauruses that form the basis for extremely complex semantic models (the ontologies).
Ontologies are the most powerful semantic language, linking together complex content and data such as forest health data by including human expertise, and thus enabling human–machine interactions. With the help of the Web Ontology Language (OWL), specialists can bring in their expertise in the form of rules, and thus, unlike with simple RDF-technologies, derive reasoning from it. Take the example of a spruce tree that will always be coniferous. In the spruce-coniferous tree relationship, the computer will therefore conclude that the spruce tree will always be a coniferous tree that will never lose its needles during the vegetation period, unless the spruce tree is under stress. Such ontology knowledge can be simulated in terms of network information, so-called semantic networks or knowledge graphs [210] (see Figure 9).
There are already numerous ontology-based knowledge networks such as the ontology for forest inventory and the mensuration [211], classification, discrimination of forest species and forest types [211], the ontology for biodiversity [163], mammalian phenotype ontology [212], plants [213], the ontology for phenomics in plants [214], disaster management ontology [215], or crop ontology [216]. Semantic networks are dynamic networks that are constantly updated with new knowledge and ontological networks in order to yield more precise analyses and results (Figure 10 and Figure 11). At the same time, through methods of proof and trust in data science, uncertain statements can be altered, corrected, or deleted.
Based on semantic networks, different systems such as in situ approaches as well as RS monitoring approaches on all levels of biological organization are able to communicate with each another through an explicit, formal interpretation of all network data. The Global Biodiversity Information Facility (GBIF) platform (https://www.gfbio.org) is a platform that pursues the goal of long-term data provision, archiving, and linking of complex biological data from multidisciplinary archives, institutions, and projects, based on simple vocabulary and extending to complex ontologies and semantic web technologies with the W3C standard [218]. The GFBIO might act as an important role model or could form the basis for the future MUSO-FH-MN.

6.4.3. Linked Open Data Approaches

The concept of semantic linking, which is also known as Linked Open Data (LOD) or the Spatial Linked Open Data (SLOD) approach, now enables the machine-generated linking, retrieval, and analysis of complex and heterogeneous data, information, methods, or platforms of forest health.
The advantage of using semantically LOD compared to non-semantically linked data is the option of data retrieval using techniques of data mining, machine learning, or artificial intelligence, which are put into relation with one another through associative semantic linking. With LOD/SLOD data retrieval, it is not the analyst who determines in advance which data will be entered into databases and which models will be linked with one another and analyzed (as would be the case in traditionally non-semantically linked data retrieval processes), but rather the functional space alone that searches through existing semantic LOD/SLOD links according to valid patterns, similarities, and rules to compile completely new relationships, patterns, insights, and model predictions.
Another tremendous advantage of the LOD/SLOD approach is the semantic coupling of multidimensional, complex, and heterogeneous data, experiments, models or platforms. A future MUSO-FH-MN should integrate information from the data of site surveys for species, species lists, metabarcoding, microgenomics [219], data from museums, phenotyping information [160], data from lysimeters, plant phenomic facilities [78], controlled environmental facilities—Ecotron’s [81], long-term ecological research [98], spectral laboratory experiments, biodiversity ecosystem functioning experiments [10], RS data such as optical (multispectral, hyperspectral), thermal, radar, LiDAR data, laboratory, tower, camera traps, wireless sensor networks, drones, close-range, airborne and spaceborne RS platforms, while also linking monitoring databases, networks, citizen science information, abiotic (soil, water, air) or social and economic information. Semantic LOD/SLOD links and retrieval can help better investigate, model, and forecast the high complexity, multidimensionality, and interdisciplinarity of different research fields based on new or advanced knowledge.

6.5. Proof, Trust, and Uncertainty in Data Science

Unlike many other research areas, most methods used in data science introduce a certain level of uncertainty. The reasons for this are two-fold. First, the data that we operate on has some level of uncertainty and/or noise. Hence, the methods we use need to be robust, also in the presence of noise and uncertain data. The design choice is whether to use an approach that assumes that all of the data is certain. This approach has the danger of overfitting the data at hand, i.e., drawing false conclusions from uncertain or wrong measurements. The alternative is to use approaches that yield an approximate fit to the data given. This does indeed introduce uncertainty, but has proven to be more noise-tolerant.
The second reason for introducing uncertainty by design is scalability. Even for problems for which exact methods exist, it is often the case that they cannot be scaled to big data problems. Hence, heuristics are often employed as approximations to the exact solution. This gives way to approaches that also solve large-scale problems in real time, but at the price of introducing uncertainty, i.e., we obtain a solution, but we cannot be fully certain of its validity. Hence, uncertainty is introduced by design as a trade-off for scalability.
In many cases, the approaches are aware of their own uncertainty, and can yield solutions and predictions together with a statement about their confidence. This helps users deal with the uncertainty in many ways: they get a better intuition of whether or not to trust the outcome of an algorithm, and they can decide to review borderline cases manually.

6.6. Data Science Analysis

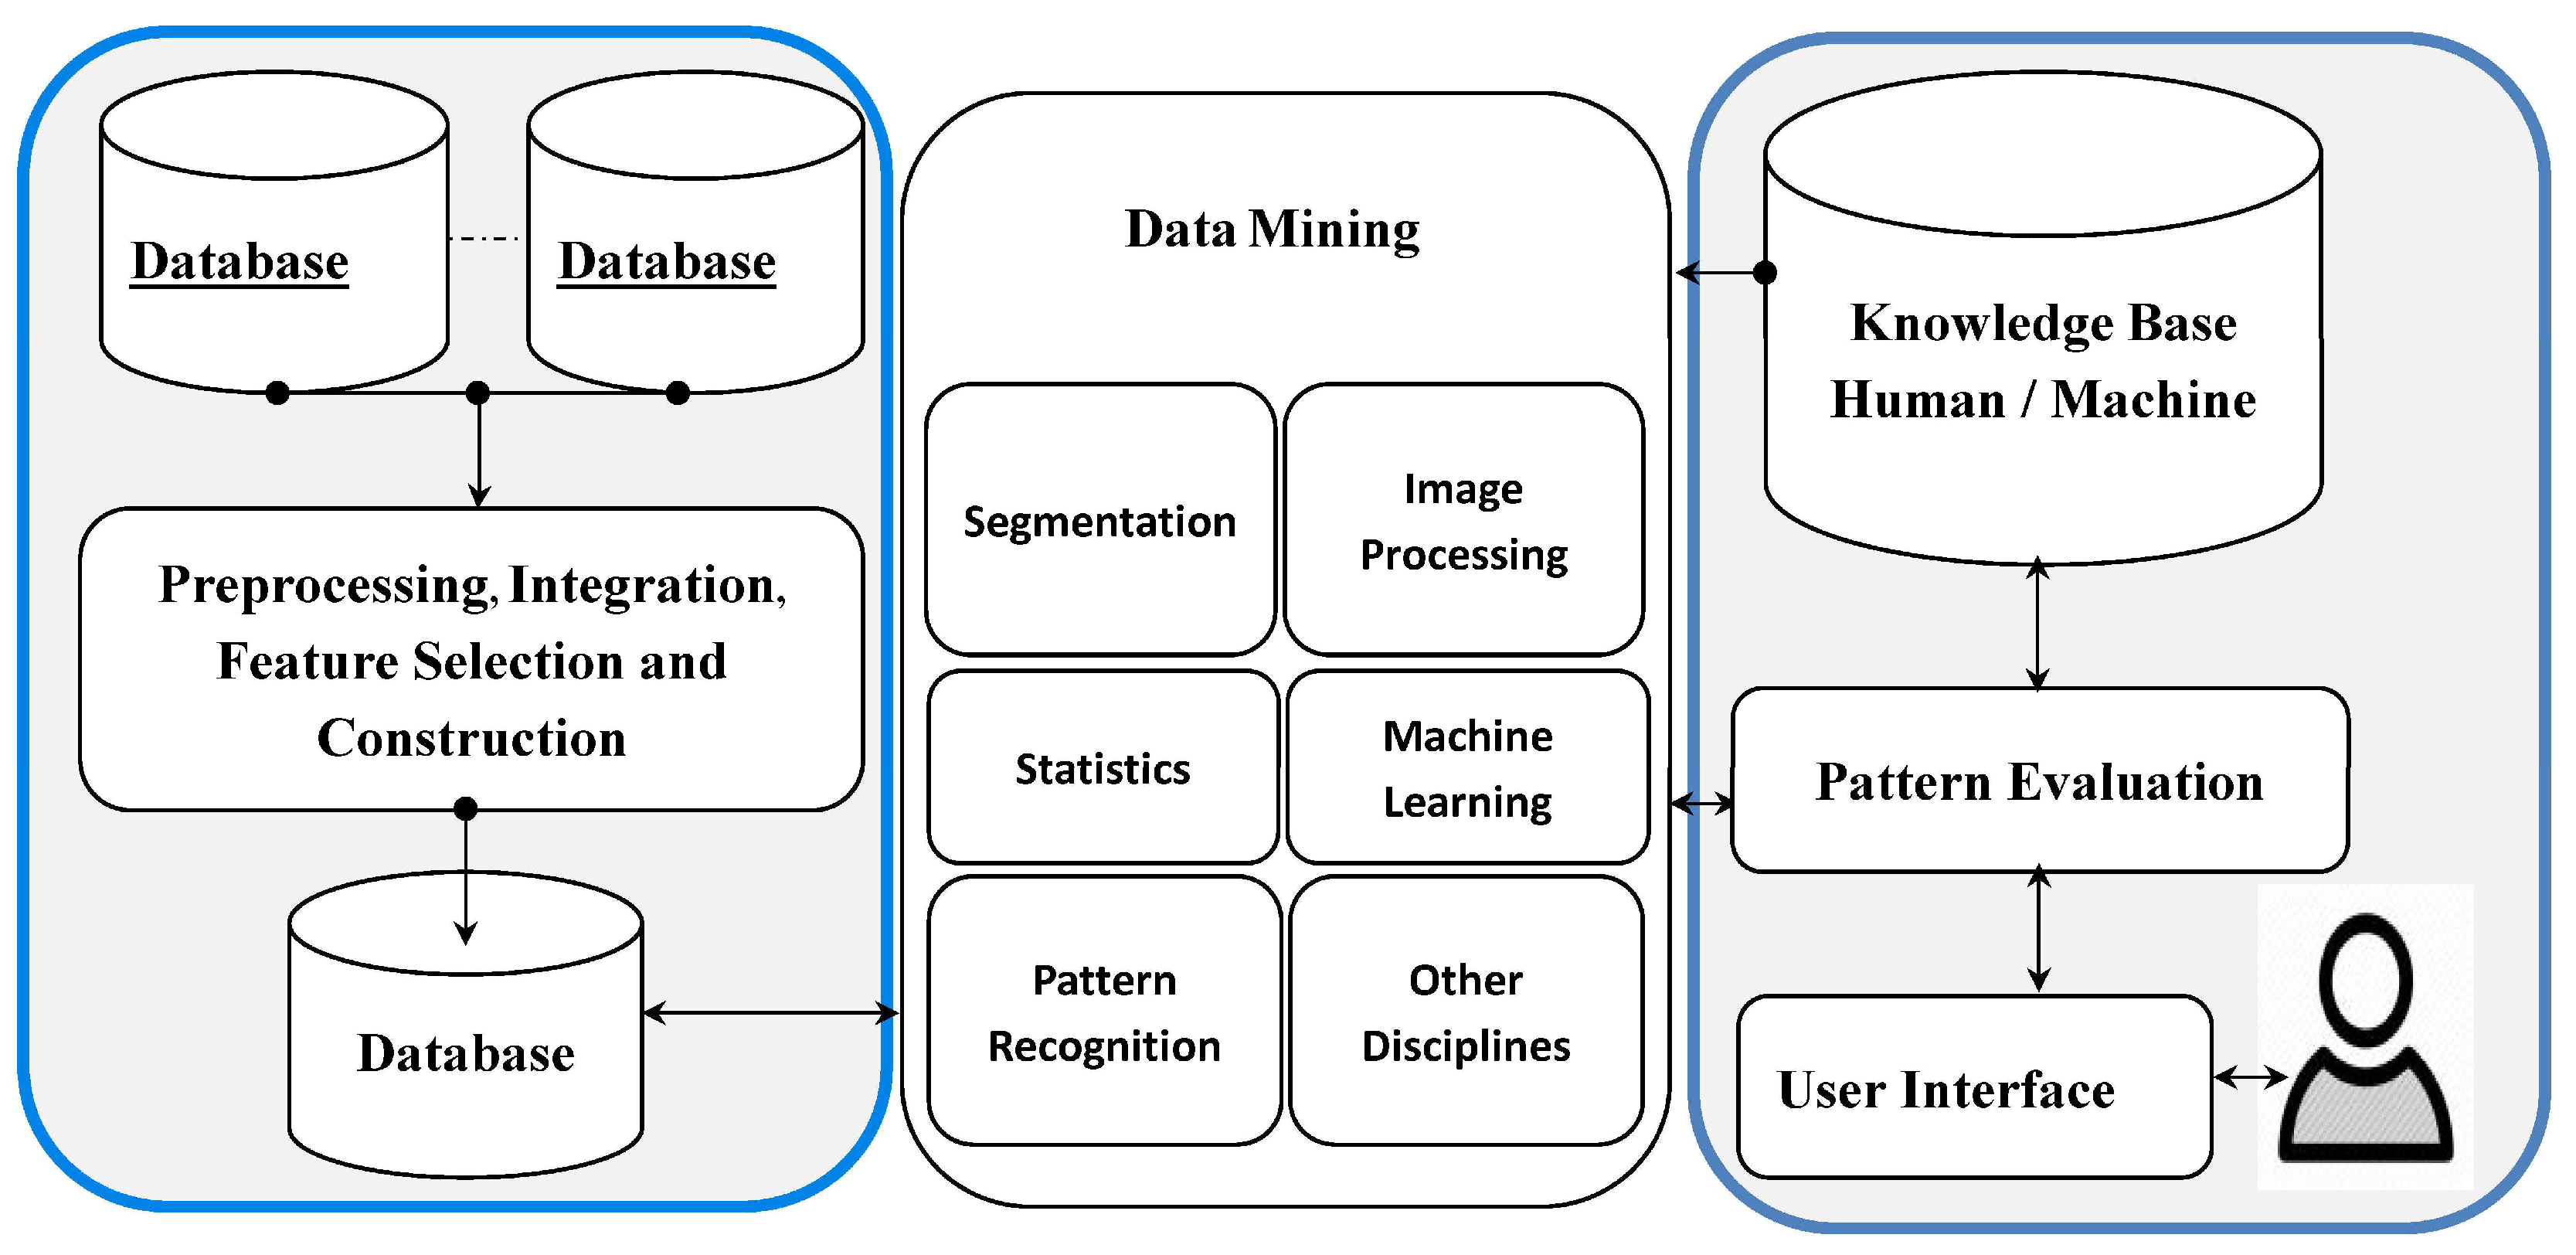
6.6.1. Data Mining, Machine Learning, Artifizielle Intelligenz

The increasing availability of open data repositories combined with constantly growing data acquisition rates urges the need to develop learning agents in the form of computer programs. Such agents can potentially speed up the pre-processing of data as well as improve the complexity and objectivity of data analyses. Pre-processing may include different aspects to be considered prior to mining a database for particular FH issues, e.g., the identification of hidden (yet unknown) links between stressors and the functioning of forest ecosystems. It starts with appraising the general suitability of data found in remote open databases prior to any further processing step, e.g., transferring the data to the local work environment and storing them there for further processing. This matches directly with the availability of suitable and non-purpose specific metadata to be used by remote data retrieval agents in order to judge the usefulness of available data. Pre-processing also comprises the necessity of identifying the presence of undesired data disturbances, e.g., due to anthropogenic impacts on ecosystems (installations), or acquisition system malfunctions prior to deriving filtered and/or transformed attributes from the data that are considered more useful for further analyses than the actual measured data.
In the sense of a knowledge discovery in the database’s framework, the pre-processed database may then be mined by learning agents for particular issues that are necessary to address FH. The selection of an algorithmic machine generally depends on the question of interest. However, if the pre-processed databases are in some sense harmonized so that the different sets of information can be labeled according to distinct data families, e.g., technically acquired data with physically defined resolution or subjective insights with unquantifiable trustworthiness etc., then data mining algorithms for a distinct task can be developed in a generalized manner to ensure performance, even if specifically available information may contain varying attributes for different times or locations.
Traditionally, the pre-processing and mining of the available database was carried out by trained human experts, and was based on their experience and insight into the response of distinct ecosystems and experimental setups. However, human abilities to gain an overview of complex databases in a short time are generally limited, and underlie an undesired learning bias. Here, learning agents may improve the breadth of data analyses, as well as the complexity level of explored and recognized inter-data relations (see Figure 12).

6.6.2. Handling Petabyte-Scale RS Data with Cloud and Web Services

The opening of the Landsat archives in 2008 [185] led to an explosive use of RS data in frorest monitoring [131], different science, economics, and application [12]. NASA (https://data.nasa.gov/), the US Geological Survey, NOAA [183], as well as the European Commission with its Copernicus regulation (http://data.europa.eufollowed suit and opened petabyte-scale archives for freely available RS data from MODIS to Aster, Landsat 4–8, Sentinel, as well as numerous other sensors and geo-data.
To overcome the challenges presented by the petabyte-scale geo-data archives, the development of open-source program libraries was accelerated such as TerraLib, as was the use of Internet computing power by Hadoop and tools such as GeoSpark as well as GeoMesa, which enable a diverse and fast processing of big geo-data [221]. At the same time, super computers and high performance computer systems were also promoted [222], as was the new generation of quantum computers [223]. In addition to this, cloud-computing started to become the norm in data science [224].
Furthermore, for a better handling of big geo-data, Google developed the Google Earth Engine (GEE) [221]. GEE is an integrated cloud-based platform in the petabyte-scale geo-data sets that can be recorded, edited, and analyzed in JavaScript and Python application programs. What is more, GEE enables direct access to all functions of GEE, without having to set up and authorize other services. GEE uses the extensive cloud-computing infrastructure from Google, whereby the resulting computing performance of GEE outperforms all high-end desktop workstations, enabling researchers, companies, and stakeholders to calculate GIS operations with big RS data, without exuberant funding or the use of super computers, but with the use of only the “simple” Internet connection that is needed for GEE. There are already numerous RS applications in which GEE has been used, such as a 30-m classification of cropland in continental Africa [225], using RS data heritage in a petabyte-scale [226], or for mapping woody vegetation [227]. GEE is also being increasingly used for geo-data analyses in portals for environmental research such as the free open-source solutions for environmental monitoring portal for forest health “openforis” (http://www.openforis.org/). By setting up platforms such as Copernicus Data Information and Access Service (DIAS), the European Commission is also trying to advance the possibilities for the high-performance evaluation of large amounts of data in the cloud http://copernicus.eu/news/upcoming-copernicus-data-and-information-access-services-dias.
If applications of processing, analysis, or standardization of various data formats are not integrated into platforms such as GEE, then web services will usually provide the opportunity of combining available systems and services cross-platform with one another, and making them available in their own applications and services. Threfore, web services enable an effective data and information exchange between heterogeneous applications. In the context of geo-data analysis, a wide range of various web services are already available, such as those provided by the Open Geospatial Consortium. There are also several other web-based systems that provide tools to search, order, and download RS data; these include the USGS Earth Explorer [228] for data analysis, the National Climatic Data Center—NCDC Climate WebGIS (http://www.climate.gov/#dataServices), the NASA Giovanni [229] or the Eearth Observation Data Service (http://www.earthserver.eu/services/eods) for the RS community, the PlanetServer for the Planetary science community [230], and single web services and free software solutions for automatically generated 3D point clouds for UAVs [231]. Eberle et al. [232] demonstrated how different web services can be embedded to generate a geo-data toolbox for monitoring forest in Siberia using RS data. Other novel developments of geospatial web services are oriented toward a server-based on-demand access and processing of big Earth data [230]. These web services are suitable for monitoring platforms such as tablets for better managing forest health inventory data, where on-demand RS and geo-data are essential.
In addition to web services for geodata, freely accessible web services for biodiversity research have also been developed such as the “Biodiversity Virtual Laboratory” (BioVeL) [233] for collecting, organizing, sharing, data processing, data analysis, and modeling in biodiversity science and ecology. It has integrated more than 60 web services for collecting, analyzing, modeling, simulating, and predicting in situ monitoring data for biodiversity and science.
Web services have been implemented in numerous ways, and yet they still do not meet the high demands of the Semantic Web and data science of tomorrow to provide services for semantic-linked data, models, or platforms. For this reason, Semantic Web Services (SWS) have been developed, which beyond their purely syntactic interface description, can execute functions such as the location, selection, execution, and analysis of data with semantic content and links [234]. It is here that techniques of the semantic web are employed such as the Web Ontology Language for web services (OWL-S) [235]. To make the technical functionality of a service semantically available, an additional ontology is essential, as well as the respective specialist domain i.e., the ontology for forest inventory and mensuration [211] (see chapter Ontologization). Sudmann et al. [236] demonstrated how semantic web approaches have been successful in the online processing of big RS data.

6.7. Easy-to-Handle Environmental Assessment and Decision-Making Support Systems

For environmental assessment and decision-making in the context of forest health, numerous analyses and assessments have to be carried out such as suitability analyses for sites and new plantations, or investigations on the effects of climate change, deforestation, or forest management plans for future forest developments. At the same time, the complexity and the extent of data analyses is growing rapidly in forestry, biodiversity, ecology, or remote sensing. It is becoming more and more commonplace to carry out complex analyses and assessments by using hundreds of data files with different structures and data types e.g., genetic, species and communities, from the local to the global scale, and at different points in time in combination with numerous algorithms, as well as visualize the results in innovative ways [233].
Kiker et al. [237] argued that decision-making in the context of the common use of resources and the understanding of existing environmental issues is tremendously complex and evidently unsolvable due to the inherent compromises between ecological, socio-political, and economic factors. The science-policy platform for biodiversity and ecosystem services (IPBES) therefore calls for a progressive development of tools for environmental assessment and decision-making for analysis, modeling, simulation, and prediction to gain a better understanding of complex ecosystems [238].
Therefore, environmental assessment and decision-making systems should be tools that on the one hand meet the requirements of data science, while on the other hand are still open, easy, and simple enough to use so that they can serve as assessment and decision-making tools in particular for scientists, data managers, and stakeholders who are not from computer science backgrounds. Therefore, the following requirements should be imposed upon environmental assessment and decision-making support systems:
  • Environmental assessment and decision-making must meet the requirements of data science. In particular, this means handling big data with high volume, velocity, variety, and veracity, and to integrate open data.
  • Tools must enable extensive algorithms for data mining and machine learning.
  • Systems must contain interfaces to the Semantic Web, thus enabling the analysis of semantically linked heterogeneous information via linked open data.
  • Systems must allow for the assessment of uncertainties of in situ monitoring, RS data, and data science in the assessment and the resulting decision.
  • Data science analyses should be possible with a simple coupling and management with other systems such as Haadop®, databanks, Web Services, Semantic Web Services, or cloud computing, as well as the use of the Google Earth Engine.
  • Systems should be implementable on simple computers that are only available for authorities, users, and decision-makers.
The very first data science and Semantic Web-oriented environmental assessment and decision-making support systems can be found in Jelokhani-Niaraki et al. [239]. These systems fulfill the first requirements such as data science and Semantic Web integration. In addition to the developments already mentioned, there are also other scientific workflow systems such as Kepler [240], Pegasus [241], KNIME [242], RapidMiner [243], Apache Taverna [244,245], VisTrails [246], or Galaxy [247]. These are successful technologies for easy, applicable, and feasible analysis and decision-making support systems for scientists, forest managers, or stakeholders [233]. Such tools must form the basis of an easy-to-handle environmental assessment and decision-making support system for scientists, data managers, and stakeholders in a future MUSO-FH-MN.

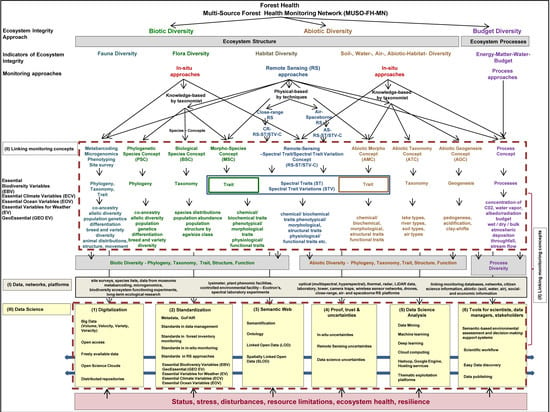
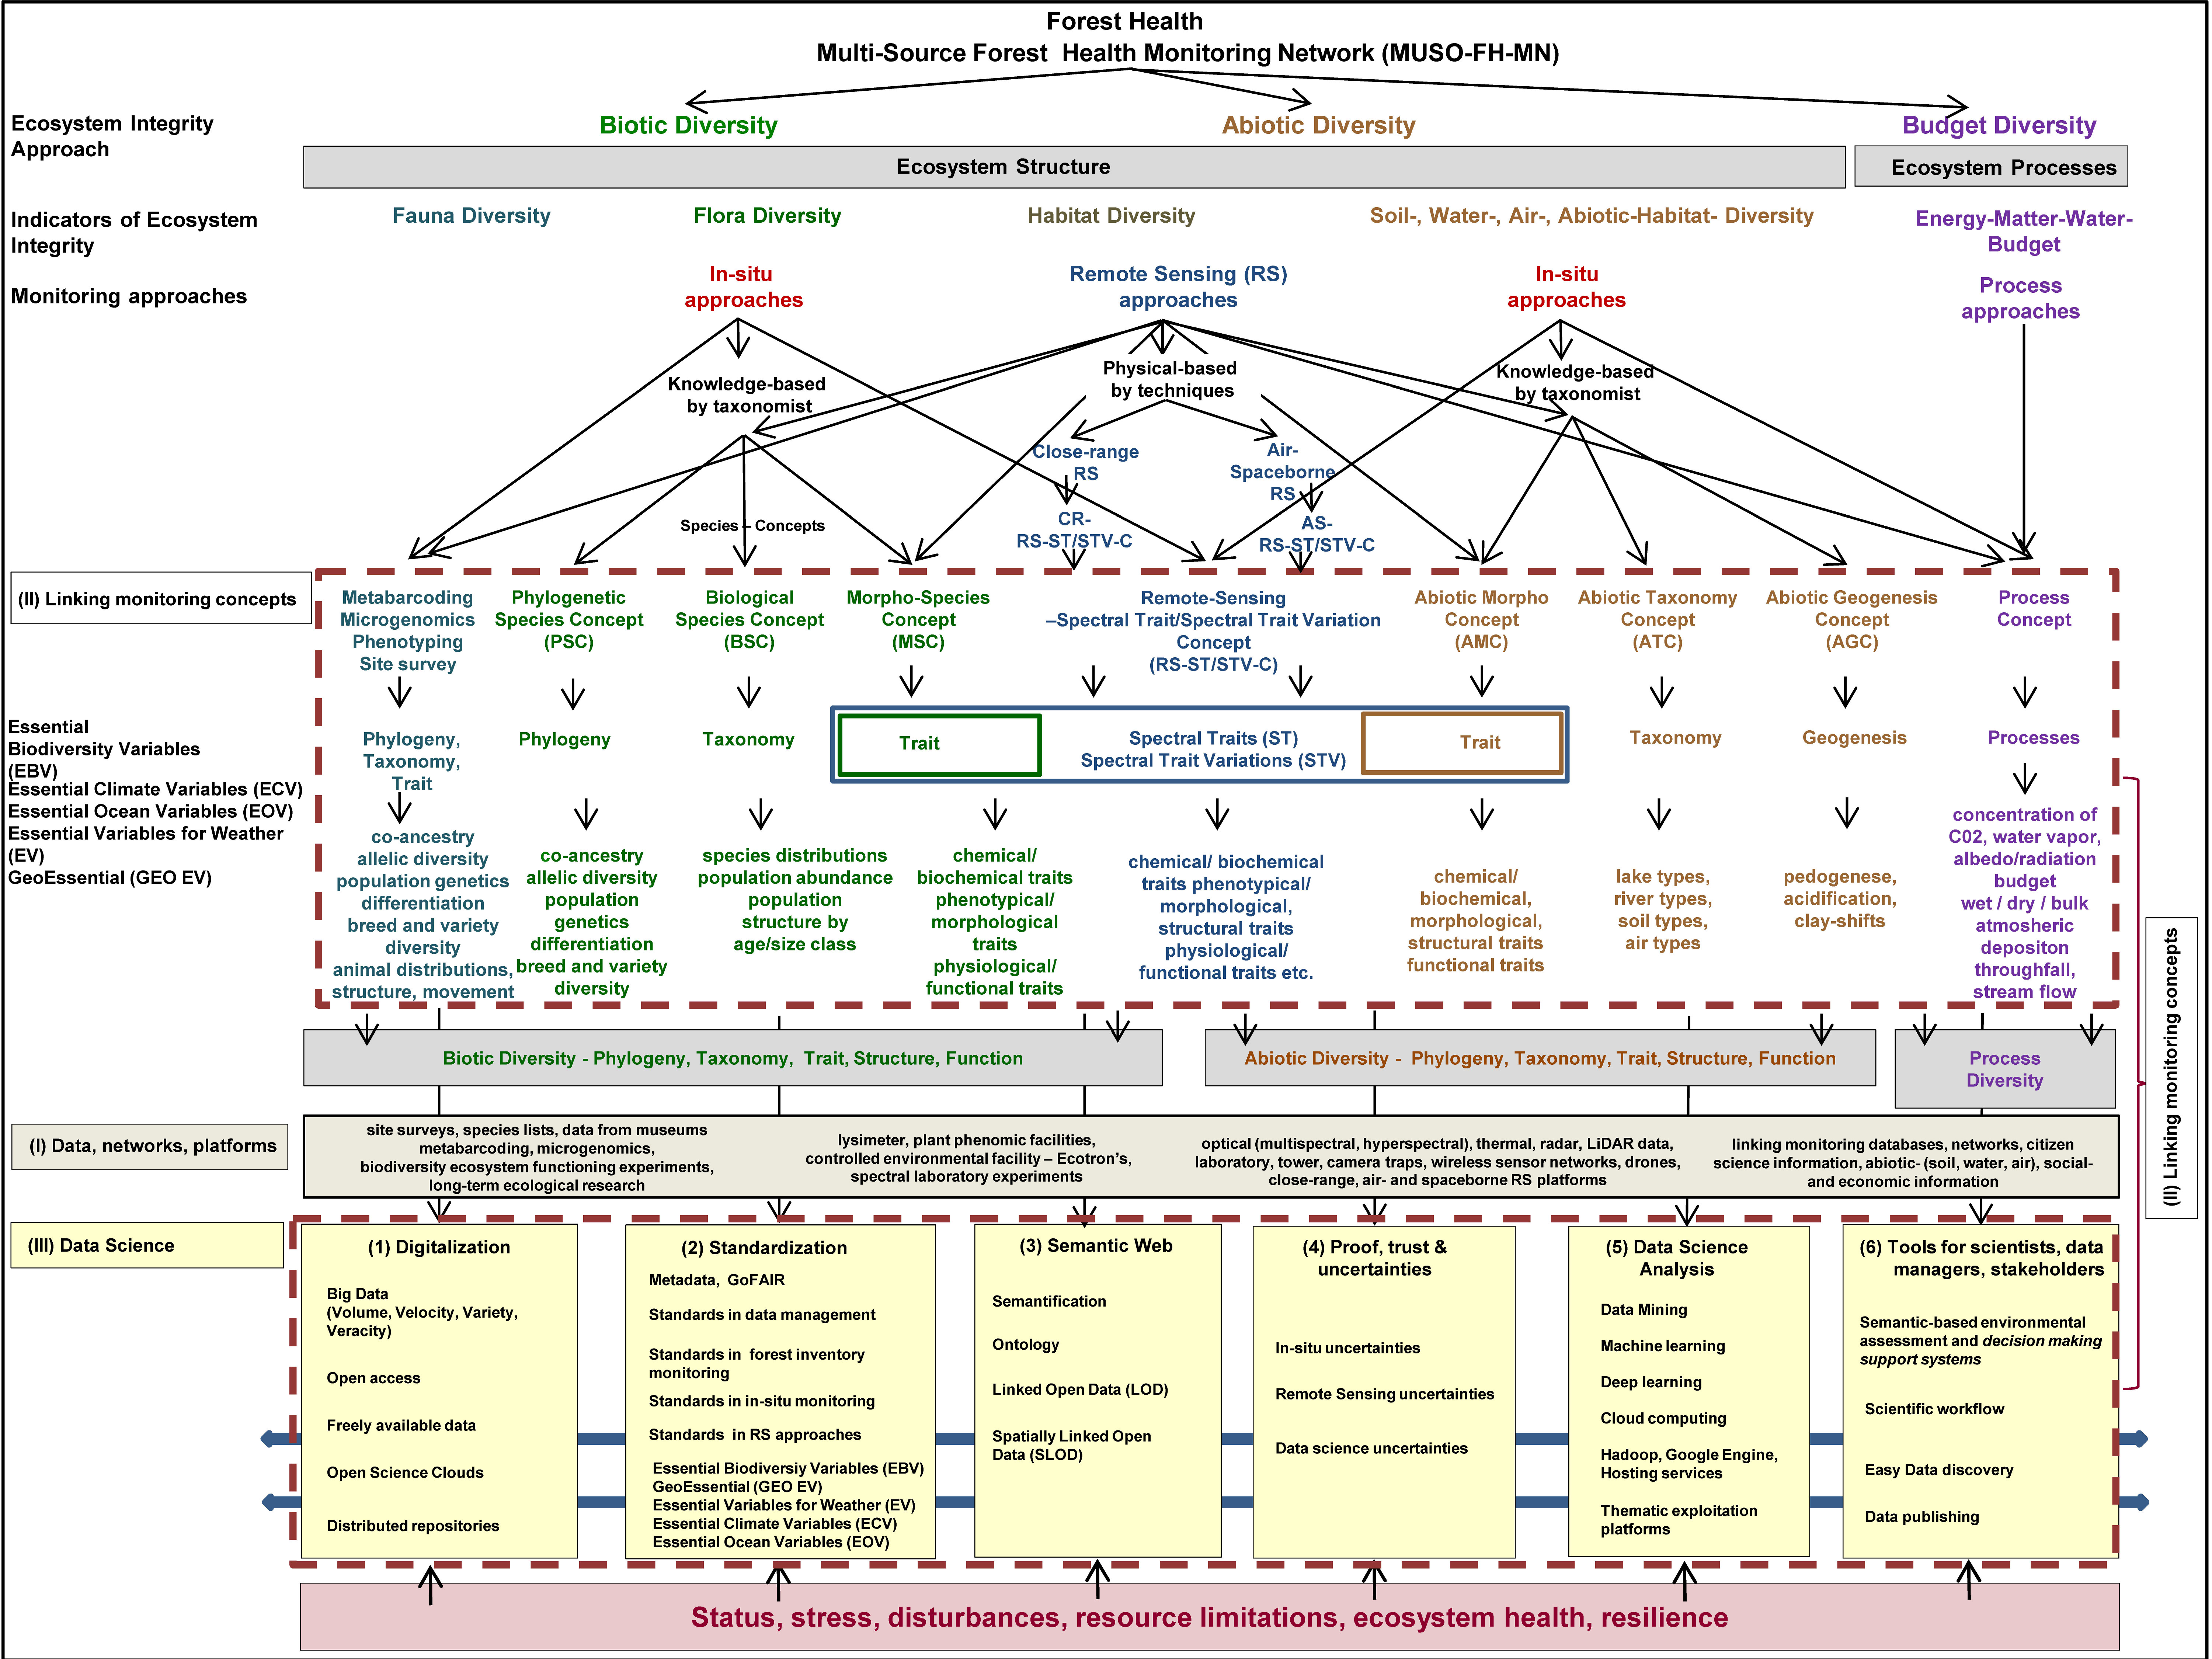
7. Requirements for a Future Multi-Source Forest Health Monitoring Network (MUSO-FH-MN)

Statement: 
At present, there is no multi-source forest health monitoring network that meets the requirements of data science, and thus the future requirements for data monitoring, management, linkage and the assessment of FH data in the 21st century.
The requirements mentioned in this paper show that so far, no monitoring approach, technique, model, or platform exists that is sufficient on its own to monitor, model, forecast, or assess forest health and its resilience. The increasing digitalization, the handling of petabytes for FH monitoring, and the promotion of human–computer communications, not to mention the transformation of FH monitoring information and approaches to data science and Semantic Web technologies, will determine the receptiveness of the analysis and communication process to FH monitoring. To facilitate this process, the following criteria will be crucial for a future MUSO-FH-MN (see also Figure 13):
(I) Suitable Indicators of FH: FH indicators should be (a) indicators of status, stress, disturbances, and resource limitations that are (b) recordable on different levels of biological organization of the forest ecosystem; (c) standardizable; (d) ascertainable for different in situ monitoring approaches as well as RS approaches on different platforms; and (e) transferable to digital form through a human–computer communication interpreting language, and therefore meet the requirements of data science and the Semantic Web.
(II) Integration of existing data, networks, and platforms: These have to be integrated into the MUSO-FH-MN, and should be able to be coupled with each other to enable a comprehensive assessment of FH that includes various drivers. The MUSO-VH-MN should integrate the following data and site survey platforms for animal and plant species and forest habitats: data of site surveys for species, species lists, species data of meta-barcoding, microgenomics, lysimeters, plant phenomics facilities [78], controlled environmental facility—Ecotron’s [81], spectral laboratory experiments, biodiversity ecosystem functioning experiments [10], and long-term ecological research [98]. In terms of remote sensing data, the following should be integrated: optical (multispectral, hyperspectral), thermal, radar, LiDAR data, laboratory data, tower, camera traps, wireless sensor networks, drones, close-range, airborne and spaceborne RS platforms, existing databases, networks, citizen science information, and abiotic (soil, water, air), as well as socio-economic information.
(III) Linkage of different FH monitoring approaches: Future site-based long-term research and monitoring concepts will require the coupling of different approaches, which are: (1) for forest monitoring—the forest inventory approaches; (2) for vegetation monitoring beyond forest inventory monitoring—the phylogenetic species concept, the biological species concept, the morphological species concept, [58], and the concept of phenotyping [162]; (3) for abiotic and process monitoring—the concept of ecological integrity [33] and (4) for remote sensing—the Spectral Trait/Spectral Trait Variation Concept (RS-ST/STV-C), [25]. The coupling should be done with the help of techniques from data science.
(IV) Data science as a bridge: When it comes to developing a MUSO-FH-MN, it is not surprising that big FH data with enormous complexity and syntactic and semantic heterogeneity in data types and formats require new solutions to fulfill the requirements of the 21st century for monitoring, analysis, prognosis, and the assessment of FH. Therefore, data science bridges the gaps in managing these problems. The following elements of data science are crucial in this respect: (1) digitalization; (2) standardization; (3) the Semantic Web; (4) Data science analysis; (5) proof, trust, and uncertainties, and (6) easy-to-handle but data science-based environmental assessment and decision-making support systems for scientists, data managers, and stakeholders. The respective elements of the six groups of data science are complementary, and not always clearly attributable. Nevertheless, data science for a future MUSO-FH-MN can be described in detail by the following criteria (see Figure 13):
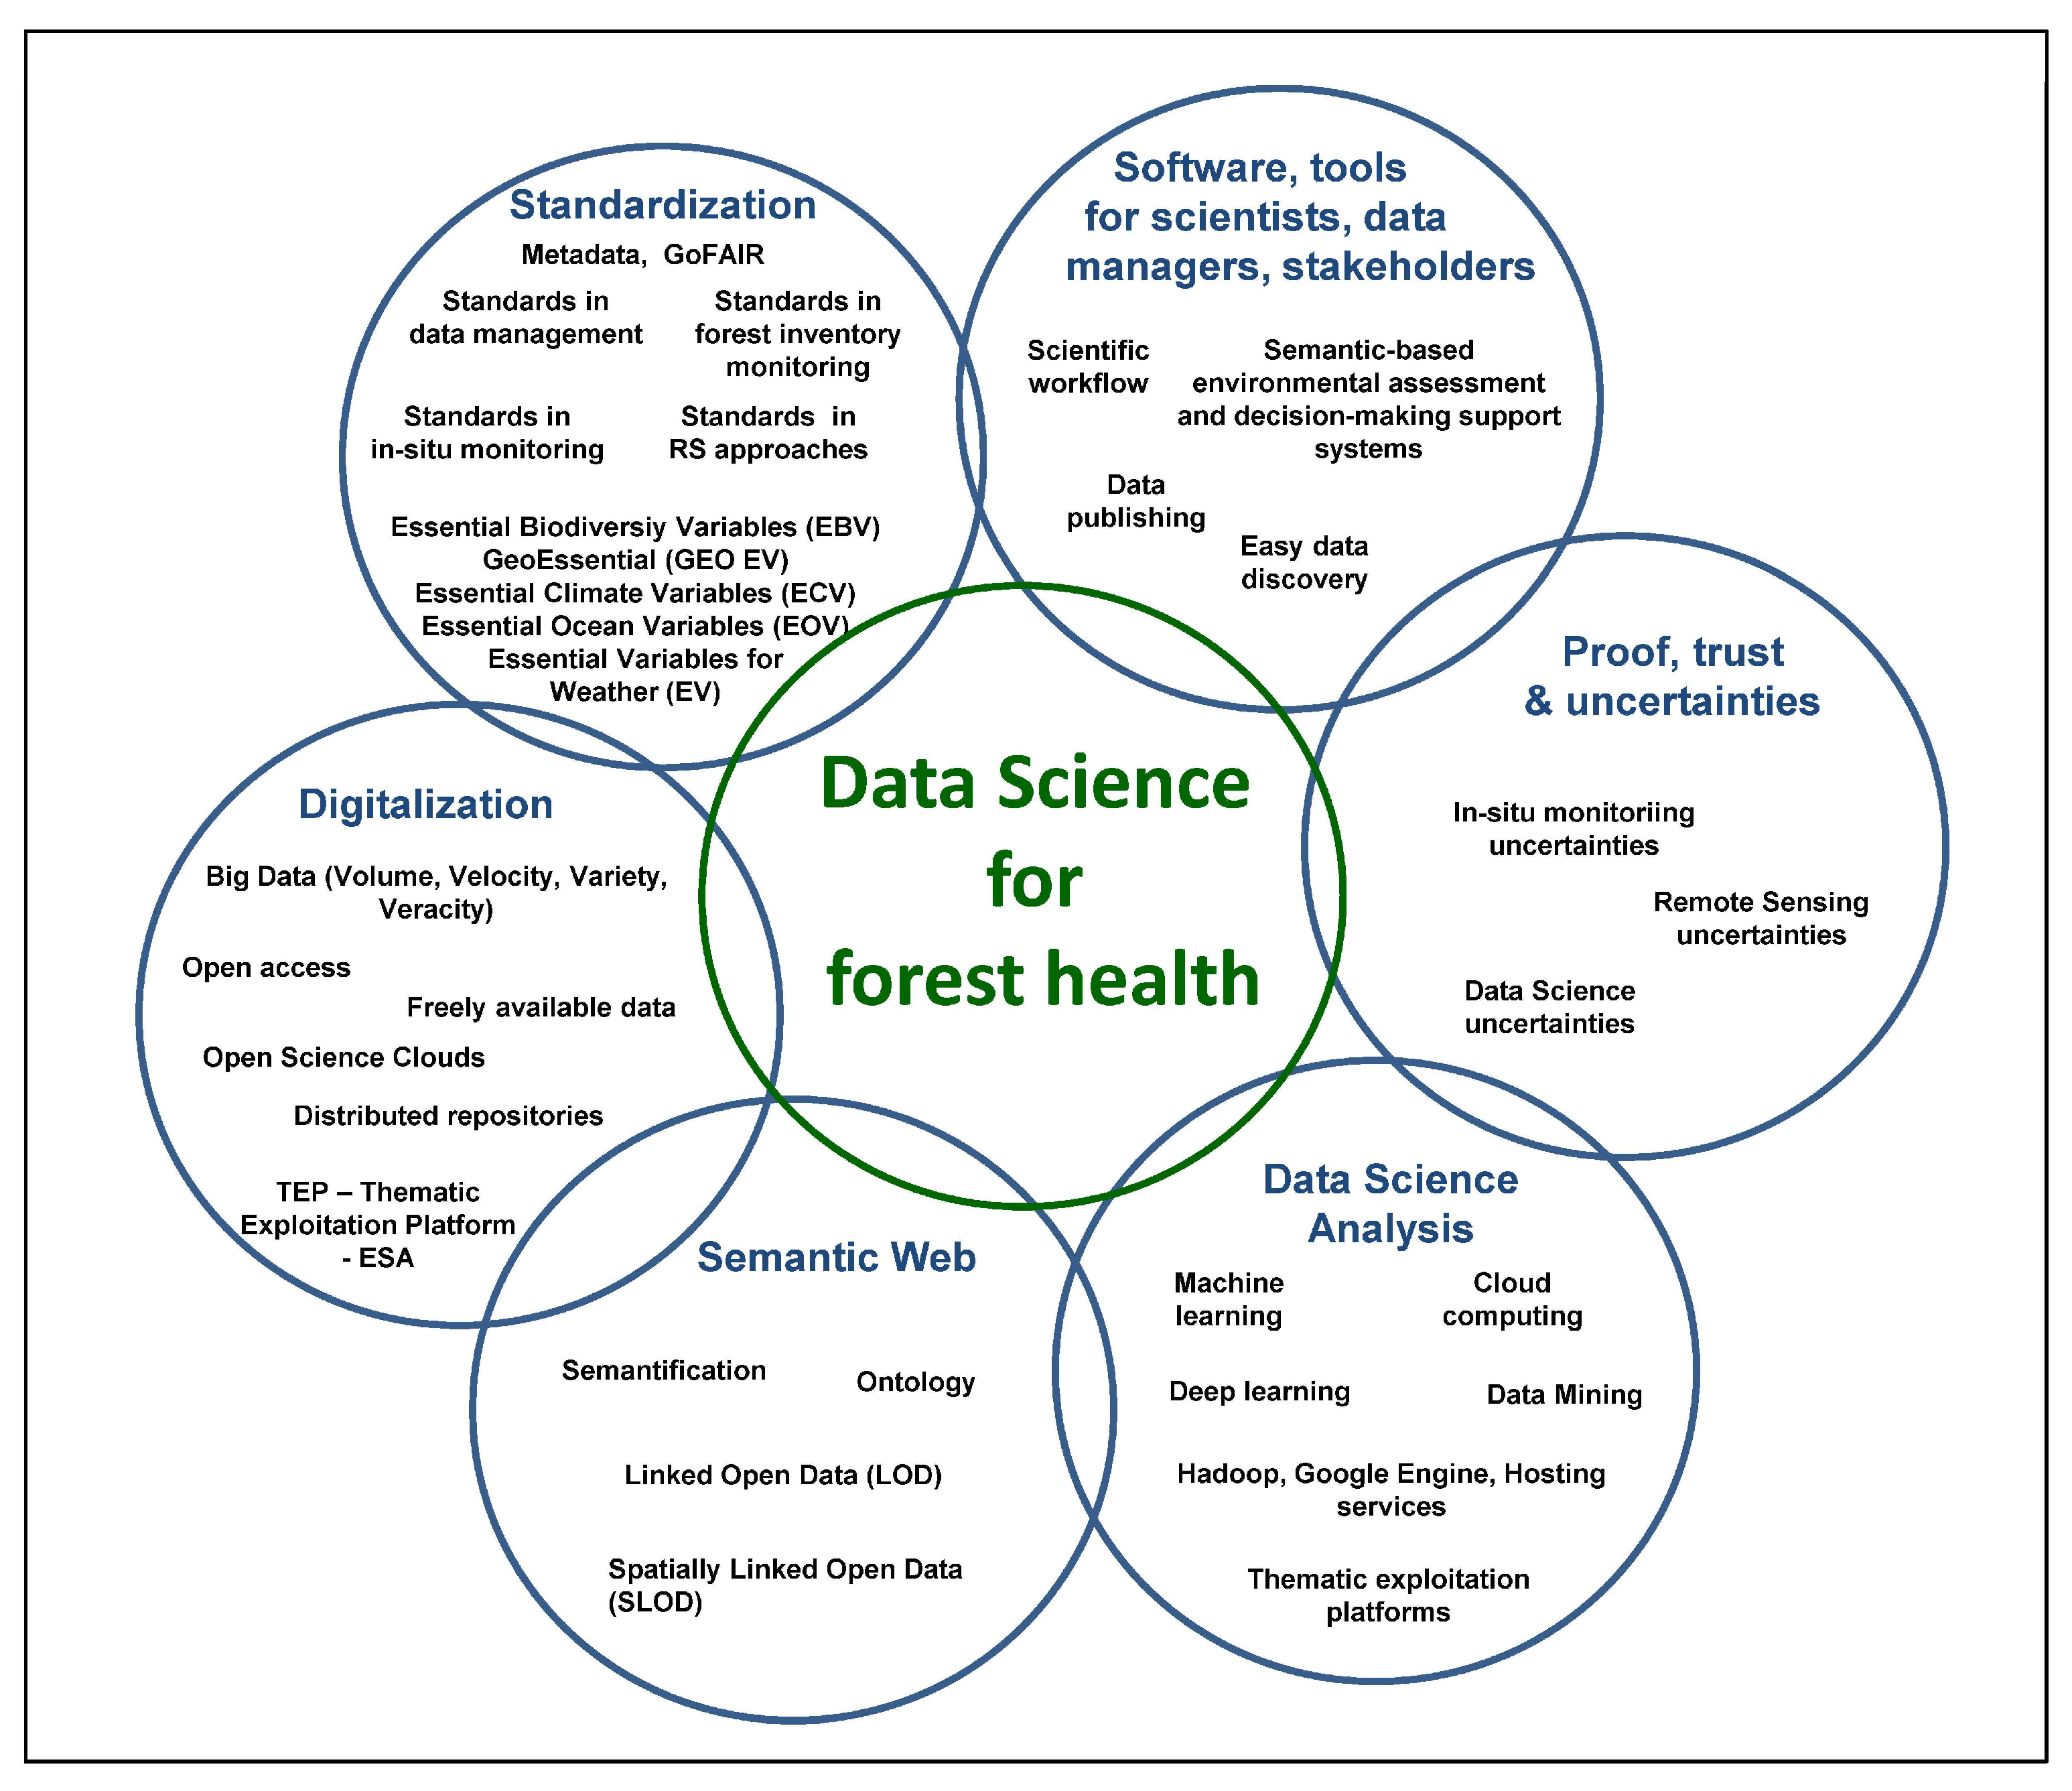
  • Digitalization: The digitalization of FH data and information will determine the receptiveness of the forest analysis process in the future MUSO-FH-MN. Crucial criteria and elements of the digitalization process are: not all elements can be digitally monitored in the digitalization process, and consequently, one must differentiate between human-driven monitoring and digital-driven monitoring elements. Furthermore, the following aspects are all important to foster the digitalization process: open access to tools, software, algorithms, instruments, or platforms, freely available data, free policy for species and RS and geodata [55], abiotic, socio-economic and other geo-data, the development and use of Open Science Clouds [175], Thematic Exploitation Platforms, the handling of big FH data with high volume, velocity, variety and veracity, as well as the management of distributed repositories.
  • Standardization: FH data, information, indicators, data management, various FH monitoring approaches, tools, algorithms, and models all have to be standardized, administered, stored, processed, updated, as well as linked and evaluated with other platforms and networks. The basic standardization and the basic elements of data science are effective metadata management based on the principles of FAIR with the four criteria of Findability, Accessibility, Interoperability, and Reusability of metadata [191]. Standards in data management, standards in forest inventory monitoring, in situ monitoring beyond forest inventory monitoring for animals and plant species, as well as standards in RS approaches are crucial elements in data science. Furthermore, it is imperative to implement and integrate various existing concepts of essential variables such as the Essential Climate Variables (ECV) [194], the Essential Variables for Weather—EVW [195], the Essential Ocean Variables—EOV [193], the Essential Biodiversity Variables (EBV) [192], in order to develop the Essential GeoVariables—GEV GeoEssential (http://www.geoessential.net/), as well as develop the essential variables for domains such as agriculture, soils, catastrophes, ecosystems, health, and urban development.
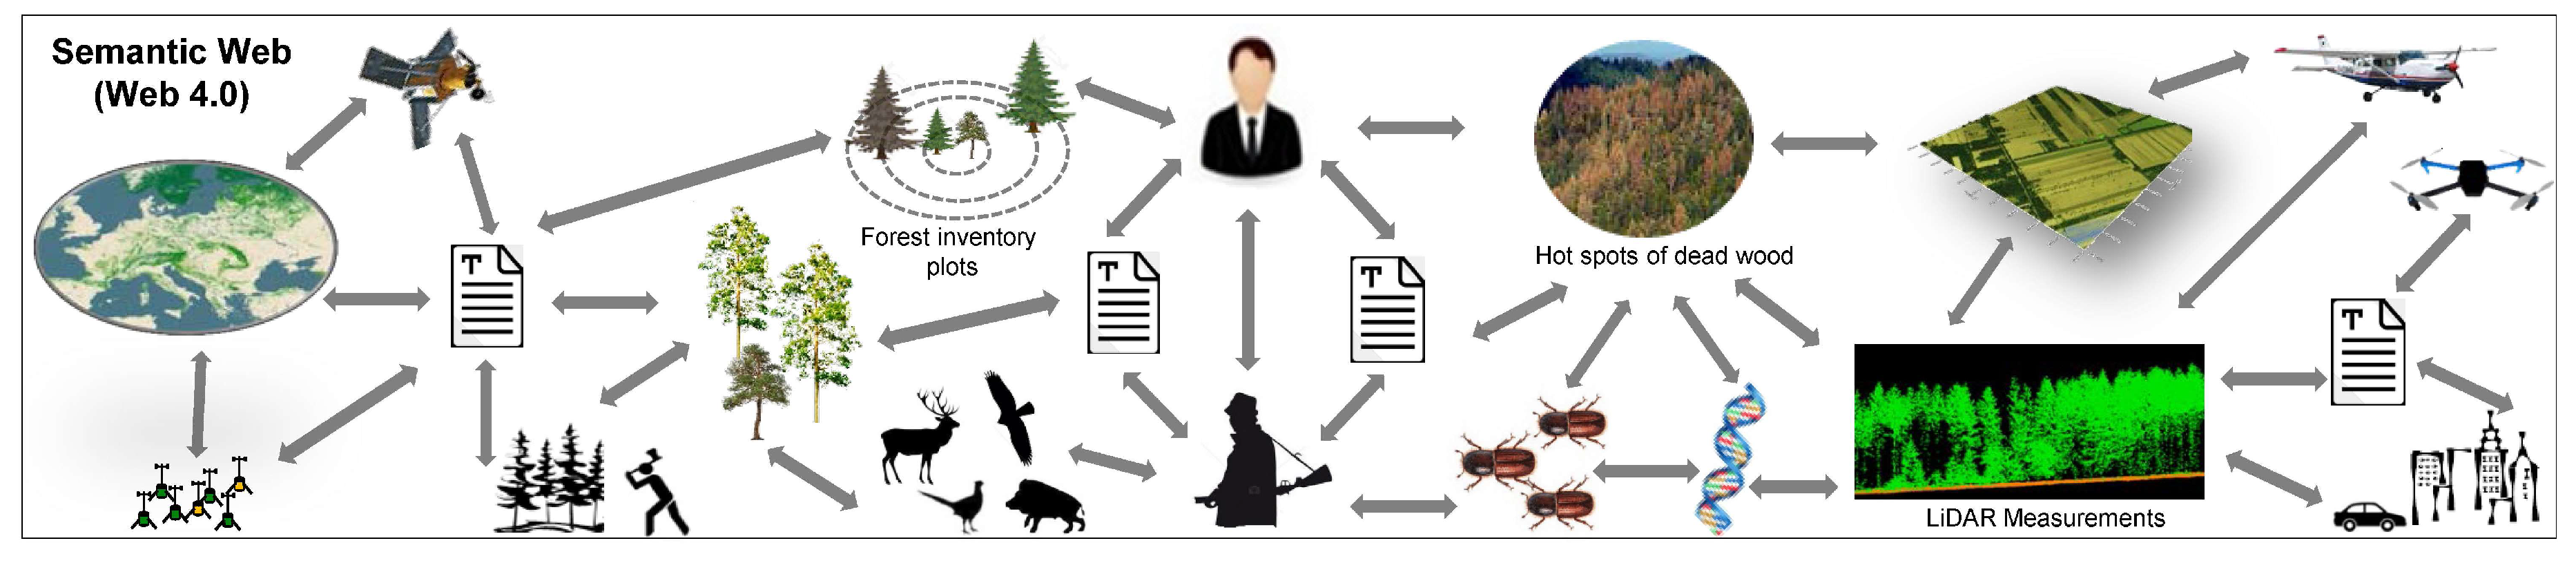
  • Semantic Web: The linking of complex, heterogeneous, and multidimensional FH information, indicators, data, Internet of FH Things (IOT), information, monitoring approaches, tools, different scales, RS platforms, and models as well as assessment and decision-making support systems for scientists, data managers, and stakeholders in a semantic-enabling way according to the standards of the World Wide Web Consortium [205] is an important step to cope with the human–computer communication process and couple complex FH data, information, models and platforms. Important elements of the semantic web are: semantification, ontologization [206], Linked Open Data approaches [248] and Spatially Linked Open Data approaches [189].
  • Proof, Trust, and Uncertainties: Unlike many other research areas, most approaches, data, information or models used in data science involve a certain level of uncertainty i.e., uncertainties in forestry inventory monitoring information, in situ uncertainties, RS uncertainties, and data science uncertainties.
  • Data Science Analysis: The digitalization of the world and forest ecosystem components requires handling Big Data along with its four aspects: volume, velocity, variety, and veracity. Consequently, data science analysis requires methods of data mining, machine learning, deep learning, tools, systems, or platforms such as Hadoop, Google Engine, Hosting services, Semantic Web Services, cloud computing, as well as Thematic Exploitation Platforms. Here, deep learning is central to identifying, processing, and analyzing patterns in automation and new innovations of FH analysis and assessment.
  • Tools for scientists, data managers, and stakeholders: Crucial elements for a data-driven, fast, objective, applicable, and implementable decision-making support system for forest managers, stakeholders, and politicians are: open, easy handling and data science-based environmental assessment and decision-making support systems, comprehendible and easy-to-operate scientific workflows, and easy and up-to-date data publishing tools.

8. Conclusions

Stress, disturbances, and reduced resilience in forest ecosystems are constantly increasing. Causes, drivers, and responses of FH are often complex, multidimensional, multi-scale, and non-linear. However, forest managers, decision makers, and policy need to be able to make decisions that are data-driven and based on short and long-term monitoring. There is a great need to objectively assess the state, changes, and resilience of FH as a basis for the successful management of forest conversions and the stabilization of damaged forest ecosystems.
Previous FH monitoring approaches and initiatives for monitoring, as well as the standardization and digitalization of FH are good examples on which other monitoring strategies can be modeled. At the same time, the use and integration of numerous freely available RS data in FH are advancing at an unprecedented rate.
The goal of the paper was not to refine existing in situ and RS-based FH monitoring approaches, but rather to discuss which requirements are essential to bridge the gaps in linkage, information, data, models, and tools that are needed to fulfill the impending requirements of the 21st century for monitoring, data management, analysis, prognosis, and the assessment of FH. Five sets of requirements were discussed in detail, as was their relevance, necessity, and possible solutions that would be necessary for establishing a future MUSO-FH-MN that fulfills the requirements of the 21st century in ecology and information processing. Namely, these requirements include: (1) understanding the effects of multiple stressors on forest health; (2) using RS approaches to monitor forest health; (3) coupling different monitoring approaches; as well as (4) using data science as a bridge between complex and multidimensional big FH data; and (5) a future multi-source forest health monitoring network. We particularly elaborated on the requirements of data science, since this approach is regarded as expedient for a future MUSO-FH-MN.
No existing monitoring approach, technique, model, or platform is sufficient on its own to monitor, model, forecast, or assess forest health and its resilience. Therefore, to set up a future MUSO-FH-MN, the following main elements should be considered: (I) the selection and monitoring of suitable indicators of FH; (ii) the integration of existing data, networks and platforms; (iii) the linkage of different FH monitoring approaches to monitor indicators of FH, as well as (iii) using data science as a bridge for handling and coupling the volume, velocity, variety, and veracity of big forest health data.
There exist first very good environmental research infrastructures (RIs) for the implementation of data science and existing forest health networks for assembly a MUSO-FH-MN called ENVRIplus (http://www.envriplus.eu/). ENVRIplus bringing together environmental and earth system research infrastructures, research networks and projects together to create a more coherent, interdisciplinary, standardizied and interoperable cluster of environmental research infrastructures across europe [249].
We are living in a time of “ecological impoverishment”, but also one with novel and feasible ideas. However, we are also experiencing a time of “technical puberty” for human–machine interactions. On the one hand, we are disciplinary-focused, but on the other hand, we are still seeking re-orientation, and are aware that biodiversity and forest health require a holistic and interdisciplinary approach in measurement, coupling, modeling, prediction, and assessment. Holistic, complex, and multidisciplinary systems require the development, implementation, and application of novel concepts, methods, and tools that sometimes still appear to us as unrealistic and not very feasible, but still enable a new path to better understand our complex world.

Author Contributions

A.L. was responsible for the main part of this review analysis, writing and production of the figures. H.P. (Hendrik Paasche) contributed his knowledge about extensive methodology of machine learning. H.P. (Heiko Paulheim) integrated important features of linked data, semantic web and data science approaches. S.K. made an extensive review of the paper. All co-authors revised all requirements, checked and contributed to the final text, tables and figures.

Funding

This research received no external funding.

Acknowledgments

We particularly thank the researchers for the Hyperspectral Equipment of the Helmholtz Centre for Environmental Research—UFZ and TERENO funded by the Helmholtz Association and the Federal Ministry of Education and Research. At the same time we truly appreciate the support that we received from the project “GEOEssential—Essential Variables workflows for resource efficiency and environmental management”. The authors also thank the reviewers for their very valuable comments and recommendations. The contribution of M.E.S. is supported by the University of Zurich Research Priority Program on Global Change and Biodiversity (URPP GCB). The contribution of A.J. was supported by the János Bolyai Research Scholarship of the Hungarian Academy of Sciences

Conflicts of Interest

The authors declare no conflicts of interest.

References

  1. Lausch, A.; Erasmi, S.; King, D.J.; Magdon, P.; Heurich, M. Understanding forest health by remote sensing—Part II—A review of approaches and data models. Remote Sens. 2017, 9, 129. [Google Scholar] [CrossRef]
  2. Trumbore, S.; Brando, P.; Hartmann, H. Forest health and global change. Science 2015, 349, 814–818. [Google Scholar] [CrossRef] [PubMed]
  3. Guerra, C.; Navarro, L.M.; Kissling, W.D.; London, M.C.; Turak, E.; Balvanera, P.; Costello, M.J.; Delavaud, A.; El Serafy, G.Y.; Ferrier, S.; et al. Monitoring biodiversity change through effective global coordination. Curr. Opin. Environ. Sustain. 2017, 29, 158–169. [Google Scholar]
  4. Krug, C.B.; Schaepman, M.E.; Shannon, L.J.; Cavender-bares, J.; Cheung, W.; Mcintyre, P.B.; Metzger, J.P.; Obura, D.O.; Schmid, B.; Strassburg, B.B.N.; et al. Observations, indicators and scenarios of biodiversity and ecosystem services change—A framework to support policy and decision-making. Curr. Opin. Environ. Sustain. 2017, 29, 198–206. [Google Scholar] [CrossRef]
  5. Tomppo, E.O.; Schadauer, K. Harmonization of National Forest Inventories in Europe: Advances under COST Action E43. For. Sci. 2012, 58, 191–200. [Google Scholar] [CrossRef]
  6. Tomppo, E.; Gschwantner, T.; Lawrence, M.; McRoberts, E.R. National Forest Inventories. Pathways for Common Reporting; Springer: Heidelberg, Germany; Dordrecht, The Netherlands; London, UK; New York, NY, USA, 2010. [Google Scholar]
  7. McRoberts, R.E.; Tomppo, E.O.; Schadauer, K.; Ståhl, G. Harmonizing national forest inventories. For. Sci. 2012, 58, 189–190. [Google Scholar] [CrossRef]
  8. Traub, B.; Meile, R.; Speich, S.; Rösler, E. The data storage and analysis system of the Swiss National Forest Inventory. Comput. Electron. Agric. 2017, 132, 97–107. [Google Scholar] [CrossRef]
  9. Henttonen, H.M.; Nöjd, P.; Mäkinen, H. Forest Ecology and Management Environment-induced growth changes in the Finnish forests during 1971–2010—An analysis based on National Forest Inventory. For. Ecol. Manag. 2017, 386, 22–36. [Google Scholar] [CrossRef]
  10. Bruelheide, H.; Nadrowski, K.; Assmann, T.; Bauhus, J.; Both, S.; Buscot, F.; Chen, X.Y.; Ding, B.; Durka, W.; Erfmeier, A.; et al. Designing forest biodiversity experiments: General considerations illustrated by a new large experiment in subtropical China. Methods Ecol. Evol. 2014, 5, 74–89. [Google Scholar] [CrossRef]
  11. White, J.C.; Coops, N.C.; Wulder, M.A.; Vastaranta, M.; Hilker, T.; Tompalski, P. Remote Sensing Technologies for Enhancing Forest Inventories: A Review. Can. J. Remote Sens. 2016, 8992, 1–23. [Google Scholar] [CrossRef]
  12. Wulder, M.A.; Masek, J.G.; Cohen, W.B.; Loveland, T.R.; Woodcock, C.E. Opening the archive: How free data has enabled the science and monitoring promise of Landsat. Remote Sens. Environ. 2012, 122, 2–10. [Google Scholar] [CrossRef]
  13. Wulder, M.A.; White, J.C.; Loveland, T.R.; Woodcock, C.E.; Belward, A.S.; Cohen, W.B.; Fosnight, E.A.; Shaw, J.; Masek, J.G.; Roy, D.P. The global Landsat archive: Status, consolidation, and direction. Remote Sens. Environ. 2016, 185, 271–283. [Google Scholar] [CrossRef]
  14. Turner, W.; Rondinini, C.; Pettorelli, N.; Mora, B.; Leidner, A.K.; Szantoi, Z.; Buchanan, G.; Dech, S.; Dwyer, J.; Herold, M.; et al. Free and open-access satellite data are key to biodiversity conservation. Biol. Conserv. 2015, 182, 173–176. [Google Scholar] [CrossRef]
  15. McRoberts, R.E.; Tomppo, E.O. Remote sensing support for national forest inventories. Remote Sens. Environ. 2007, 110, 412–419. [Google Scholar] [CrossRef]
  16. Massey, A.; Mandallaz, D.; Lanz, A. Integrating remote sensing and past inventory data under the new annual design of the Swiss National Forest Inventory using three-phase design-based regression estimation. Can. J. For. Res. 2014, 44, 1177–1186. [Google Scholar] [CrossRef]
  17. Immitzer, M.; Stepper, C.; Böck, S.; Straub, C.; Atzberger, C. Use of WorldView-2 stereo imagery and National Forest Inventory data for wall-to-wall mapping of growing stock. For. Ecol. Manag. 2016, 359, 232–246. [Google Scholar] [CrossRef]
  18. Tomppo, E.; Olsson, H.; Ståhl, G.; Nilsson, M.; Hagner, O.; Katila, M. Combining national forest inventory field plots and remote sensing data for forest databases. Remote Sens. Environ. 2008, 112, 1982–1999. [Google Scholar] [CrossRef]
  19. Abegg, M.; Kükenbrink, D.; Zell, J.; Schaepman, M.E.; Morsdorf, F. Terrestrial Laser Scanning for Forest Inventories—Tree Diameter Distribution and Scanner Location Impact on Occlusion. Forests 2017, 8, 184. [Google Scholar] [CrossRef]
  20. Barrett, F.; McRoberts, R.E.; Tomppo, E.; Cienciala, E.; Waser, L.T. A questionnaire-based review of the operational use of remotely sensed data by national forest inventories. Remote Sens. Environ. 2016, 174, 279–289. [Google Scholar] [CrossRef]
  21. FAO. State of Europe’s Forests 2015. Ministerial Conference on the Protection of Forests in Europe FOREST EUROPE; Liaison Unit Madrid: Madrid, Spain, 2015. [Google Scholar]
  22. Asner, G.P.; Anderson, C.B.; Martin, R.E.; Tupayachi, R.; Knapp, D.E.; Sinca, F. Landscape biogeochemistry reflected in shifting distributions of chemical traits in the Amazon forest canopy. Nat. Geosci. 2015, 8, 567–573. [Google Scholar] [CrossRef]
  23. Buermann, W.; Parida, B.; Jung, M.; MacDonald, G.M.; Tucker, C.J.; Reichstein, M. Recent shift in Eurasian boreal forest greening response may be associated with warmer and drier summers. Geophys. Res. Lett. 2014, 41, 1995–2002. [Google Scholar] [CrossRef]
  24. Lausch, A.; Erasmi, S.; King, D.J.; Magdon, P.; Heurich, M. Understanding Forest Health with Remote Sensing—Part I—A Review of Spectral Traits, Processes and Remote-Sensing Characteristics. Remote Sens. 2016, 8, 1029. [Google Scholar] [CrossRef]
  25. Lausch, A.; Bannehr, L.; Beckmann, M.; Boehm, C.; Feilhauer, H.; Hacker, J.M.; Heurich, M.; Jung, A.; Klenke, R.; Neumann, C.; et al. Linking Earth Observation and taxonomic, structural and functional biodiversity: Local to ecosystem perspectives. Ecol. Indic. 2016, 70, 317–339. [Google Scholar] [CrossRef]
  26. Cardinale, B.J.; Duffy, J.E.; Gonzalez, A.; Hooper, D.U.; Perrings, C.; Venail, P.; Narwani, A.; Mace, G.M.; Tilman, D.; Wardle, D.A.; et al. Biodiversity loss and its impact on humanity. Nature 2012, 486, 59–67. [Google Scholar] [CrossRef] [PubMed]
  27. Galic, N.; Sullivan, L.L.; Grimm, V.; Forbes, V.E. When things don’t add up: Quantifying impacts of multiple stressors from individual metabolism to ecosystem processing. Ecol. Lett. 2018, 21, 568–577. [Google Scholar] [CrossRef] [PubMed]
  28. Lausch, A.; Blaschke, T.; Haase, D.; Herzog, F.; Syrbe, R.-U.; Tischendorf, L.; Walz, U. Understanding and quantifying landscape structure—A review on relevant process characteristics, data models and landscape metrics. Ecol. Model. 2015, 295, 31–41. [Google Scholar] [CrossRef]
  29. Schmidt, J.; Fassnacht, F.E.; Lausch, A.; Schmidtlein, S. Assessing the functional signature of heathland landscapes via hyperspectral remote sensing. Ecol. Indic. 2017, 73, 505–512. [Google Scholar] [CrossRef]
  30. Schmidtlein, S.; Feilhauer, H.; Bruelheide, H. Mapping plant strategy types using remote sensing. J. Veg. Sci. 2012, 23, 395–405. [Google Scholar] [CrossRef]
  31. Rapport, D.J.; Costanza, R.; McMichael, A.J. Assessing ecosystem health. Trends Ecol. Evol. 1998, 13, 397–402. [Google Scholar] [CrossRef]
  32. Müller, F. Indicating ecosystem and landscape organisation. Ecol. Indic. 2005, 5, 280–294. [Google Scholar] [CrossRef]
  33. Haase, P.; Tonkin, J.D.; Stoll, S.; Burkhard, B.; Frenzel, M.; Geijzendorffer, I.R.; Häuser, C.; Klotz, S.; Kühn, I.; McDowell, W.H.; et al. The next generation of site-based long-term ecological monitoring: Linking essential biodiversity variables and ecosystem integrity. Sci. Total Environ. 2018, 613, 1376–1384. [Google Scholar] [CrossRef] [PubMed]
  34. Lausch, A.; Olaf, B.; Stefan, K.; Leitao, P.; Jung, A.; Rocchini, D.; Schaepman, M.E.; Skidmore, A.K.; Tischendorf, L.; Knapp, S. Understanding and assessing vegetation health by in-situ species and remote sensing approaches Journal. Methods Ecol. Evol. 2018. [Google Scholar] [CrossRef]
  35. Johann Heinrich von Thünen-Institute, Forest Condition Monitoring (FCM) Level-I-Monitoring. Available online: https://www.thuenen.de/de/wo/arbeitsbereiche/waldmonitoring/ (accessed on 3 January 2017).
  36. Lorenz, M. International co-operative programme on assessment and monitoring of air pollution effects on forests—ICP Forests. Water Air Soil Pollut. 1995, 85, 1221–1226. [Google Scholar] [CrossRef]
  37. Federal Ministry for Food and Agriculture, National Forest Inventory Level-III-Monitoring. Available online: https://bwi.info/ (accessed on 3 January 2017).
  38. United States Department of Agriculture (USDA) Forest Service, FH Monitoring (M). Available online: https://www.fs.fed.us/foresthealth/monitoring/index.shtml (accessed on 3 January 2017).
  39. Yang, J.; Dai, G.; Wang, S. China’s national monitoring program on ecological functions of forests: An analysis of the protocol and initial results. Forests 2015, 6, 809–826. [Google Scholar] [CrossRef]
  40. Canadian Forest Service (CFS), National FHM Network. Available online: http://www.cfs.nrcan.gc.ca/publications/?id=4105 (accessed on 3 January 2017).
  41. National Forest Inventory (NFI), Canada, National Forest Inventory. Available online: https://nfi.nfis.org/en/ (accessed on 3 January 2017).
  42. United Nations Economic Commission for Europe (UNECE), ICP. Available online: http://icp-forests.net/, http://icp-forests.net/page/icp-forests-executive-report (accessed on 3 January 2017).
  43. Food and Agriculture Organization of the United Nations (FAO), Forest Resources Assessment. Available online: http://www.fao.org/forest-resources-assessment/en/ (accessed on 3 January 2017).
  44. Kandler, G. The design of the second German national forest inventory. In Proceedings of the Eighth Annual Forest Inventory and Analysis Symposium; McRoberts, R.E., Reams, G.A., Van Deusen, P.C., McWilliams, W.H., Eds.; Monterey, CA. Gen. Tech. Report WO-79; U.S. Department of Agriculture, Forest Service: Washington, DC, USA, 2009; pp. 19–24. [Google Scholar]
  45. Matyssek, R.; Wieser, G.; Calfapietra, C.; de Vries, W.; Dizengremel, P.; Ernst, D.; Jolivet, Y.; Mikkelsen, T.N.; Mohren, G.M.J.; Le Thiec, D.; et al. Forests under climate change and air pollution: Gaps in understanding and future directions for research. Environ. Pollut. 2012, 160, 57–65. [Google Scholar] [CrossRef] [PubMed]
  46. Pause, M.; Schweitzer, C.; Rosenthal, M.; Keuck, V.; Bumberger, J.; Dietrich, P.; Heurich, M.; Jung, A.; Lausch, A. In situ/remote sensing integration to assess forest health—A review. Remote Sens. 2016, 8, 471. [Google Scholar] [CrossRef]
  47. Turner, W.; Spector, S.; Gardiner, N.; Fladeland, M.; Sterling, E.; Steininger, M. Remote sensing for biodiversity science and conservation. Trends Ecol. Evol. 2003, 18, 306–314. [Google Scholar] [CrossRef]
  48. Toth, C.; Jóźków, G. Remote sensing platforms and sensors: A survey. ISPRS J. Photogramm. Remote Sens. 2016, 115, 22–36. [Google Scholar] [CrossRef]
  49. Kuenzer, C.; Blümel, A.; Gebhardt, S.; Quoc, T.V.; Dech, S. Remote sensing of mangrove ecosystems: A review. Remote Sens. 2011, 3, 878–928. [Google Scholar] [CrossRef]
  50. Banskota, A.; Kayastha, N.; Falkowski, M.J.; Wulder, M.A.; Froese, R.E.; White, J.C. Forest monitoring using Landsat time series data: A review. Can. J. Remote Sens. 2014, 40, 362–384. [Google Scholar] [CrossRef]
  51. Joshi, N.; Mitchard, E.T.A.; Woo, N.; Torres, J.; Moll-rocek, J.; Ehammer, A. Mapping dynamics of deforestation and forest degradation in tropical forests using radar satellite data. Environ. Res. Lett. 2015, 10, 34014. [Google Scholar] [CrossRef]
  52. Turner, W. Sensing biodiversity. Science 2014, 346, 301–302. [Google Scholar] [CrossRef] [PubMed]
  53. Kuenzer, C.; Ottinger, M.; Wegmann, M.; Guo, H. Earth observation satellite sensors for biodiversity monitoring: Potentials and bottlenecks. Int. J. Remote Sens. 2014, 35, 6599–6647. [Google Scholar] [CrossRef]
  54. Asner, G.P.; Knapp, D.E.; Anderson, C.B.; Martin, R.E.; Vaughn, N. Large-scale climatic and geophysical controls on the leaf economics spectrum. Proc. Natl. Acad. Sci. USA 2016, 113, E4043–E4051. [Google Scholar] [CrossRef] [PubMed]
  55. Wulder, M.A.; Coops, N.C. Make Earth observations open access. Nature 2014, 513, 30–31. [Google Scholar] [CrossRef] [PubMed]
  56. Wingfield, M.J.; Brockerhoff, E.G.; Wingfield, B.D.; Slippers, B. Planted forest health: The need for a global strategy. Science 2015, 349, 832–836. [Google Scholar] [CrossRef] [PubMed]
  57. McDowell, N.G.; Coops, N.C.; Beck, P.S.A.; Chambers, J.Q.; Gangodagamage, C.; Hicke, J.A.; Huang, C.; Kennedy, R.; Krofcheck, D.J.; Litvak, M.; et al. Global satellite monitoring of climate-induced vegetation disturbances. Trends Plant Sci. 2015, 20, 114–123. [Google Scholar] [CrossRef] [PubMed]
  58. Jetz, W.; Cavender-Bares, J.; Pavlick, R.; Schimel, D.; Davis, F.W.; Asner, G.P.; Guralnick, R.; Kattge, J.; Latimer, A.M.; Moorcroft, P.; et al. Monitoring plant functional diversity from space. Nat. Plants 2016, 2, 1–5. [Google Scholar]
  59. Riemann, R.; Wilson, B.T.; Lister, A.; Parks, S. An effective assessment protocol for continuous geospatial datasets of forest characteristics using USFS Forest Inventory and Analysis (FIA) data. Remote Sens. Environ. 2010, 114, 2337–2352. [Google Scholar] [CrossRef]
  60. Sader, S.A.; Hoppus, M.; Metzler, J.W.; Jin, S. Perspectives of Maine forest cover change from Landsat imagery and Forest Inventory Analysis (FIA). J. For. 2005, 103, 299–303. [Google Scholar]
  61. Verheyen, K.; Vanhellemont, M.; Auge, H.; Baeten, L.; Baraloto, C.; Barsoum, N.; Bilodeau-Gauthier, S.; Bruelheide, H.; Castagneyrol, B.; Godbold, D.; et al. Contributions of a global network of tree diversity experiments to sustainable forest plantations. Ambio 2016, 45, 29–41. [Google Scholar] [CrossRef] [PubMed]
  62. Verhaeghe, G. Trees4 future-Designing Trees for the Future. Access to Key Research Infrastructures and Tools in the Field of Forestry and Wood Technology in Europe. Drewno 2012, 55, 141–144. [Google Scholar]
  63. Baeten, L.; Verheyen, K.; Wirth, C.; Bruelheide, H.; Bussotti, F.; Finér, L.; Jaroszewicz, B.; Selvi, F.; Valladares, F.; Allan, E.; et al. A novel comparative research platform designed to determine the functional significance of tree species diversity in European forests. Perspect. Plant Ecol. Evol. Syst. 2013, 15, 281–291. [Google Scholar] [CrossRef]
  64. Scherer-Lorenzen, M.; Schulze, E.D.; Don, A.; Schumacher, J.; Weller, E. Exploring the functional significance of forest diversity: A new long-term experiment with temperate tree species (BIOTREE). Perspect. Plant Ecol. Evol. Syst. 2007, 9, 53–70. [Google Scholar] [CrossRef]
  65. Watch, G.F. Global Forest Watch. For. Chron. 2000, 76, 398. [Google Scholar]
  66. Showstack, R. Global Forest Watch Initiative Provides Opportunity for Worldwide Monitoring. EOS Trans. Am. Geophys. Union 2014, 95, 77–79. [Google Scholar] [CrossRef]
  67. Gracan, J.; Kajba, D.; Peric, S.; Idzojtic, M.; Ivankovic, M.; Marjanovic, H. EUFORGEN forest genetic resources programme fourth EUFORGEN: Steering committee meeting. Progr. Eur. Sumski Genet. Resur. (EUFORGEN) 2004, 128, 689–697. [Google Scholar]
  68. Milly, P.C.D. Climate, soil water storage, and the average water balance. Water Resour. Res. 1994, 30, 2143–2156. [Google Scholar] [CrossRef]
  69. Struthers, I.; Hinz, C.; Sivapalan, M.; Deutschmann, G.; Beese, F.; Meissner, R. Modelling the water balance of a free-draining lysimeter using the downward approach. Hydrol. Process. 2003, 17, 2151–2169. [Google Scholar] [CrossRef]
  70. Will, G.M. A field lysimeter to study water movement and nutrient content in a pumice soil under Pinus radiata forest. I. Site and construction details. N. Z. J. For. Sci. 1977, 7, 144–150. [Google Scholar]
  71. Müller, J. Forestry and water budget of the lowlands in northeast Germany—Consequences for the choice of tree species and for forest management. J. Water Land Dev. 2009, 13A, 133–148. [Google Scholar] [CrossRef]
  72. Johnson, R.; Williams, L.; Ayars, J.; Trout, T. Weighing lysimeters aid study of water relations in tree and vine crops. Calif. Agric. 2005, 59, 133–136. [Google Scholar] [CrossRef]
  73. Ben-Gal, A.; Kool, D.; Agam, N.; van Halsema, G.E.; Yermiyahu, U.; Yafe, A.; Presnov, E.; Erel, R.; Majdop, A.; Zipori, I.; et al. Whole-tree water balance and indicators for short-term drought stress in non-bearing ‘Barnea’ olives. Agric. Water Manag. 2010, 98, 124–133. [Google Scholar] [CrossRef]
  74. Yick, J.; Mukherjee, B.; Ghosal, D. Wireless sensor network survey. Comput. Netw. 2008, 52, 2292–2330. [Google Scholar] [CrossRef]
  75. Marchetti, M. Monitoring and Indicators of Forest Biodiversity in Europe: From Ideas to Operationality; European Forest Institute: Joensuu, Finland, 2005; Volume 58. [Google Scholar]
  76. Großkinsky, D.K.; Svensgaard, J.; Christensen, S.R.T. Plant phenomics and the need for physiological phenotyping across scales to narrow the genotype-to-phenotype knowledge gap. J. Exp. Bot. 2015, 66, 5429–5440. [Google Scholar] [CrossRef] [PubMed]
  77. Pieruschka, R.; Lawson, T. Preface. J. Exp. Bot. 2015, 66, 5385–5387. [Google Scholar] [CrossRef] [PubMed]
  78. Furbank, R.T. Foreword: Plant phenomics: From gene to form and function. Funct. Plant Biol. 2009, 36, 5–6. [Google Scholar]
  79. Großkinsky, D.K.; Pieruschka, R.; Svensgaard, J.; Rascher, U.; Christensen, S.; Schurr, U.; Roitsch, T. Phenotyping in the fields: Dissecting the genetics of quantitative traits and digital farming. New Phytol. 2015, 207, 950–952. [Google Scholar] [CrossRef] [PubMed]
  80. Mittler, R.; Blumwald, E. Genetic engineering for modern agriculture: Challenges and perspectives. Annu. Rev. Plant Biol. 2010, 61, 443–462. [Google Scholar] [CrossRef] [PubMed]
  81. Lawton, J.H.; Naeem, S.; Woodfin, R.M.; Brown, V.K.; Gange, A.; Godfray, H.C.J.; Heads, P.A.; Lawler, S.; Magda, D.; Thomas, C.D.; et al. The Ecotron: A controlled environmental facility for the investigation of population and ecosystem processes. Philos. Trans. Biol. Sci. 1993, 341, 181–194. [Google Scholar] [CrossRef]
  82. Ehrhardt, D.W.; Frommer, W.B. New Technologies for 21st Century Plant Science. Plant Cell 2012, 24, 374–394. [Google Scholar] [CrossRef] [PubMed]
  83. Fiorani, F.; Schurr, U. Future scenarios for plant phenotyping. Annu. Rev. Plant Biol. 2013, 64, 267–291. [Google Scholar] [CrossRef] [PubMed]
  84. Kuijken, R.C.P.; Van Eeuwijk, F.A.; Marcelis, L.F.M.; Bouwmeester, H.J. Root phenotyping: From component trait in the lab to breeding. J. Exp. Bot. 2015, 66, 5389–5401. [Google Scholar] [CrossRef] [PubMed]
  85. Wardle, D.A. Do experiments exploring plant diversity-ecosystem functioning relationships inform how biodiversity loss impacts natural ecosystems? J. Veg. Sci. 2016, 27, 646–653. [Google Scholar] [CrossRef]
  86. Loreau, M. Linking biodiversity and ecosystems: Towards a unifying ecological theory. Philos. Trans. R. Soc. Lond. B Biol. Sci. 2010, 365, 49–60. [Google Scholar] [CrossRef] [PubMed]
  87. Eisenhauer, N.; Barnes, A.D.; Cesarz, S.; Craven, D.; Ferlian, O.; Gottschall, F.; Hines, J.; Sendek, A.; Siebert, J.; Thakur, M.P.; et al. Biodiversity-ecosystem function experiments reveal the mechanisms underlying the consequences of biodiversity change in real world ecosystems. J. Veg. Sci. 2016, 27, 1061–1070. [Google Scholar] [CrossRef]
  88. Purvis, A.; Hector, A. Getting the measure of biodiversity. Nature 2000, 405, 212–219. [Google Scholar] [CrossRef] [PubMed]
  89. Gaston, K.J.; Chown, S.L.; Calosi, P.; Bernardo, J.; Bilton, D.T.; Clarke, A.; Clusella-Trullas, S.; Ghalambor, C.K.; Konarzewski, M.; Peck, L.S.; et al. Macrophysiology: A Conceptual Reunification. Am. Nat. 2009, 174, 595–612. [Google Scholar] [CrossRef] [PubMed]
  90. Asner, G.P.; Martin, R.E.; Anderson, C.B.; Kryston, K.; Vaughn, N.; Knapp, D.E.; Bentley, L.P.; Shenkin, A.; Salinas, N.; Sinca, F.; et al. Scale dependence of canopy trait distributions along a tropical forest elevation gradient. New Phytol. 2016, 214, 937–988. [Google Scholar] [CrossRef] [PubMed]
  91. Buddenbaum, H.; Stern, O.; Paschmionka, B.; Hass, E.; Gattung, T.; Stoffels, J.; Hill, J.; Werner, W. Using VNIR and SWIR field imaging spectroscopy for drought stress monitoring of beech seedlings. Int. J. Remote Sens. 2015, 36, 4590–4605. [Google Scholar] [CrossRef]
  92. Brosinsky, A.; Lausch, A.; Doktor, D.; Salbach, C.; Merbach, I.; Gwillym-Margianto, S.; Pause, M. Analysis of Spectral Vegetation Signal Characteristics as a Function of Soil Moisture Conditions Using Hyperspectral Remote Sensing. J. Indian Soc. Remote Sens. 2013, 42, 311–324. [Google Scholar] [CrossRef]
  93. Zacharias, S.; Bogena, H.; Samaniego, L.; Mauder, M.; Fuß, R.; Pütz, T.; Frenzel, M.; Schwank, M.; Baessler, C.; Butterbach-Bahl, K.; et al. A Network of Terrestrial Environmental Observatories in Germany. Vadose Z. J. 2011, 10, 955. [Google Scholar] [CrossRef]
  94. Borg, E.; Schiller, C.; Daedelow, H.; Fichtelmann, B.; Jahncke, D.; Renke, F.; Tamm, H.; Asche, H. Automated Generation of Value-Added Products for the Validation of Remote Sensing Information Based on In-situ Data. In Proceedings of the International Conference on Computational Science and Its Applications, Guimarães, Portugal, 30 June–3 July 2014; pp. 393–407. [Google Scholar]
  95. Jülich, F.; Centre, H. TERENO: German network of terrestrial environmental observatories. J. Large Scale Res. Facil. 2016, 52, 1–8. [Google Scholar]
  96. Wollschläger, U.; Attinger, S.; Borchardt, D.; Brauns, M.; Cuntz, M.; Dietrich, P.; Fleckenstein, J.H.; Friese, K.; Friesen, J.; Harpke, A.; et al. The Bode Hydrological Observatory: A platform for integrated, interdisciplinary hydro-ecological research within the TERENO Harz/Central German Lowland Observatorytle. Environ. Earth Sci. 2010, 76, 29. [Google Scholar] [CrossRef]
  97. Vihervaara, P.; D’Amato, D.; Forsius, M.; Angelstam, P.; Baessler, C.; Balvanera, P.; Boldgiv, B.; Bourgeron, P.; Dick, J.; Kanka, R.; et al. Using long-term ecosystem service and biodiversity data to study the impacts and adaptation options in response to climate change: Insights from the global ILTER sites network. Curr. Opin. Environ. Sustain. 2013, 5, 53–66. [Google Scholar] [CrossRef]
  98. Müller, F.; Baessler, C.; Schubert, H.; Klotz, S. (Eds.) Long-Term Ecological Research. Between Theory and Application; Springer: Dordrecht, The Netherlands, 2010. [Google Scholar]
  99. Riddering, J.; Holden, Z.A.; Jolly, W.M.; Warren, A. Smartphone applications for data collections, dynamic modeling, and visualization in the wildland fire environment. Fire Manag. Today 2015, 74, 10–15. [Google Scholar]
  100. Aanensen, D.M.; Huntley, D.M.; Feil, E.J.; Al-Own, F.; Spratt, B.G. EpiCollect: Linking smartphones to web applications for epidemiology, ecology and community data collection. PLoS ONE 2009, 4, e6968. [Google Scholar] [CrossRef] [PubMed]
  101. Wood, C.; Sullivan, B.; Iliff, M.; Fink, D.; Kelling, S. eBird: Engaging birders in science and conservation. PLoS Biol. 2011, 9, e1001220. [Google Scholar] [CrossRef] [PubMed]
  102. Priess, J.A.; Elger, R.H.J. The ESM-App—A new smartphone application to map ecosystem services. In Proceedings of the 7th International Congress on Environmental Modelling and Software, San Diego, CA, USA, 15–19 June 2014; Ames, D.P., Quinn, N.W.T., Rizzoli, A.E., Eds.; International Environmental Modelling and Software Society: Leipzig, Germany, 2014; ISBN 978-88-9035-744-2. [Google Scholar]
  103. U.S. Department of Commerce, N.O. and A.A. The mPING Project. 2016. Available online: http://www.nssl.noaa.gov/projects/ping (accessed on 31 December 2016).
  104. Eberle, J.; Hüttich, C.; Schmulius, C. MySeason. App from Institute for Geography, Department for Earth Observation, 2016. Available online: http://www.eo.uni-jena.de (accessed on 31 December 2016).
  105. Borg, E. CAL/VAL Site DEMMIN for Remote Sensing; Network of European Regions Using Space Technology: Brussels, Belgium, 2010. [Google Scholar]
  106. Shugart, H.H.; Asner, G.P.; Fischer, R.; Huth, A.; Knapp, N.; Le Toan, T.; Shuman, J.K. Computer and remote-sensing infrastructure to enhance large-scale testing of individual-based forest models. Front. Ecol. Environ. 2015, 13, 503–511. [Google Scholar] [CrossRef]
  107. Mäkinen, A.; Holopainen, M.; Kangas, A.; Rasinmäki, J. Propagating the errors of initial forest variables through stand- and tree-level growth simulators. Eur. J. For. Res. 2010, 129, 887–897. [Google Scholar] [CrossRef]
  108. Fischer, R.; Bohn, F.; Dantas de Paula, M.; Dislich, C.; Groeneveld, J.; Gutiérrez, A.G.; Kazmierczak, M.; Knapp, N.; Lehmann, S.; Paulick, S.; et al. Lessons learned from applying a forest gap model to understand ecosystem and carbon dynamics of complex tropical forests. Ecol. Model. 2016, 326, 124–133. [Google Scholar] [CrossRef]
  109. Coops, N.C.; Waring, R.H.; Brown, S.R.; Running, S.W. Comparisons of predictions of net primary production and seasonal patterns in water use derived with two forest growth model in Southwestern Oregon. Ecol. Model. 2001, 142, 61–81. [Google Scholar] [CrossRef]
  110. Fawcett, D.; Verhoef, W.; Schläpfer, D.; Schneider, F.D.; Schaepman, M.E.; Damm, A. Remote Sensing of Environment Advancing retrievals of surface reflectance and vegetation indices over forest ecosystems by combining imaging spectroscopy, digital object models, and 3D canopy modelling. Remote Sens. Environ. 2018, 204, 583–595. [Google Scholar] [CrossRef]
  111. Buddenbaum, H.; Hill, J. PROSPECT Inversions of Leaf Laboratory Imaging Spectroscopy—A Comparison of Spectral Range and Inversion Technique Influences. Photogramm. Fernerkundung Geoinf. 2015, 2015, 231–240. [Google Scholar] [CrossRef]
  112. Roedig, E.; Matthias, C.; Heinke, J.; Rammig, A.; Huth, A. Spatial heterogeneity of biomass and forest structure of the Amazon rainforest: Linking remote sensing, forest modeling and field inventory. Glob. Ecol. Biogeogr. 2017, 26, 1292–1302. [Google Scholar] [CrossRef]
  113. Pütz, S.; Groeneveld, J.; Henle, K.; Knogge, C.; Martensen, A.C.; Metz, M.; Metzger, J.P.; Ribeiro, M.C.; de Paula, M.D.; Huth, A. Long-term carbon loss in fragmented Neotropical forests. Nat. Commun. 2014, 5, 5037. [Google Scholar] [CrossRef] [PubMed]
  114. Brinck, K.; Fischer, R.; Groeneveld, J.; Lehmann, S.; Dantas De Paula, M.; Pütz, S.; Sexton, J.O.; Song, D.; Huth, A. High resolution analysis of tropical forest fragmentation and its impact on the global carbon cycle. Nat. Commun. 2017, 8, 14855. [Google Scholar] [CrossRef] [PubMed]
  115. Cernansky, R. Biodiversity moves beyond counting species. Nature 2017, 546, 22–24. [Google Scholar] [CrossRef] [PubMed]
  116. Abelleira Martínez, O.J.; Fremier, A.K.; Günter, S.; Ramos Bendaña, Z.; Vierling, L.; Galbraith, S.M.; Bosque-Pérez, N.A.; Ordoñez, J.C. Scaling up functional traits for ecosystem services with remote sensing: Concepts and methods. Ecol. Evol. 2016, 6, 4359–4371. [Google Scholar] [CrossRef] [PubMed]
  117. Gamba, P.; Chanussot, J. Foreword to the Special Issue on Data Fusion. IEEE Trans. Geosci. Remote Sens. 2008, 46, 1283–1288. [Google Scholar] [CrossRef]
  118. Ghassemian, H. A review of remote sensing image fusion methods. Inf. Fusion 2016, 32, 75–89. [Google Scholar] [CrossRef]
  119. Hilker, T.; Wulder, M.A.; Coops, N.C.; Linke, J.; McDermid, G.; Masek, J.G.; Gao, F.; White, J.C. A new data fusion model for high spatial- and temporal-resolution mapping of forest disturbance based on Landsat and MODIS. Remote Sens. Environ. 2009, 113, 1613–1627. [Google Scholar] [CrossRef]
  120. Gao, F.; Masek, J.; Schwaller, M.; Hall, F. On the blending of the landsat and MODIS surface reflectance: Predicting daily landsat surface reflectance. IEEE Trans. Geosci. Remote Sens. 2006, 44, 2207–2218. [Google Scholar]
  121. Hilker, T.; Wulder, M.A.; Coops, N.C.; Seitz, N.; White, J.C.; Gao, F.; Masek, J.G.; Stenhouse, G. Generation of dense time series synthetic Landsat data through data blending with MODIS using a spatial and temporal adaptive reflectance fusion model. Remote Sens. Environ. 2009, 113, 1988–1999. [Google Scholar] [CrossRef]
  122. Torabzadeh, H.; Morsdorf, F.; Schaepman, M.E. Fusion of imaging spectroscopy and airborne laser scanning data for characterization of forest ecosystems—A review. ISPRS J. Photogramm. Remote Sens. 2014, 97, 25–35. [Google Scholar] [CrossRef]
  123. Taylor, J. Introduction to Error Analysis, the Study of Uncertainties in Physical Measurements, 2nd ed.; University Science Books: New York, NY, USA, 1997. [Google Scholar]
  124. Der Kiureghian, A.; Ditlevsen, O. Aleatory or epistemic? Does it matter? Struct. Saf. 2009, 31, 105–112. [Google Scholar] [CrossRef]
  125. Lane, D.A.; Maxfield, R.R. Ontological uncertainty and innovation. J. Evol. Econ. 2005, 15, 3–50. [Google Scholar] [CrossRef]
  126. Wu, H.; Li, Z.L. Scale issues in remote sensing: A review on analysis, processing and modeling. Sensors 2009, 9, 1768–1793. [Google Scholar] [CrossRef] [PubMed]
  127. Segl, K.; Guanter, L.; Rogass, C.; Kuester, T.; Roessner, S.; Kaufmann, H.; Sang, B.; Mogulsky, V.; Hofer, S. EeteSThe EnMAP end-to-end simulation tool. IEEE J. Sel. Top. Appl. Earth Obs. Remote Sens. 2012, 5, 522–530. [Google Scholar] [CrossRef]
  128. Jung, A.; Götze, C.; Glässer, C. Overview of Experimental Setups in Spectroscopic Laboratory Measurements—The SpecTour Project. Photogramm. Fernerkundung Geoinf. 2012, 4, 433–442. [Google Scholar] [CrossRef]
  129. Baldocchi, D.; Falge, E.; Gu, L.H.; Olson, R.; Hollinger, D.; Running, S.; Anthoni, P.; Bernhofer, C.; Davis, K.; Evans, R.; et al. FLUXNET: A New Tool to Study the Temporal and Spatial Variability of Ecosystem-Scale Carbon Dioxide, Water Vapor, and Energy Flux Densities. Bull. Am. Meteorol. Soc. 2001, 82, 2415–2434. [Google Scholar] [CrossRef]
  130. Hueni, A.; Nieke, J.; Schopfer, J.; Kneubühler, M.; Itten, K.I. The spectral database SPECCHIO for improved long-term usability and data sharing. Comput. Geosci. 2009, 35, 557–565. [Google Scholar] [CrossRef]
  131. Saarinen, N.; White, J.C.; Wulder, M.A.; Kangas, A.; Tuominen, S.; Kankare, V.; Holopainen, M.; Hyyppä, J.; Vastaranta, M. Landsat archive holdings for Finland: Opportunities for forest monitoring. Forests 2018, 52, 9986. [Google Scholar] [CrossRef]
  132. Eldredge, N.; Cracraft, J. Phylogenetic Patterns and the Evolutionary Process; University Press: New York, NY, USA, 1980. [Google Scholar]
  133. Mayr, E. Systematics and the Origin of Species from the Viewpoint of a Zoologist; Columbia University Press: New York, NY, USA, 1942. [Google Scholar]
  134. Boulangeat, I.; Thuiller, W. Accounting for dispersal and biotic interactions to disentangle the drivers of species distributions and their abundances. Ecol. Lett. 2012, 15, 584–593. [Google Scholar] [CrossRef] [PubMed]
  135. Violle, C.; Reich, P.B.; Pacala, S.W.; Enquist, B.J.; Kattge, J. The emergence and promise of functional biogeography. Proc. Natl. Acad. Sci. USA 2014, 111, 13690–13696. [Google Scholar] [CrossRef] [PubMed]
  136. Mayr, E.; Ashlock, P.D. Principles of Systematic Zoology; Systematic Biology: Oxford, UK, 1969. [Google Scholar]
  137. Green, J.L.; Bohannan, J.M.; Whitaker, R.J. Microbial biogeography: From taxonomy to traits. Science 2008, 320, 1039–1043. [Google Scholar] [CrossRef] [PubMed]
  138. Knapp, S.; Kühn, I.; Wittig, R.; Ozinga, W.A.; Poschlod, P.; Klotz, S. Urbanization causes shifts in species’ trait state frequencies. Preslia 2008, 80, 375–388. [Google Scholar]
  139. Garnier, E.; Lavorel, S.; Ansquer, P.; Castro, H.; Cruz, P.; Dolezal, J.; Eriksson, O.; Fortunel, C.; Freitas, H.; Golodets, C.; et al. Assessing the effects of land-use change on plant traits, communities and ecosystem functioning in grasslands: A standardized methodology and lessons from an application to 11 European sites. Ann. Bot. 2007, 99, 967–985. [Google Scholar] [CrossRef] [PubMed]
  140. Knapp, S.; Kühn, I.; Stolle, J.; Klotz, S. Changes in the functional composition of a Central European urban flora over three centuries. Perspect. Plant Ecol. Evol. Syst. 2010, 12, 235–244. [Google Scholar] [CrossRef]
  141. Gámez-Virués, S.; Perović, D.J.; Gossner, M.M.; Börschig, C.; Blüthgen, N.; de Jong, H.; Simons, N.K.; Klein, A.-M.; Krauss, J.; Maier, G.; et al. Landscape simplification filters species traits and drives biotic homogenization. Nat. Commun. 2015, 6, 8568. [Google Scholar] [CrossRef] [PubMed]
  142. Violle, C.; Garnier, E.; Lecoeur, J.; Roumet, C.; Podeur, C.; Blanchard, A.; Navas, M.L. Competition, traits and resource depletion in plant communities. Oecologia 2009, 160, 747–755. [Google Scholar] [CrossRef] [PubMed]
  143. Caruso, C.M.; Remington, D.L.D.; Ostergren, K.E. Variation in resource limitation of plant reproduction influences natural selection on floral traits of Asclepias syriaca. Oecologia 2005, 146, 68–76. [Google Scholar] [CrossRef] [PubMed]
  144. Kühn, I.; Bierman, S.M.; Durka, W.; Klotz, S. Relating geographical variation in pollination types to environmental and spatial factors using novel statistical methods. New Phytol. 2006, 172, 127–139. [Google Scholar] [CrossRef] [PubMed]
  145. Van Bodegom, P.M.; Douma, J.C.; Verheijen, L.M. A fully traits-based approach to modeling global vegetation distribution. Proc. Natl. Acad. Sci. USA 2014, 111, 13733–13738. [Google Scholar] [CrossRef] [PubMed]
  146. Van Bodegom, P.M.; Douma, J.C.; Witte, J.P.M.; Ordoñez, J.C.; Bartholomeus, R.P.; Aerts, R. Going beyond limitations of plant functional types when predicting global ecosystem-atmosphere fluxes: Exploring the merits of traits-based approaches. Glob. Ecol. Biogeogr. 2012, 21, 625–636. [Google Scholar] [CrossRef]
  147. Diaz, S.; Hodgson, J.G.; Thompson, K.; Cabido, M.; Cornelissen, J.H.C.; Jalili, A.; Montserrat-Marti, G.; Grime, J.P.; Zarrinkamar, F.; Asri, Y.; et al. The plant traits that drive ecosystems: Evidence from three continents. J. Veg. Sci. 2004, 15, 295–304. [Google Scholar] [CrossRef]
  148. Díaz, S.; Kattge, J.; Cornelissen, J.H.C.; Wright, I.J.; Lavorel, S.; Dray, S.; Reu, B.; Kleyer, M.; Wirth, C.; Prentice, I.C.; et al. The global spectrum of plant form and function. Nature 2015, 529, 1–17. [Google Scholar] [CrossRef] [PubMed]
  149. Schneider, F.D.; Morsdorf, F.; Schmid, B.; Petchey, O.L.; Hueni, A.; Schimel, D.S.; Schaepman, M.E. Mapping functional diversity from remotely sensed morphological and physiological forest traits. Nat. Commun. 2017, 8, 141. [Google Scholar] [CrossRef] [PubMed]
  150. Bernhardt-Römermann, M.; Gray, A.; Vanbergen, A.J.; Bergès, L.; Bohner, A.; Brooker, R.W.; De Bruyn, L.; De Cinti, B.; Dirnböck, T.; Grandin, U.; et al. Functional traits and local environment predict vegetation responses to disturbance: A pan-European multi-site experiment. J. Ecol. 2011, 99, 777–787. [Google Scholar] [CrossRef]
  151. Lavorel, S.; Garnier, E. Predicting changes in community composition and ecosystem functioning from plant traits: Revisting the Holy Grail. Funct. Ecol. 2002, 16, 545–556. [Google Scholar] [CrossRef]
  152. Reichstein, M.; Bahn, M.; Mahecha, M.D.; Kattge, J.; Baldocchi, D.D. Linking plant and ecosystem functional biogeography. Proc. Natl. Acad. Sci. USA 2014, 111, 13697–13702. [Google Scholar] [CrossRef] [PubMed]
  153. Yamasaki, E.; Altermatt, F.; Cavender-bares, J.; Schuman, M.C.; Zuppinger-dingley, D.; Garonna, I.; Schneider, F.D.; Guille, C.; Van Moorsel, S.J.; Hahl, T.; et al. ScienceDirect Genomics meets remote sensing in global change studies: Monitoring and predicting phenology, evolution and biodiversity. Curr. Opin. Environ. Sustain. 2017, 29, 177–186. [Google Scholar] [CrossRef]
  154. Spreen, G.; Kaleschke, L.; Heygster, G. Sea ice remote sensing using AMSR-E 89-GHz channels. J. Geophys. Res. Ocean. 2008, 113, 1–14. [Google Scholar] [CrossRef]
  155. Braun, D.; Damm, A.; Paul-Limoges, E.; Revill, A.; Buchmann, N.; Petchey, O.L.; Hein, L.; Schaepman, M.E. From instantaneous to continuous: Using imaging spectroscopy and in situ data to map two productivity-related ecosystem services. Ecol. Indic. 2017, 82, 409–419. [Google Scholar] [CrossRef]
  156. Braun, D.; Damm, A.; Petchey, O.L.; Hein, L.; Schaepman, M.E. Spatio-temporal trends and trade-offs in ecosystem services: An Earth observation based assessment for Switzerland between 2004 and 2014. Ecol. Indic. 2017, 89, 828–839. [Google Scholar] [CrossRef]
  157. Immitzer, M.; Atzberger, C.; Koukal, T. Tree species classification with Random forest using very high spatial resolution 8-band worldView-2 satellite data. Remote Sens. 2012, 4, 2661–2693. [Google Scholar] [CrossRef]
  158. Fassnacht, F.E.; Latifi, H.; Stereńczak, K.; Modzelewska, A.; Lefsky, M.; Waser, L.T.; Straub, C.; Ghosh, A. Review of studies on tree species classification from remotely sensed data. Remote Sens. Environ. 2016, 186, 64–87. [Google Scholar] [CrossRef]
  159. Lausch, A.; Heurich, M.; Gordalla, D.; Dobner, H.-J.J.; Gwillym-Margianto, S.; Salbach, C. Forecasting potential bark beetle outbreaks based on spruce forest vitality using hyperspectral remote-sensing techniques at different scales. For. Ecol. Manag. 2013, 308, 76–89. [Google Scholar] [CrossRef]
  160. Deans, A.R.; Lewis, S.E.; Huala, E.; Anzaldo, S.S.; Ashburner, M.; Balhoff, J.P.; Blackburn, D.C.; Blake, J.A.; Burleigh, J.G.; Chanet, B.; et al. Finding Our Way through Phenotypes. PLoS Biol. 2015, 13, e1002033. [Google Scholar] [CrossRef] [PubMed]
  161. Burleigh, G.; Alphonse, K.; Alverson, A.J.; Bik, H.M.; Blank, C.; Cirranello, A.L.; Cui, H.; Daly, M.; Dietterich, T.G.; Gasparich, G.; et al. Next-generation phenomics for the Tree of Life. PLoS Curr. 2013. [Google Scholar] [CrossRef] [PubMed]
  162. Deans, A.R.; Yoder, M.J.; Balhoff, J.P. Time to change how we describe biodiversity. Trends Ecol. Evol. 2012, 27, 78–84. [Google Scholar] [CrossRef] [PubMed]
  163. Bräutigam, K.; Vining, K.J.; Lafon-Placette, C.; Fossdal, C.G.; Mirouze, M.; Marcos, J.G.; Fluch, S.; Fraga, M.F.; Guevara, M.Á.; Abarca, D.; et al. Epigenetic regulation of adaptive responses of forest tree species to the environment. Ecol. Evol. 2013, 3, 399–415. [Google Scholar] [CrossRef] [PubMed]
  164. Messier, J.; McGill, B.J.; Lechowicz, M.J. How do traits vary across ecological scales? A case for trait-based ecology. Ecol. Lett. 2010, 13, 838–848. [Google Scholar] [CrossRef] [PubMed]
  165. Hamilton, C.M.; Strader, L.C.; Pratt, J.G.; Maiese, D.; Hendershot, T.; Kwok, R.K.; Hammond, J.A.; Huggins, W.; Jackman, D.; Pan, H.; et al. The PhenX toolkit: Get the most from your measures. Am. J. Epidemiol. 2011, 174, 253–260. [Google Scholar] [CrossRef] [PubMed]
  166. Cornelissen, J.H.C.; Lavorel, S.; Garnier, E.; Díaz, S.; Buchmann, N.; Gurvich, D.E.; Reich, P.B.; Eter, S.; Morgan, H.D.; van der Heijden, M.G.A.; et al. Handbook of protocols for standardised and easy measurement of plant functional traits worldwide. Aust. J. Bot. 2003, 51, 335–380. [Google Scholar] [CrossRef]
  167. Pérez-Harguindeguy, N.; Díaz, S.; Lavorel, S.; Poorter, H.; Jaureguiberry, P.; Bret-Harte, M.S.; Cornwell, W.K.; Craine, J.M.; Gurvich, D.E.; Urcelay, C.; et al. New Handbook for standardized measurment of plant functional traits worldwide. Aust. J. Bot. 2013, 23, 167–234. [Google Scholar] [CrossRef]
  168. Kattge, J.; Díaz, S.; Lavorel, S.; Prentice, I.C.; Leadley, P.; Bönisch, G.; Garnier, E.; Westoby, M.; Reich, P.B.; Wright, I.J.; et al. TRY—A global database of plant traits. Glob. Chang. Biol. 2011, 17, 2905–2935. [Google Scholar] [CrossRef]
  169. Schaepman, M.E.; Ustin, S.L.; Plaza, A.J.; Painter, T.H.; Verrelst, J.; Liang, S. Earth system science related imaging spectroscopy—An assessment. Remote Sens. Environ. 2009, 113, S123–S137. [Google Scholar] [CrossRef]
  170. Homolová, L.; Malenovský, Z.; Clevers, J.G.P.W.; García-Santos, G.; Schaepman, M.E. Review of optical-based remote sensing for plant trait mapping. Ecol. Complex. 2013, 15, 1–16. [Google Scholar] [CrossRef]
  171. Ruttenberg, A.; Rees, J.A.; Samwald, M.; Marshall, M.S. Life sciences on the Semantic Web: The Neurocommons and beyond. Brief Bioinform. 2009, 10, 193–204. [Google Scholar] [CrossRef] [PubMed]
  172. Laporte, M.A.; Mougenot, I.; Garnier, E. ThesauForm-Traits: A web based collaborative tool to develop a thesaurus for plant functional diversity research. Ecol. Inform. 2012, 11, 34–44. [Google Scholar] [CrossRef]
  173. Garnier, E.; Stahl, U.; Laporte, M.-A.; Kattge, J.; Mougenot, I.; Kühn, I.; Laporte, B.; Amiaud, B.; Ahrestani, F.S.; Bönisch, G.; et al. Towards a thesaurus of plant characteristics: An ecological contribution. J. Ecol. 2017, 105, 298–309. [Google Scholar] [CrossRef]
  174. Abiven, S.; Altermatt, F.; Backhaus, N.; Deplazes-zemp, A.; Furrer, R.; Korf, B.; Niklaus, P.A.; Schaepman-strub, G.; Shimizu, K.K.; Zuppinger-dingley, D.; et al. ScienceDirect Integrative research efforts at the boundary of biodiversity and global change research. Curr. Opin. Environ. Sustain. 2017, 29, 215–222. [Google Scholar] [CrossRef]
  175. Ayris, P.; Berthou, J.-Y.; Bruce, R.; Lindstaedt, S.; Monreale, A.; Mons, B.; Murayama, Y.; Södergård, C.; Tochtermann, K.; Wilkinson, R. Realising the European Open Science Cloud; European Union: Brussels, Belgium, 2016. [Google Scholar]
  176. Abbott, A.; Butler, D.; Gibney, E.; Schiermeier, Q.; Van Noorden, R. Boon or burden: What has the EU ever done for science? Nature 2016, 534, 307–309. [Google Scholar] [CrossRef] [PubMed]
  177. Freedman, L.P.; Cockburn, I.M.; Simcoe, T.S. The economics of reproducibility in preclinical research. PLoS Biol. 2015, 13, 1–9. [Google Scholar] [CrossRef] [PubMed]
  178. Read, K.B.; Sheehan, J.R.; Huerta, M.F.; Knecht, L.S.; Mork, J.G.; Humphreys, B.L.; Abhyankar, S.; Akiwumi, O.; Bodenreider, O.; Davidson, S.; et al. Sizing the problem of improving discovery and access to NIH-Funded data: A preliminary study. PLoS ONE 2015, 10, e0132735. [Google Scholar] [CrossRef] [PubMed]
  179. Wallace, L.; Lucieer, A.; Watson, C.; Turner, D. Development of a UAV-LiDAR system with application to forest inventory. Remote Sens. 2012, 4, 1519–1543. [Google Scholar] [CrossRef]
  180. Wulder, M.A.; White, J.C.; Nelson, R.F.; Naesset, E.; Ørka, H.O.; Coops, N.C.; Hilker, T.; Bater, C.W.; Gobakken, T. Lidar sampling for large-area forest characterization: A review. Remote Sens. Environ. 2012, 121, 196–209. [Google Scholar] [CrossRef]
  181. Stysley, P.R.; Coyle, D.B.; Kay, R.B.; Frederickson, R.; Poulios, D.; Cory, K.; Clarke, G. Long term performance of the High Output Maximum Efficiency Resonator (HOMER) laser for NASA’s Global Ecosystem Dynamics Investigation (GEDI) lidar. Opt. Laser Technol. 2015, 68, 67–72. [Google Scholar] [CrossRef]
  182. Collin, A.; Hench, J.L. Towards Deeper Measurements of Tropical Reefscape Structure Using the WorldView-2 Spaceborne Sensor. Remote Sens. 2012, 4, 1425–1447. [Google Scholar] [CrossRef]
  183. Woodcock, C.E.; Allen, R.; Anderson, M.; Belward, A.; Bindschadler, R.; Cohen, W.; Gao, F.; Goward, S.N.; Helder, D.; Helmer, E.; et al. Free Access to Landsat Imagery. Science 2008, 320, 1011–1012. [Google Scholar] [CrossRef] [PubMed]
  184. Cohen, W.B.; Goward, S.N. Landsat’s Role in Ecological Applications of Remote Sensing. Bioscience 2004, 54, 535–545. [Google Scholar] [CrossRef]
  185. Wulder, M.A.; White, J.C.; Goward, S.N.; Masek, J.G.; Irons, J.R.; Herold, M.; Cohen, W.B.; Loveland, T.R.; Woodcock, C.E. Landsat continuity: Issues and opportunities for land cover monitoring. Remote Sens. Environ. 2008, 112, 955–969. [Google Scholar] [CrossRef]
  186. Coops, N.C.; Gillanders, S.N.; Wulder, M.A.; Gergel, S.E.; Nelson, T.; Goodwin, N.R. Assessing changes in forest fragmentation following infestation using time series Landsat imagery. For. Ecol. Manag. 2010, 259, 2355–2365. [Google Scholar] [CrossRef]
  187. Drusch, M.; Del Bello, U.; Carlier, S.; Colin, O.; Fernandez, V.; Gascon, F.; Hoersch, B.; Isola, C.; Laberinti, P.; Martimort, P.; et al. Sentinel-2: ESA’s Optical High-Resolution Mission for GMES Operational Services. Remote Sens. Environ. 2012, 120, 25–36. [Google Scholar] [CrossRef]
  188. Guanter, L.; Kaufmann, H.; Segl, K.; Foerster, S.; Rogass, C.; Chabrillat, S.; Kuester, T.; Hollstein, A.; Rossner, G.; Chlebek, C.; et al. The EnMAP spaceborne imaging spectroscopy mission for earth observation. Remote Sens. 2015, 7, 8830–8857. [Google Scholar] [CrossRef]
  189. Lausch, A.; Schmidt, A.; Tischendorf, L. Data mining and linked open data—New perspectives for data analysis in environmental research. Ecol. Model. 2015, 295, 5–17. [Google Scholar] [CrossRef]
  190. Bizer, C. The emerging web of linked data. IEEE Intell. Syst. 2009, 24, 87–92. [Google Scholar] [CrossRef]
  191. Wilkinson, M.D.; Dumontier, M.; Aalversberg, I.J.; Appleton, G.; Axton, M. Comment: The FAIR Guiding Principles for scientific data management and stewardship. Nat. Commun. 2016, 3, 160018. [Google Scholar] [CrossRef] [PubMed]
  192. Pereira, H.M.; Ferrier, S.; Walters, M.; Geller, G.N.; Jongman, R.H.G.; Scholes, R.J.; Bruford, M.W.; Brummitt, N.; Butchart, S.H.M.; Cardoso, A.C.; et al. Essential Biodiversity Variables. Science 2013, 339, 277–278. [Google Scholar] [CrossRef] [PubMed]
  193. Lindstrom, E.; Gunn, J.; Fischer, A.; McCurdy, A.; Glover, L.K.; Members, T.T. A Framework for Ocean Observing; UNESCO: Paris, France, 2012. [Google Scholar]
  194. Bojinski, S.; Verstraete, M.; Peterson, T.C.; Richter, C.; Simmons, A.; Zemp, M. The concept of essential climate variables in support of climate research, applications, and policy. Bull. Am. Meteorol. Soc. 2014, 95, 1431–1443. [Google Scholar] [CrossRef]
  195. Goerre, S.; Egli, C.; Gerber, S.; Defila, C.; Minder, C.; Richner, H.; Meier, B. Impact of weather and climate on the incidence of acute coronary syndromes. Int. J. Cardiol. 2007, 118, 36–40. [Google Scholar] [CrossRef] [PubMed]
  196. Scholes, R.J.; Walters, M.; Turak, E.; Saarenmaa, H.; Heip, C.H.; Tuama, É.Ó.; Faith, D.P.; Mooney, H.A.; Ferrier, S.; Jongman, R.H.; et al. Building a global observing system for biodiversity. Curr. Opin. Environ. Sustain. 2012, 4, 139–146. [Google Scholar] [CrossRef]
  197. GOFC-GOLD. A Sourcebook of Methods and Procedures for Monitoring Essential Biodiversity Variables in Tropical Forests with Remote Sensing; GOFC-GOLD, Bon, Ed.; Wageningen University: Wageningen, The Netherlands, 2017. [Google Scholar]
  198. Esch, T.; Uereyen, S.; Asamer, H.; Hirner, A.; Marconcini, M.; Metz, A.; Zeidler, J.; Boettcher, M.; Permana, H.; Brito, F.; et al. Earth observation-supported service platform for the development and provision of thematic information on the built environment—The TEP-Urban project. In Proceedings of the 2017 Joint Urban Remote Sensing Event (JURSE), Dubai, United Arab Emirates, 6–8 March 2017. [Google Scholar]
  199. Ristoski, P.; Bizer, C.; Paulheim, H. Mining the Web of Linked Data with RapidMiner. J. Web Semant. 2015, 35, 142–151. [Google Scholar] [CrossRef]
  200. Balazinska, M.; Franklin, M.J.; Gibbons, P.B.; Gray, J.; Nath, S.; Hansen, M.; Tao, V. Data Management in the Worldwide Sensor Web. IEEE Pervasive Comput. 2007, 6, 30–40. [Google Scholar] [CrossRef]
  201. Mazzocchi, F. Could Big Data be the end of theory in science? A few remarks on the epistemology of data-driven science. EMBO Rep. 2015, 16, 1250–1255. [Google Scholar] [CrossRef] [PubMed]
  202. Boulton, G. The challenges of a Big Data Earth. Big Earth Data 2018, 4471, 1–7. [Google Scholar] [CrossRef]
  203. Ma, Y.; Wu, H.; Wang, L.; Huang, B.; Ranjan, R.; Zomaya, A.; Jie, W. Remote sensing big data computing: Challenges and opportunities. Future Gener. Comput. Syst. 2015, 51, 47–60. [Google Scholar] [CrossRef]
  204. Berners-Lee, T.; Hendler, J.; Lassila, O. The Semantic Web. Sci. Am. 2001, 284, 34–43. [Google Scholar] [CrossRef]
  205. Berners-Lee, T. COMPUTER SCIENCE: Enhanced: Creating a Science of the Web. Science 2006, 313, 769–771. [Google Scholar] [CrossRef] [PubMed]
  206. Madin, J.S.; Bowers, S.; Schildhauer, M.P.; Jones, M.B. Advancing ecological research with ontologies. Trends Ecol. Evol. 2008, 23, 159–168. [Google Scholar] [CrossRef] [PubMed]
  207. Morsdorf, F.; Kükenbrink, D.; Schneider, F.D.; Abegg, M.; Schaepman, M.E. Close-range laser scanning in forests: Towards physically based semantics across scales. Interface Focus 2018, 8, 20170046. [Google Scholar] [CrossRef] [PubMed]
  208. Ristoski, P.; Paulheim, H. Semantic Web in data mining and knowledge discovery: A comprehensive survey. J. Web Semant. 2016, 36, 1–22. [Google Scholar] [CrossRef]
  209. Pey, B.; Laporte, M.A.; Nahmani, J.; Auclerc, A.; Capowiez, Y.; Caro, G.; Cluzeau, D.; Cortet, J.; Decaëns, T.; Dubs, F.; et al. A thesaurus for soil invertebrate trait-based approaches. PLoS ONE 2014, 9, e108985. [Google Scholar] [CrossRef] [PubMed]
  210. Paulheim, H. Automatic Knowledge Graph Refinement: A Survey of Approaches and Evaluation Methods. Semant. Web 2015, 8, 489–508. [Google Scholar] [CrossRef]
  211. Rennolls, K. A partial ontology for forest inventory and mensuration. In Proceedings of the 16th International Workshop on Database and Expert Systems Applications (DEXA’05), Copenhagen, Denmark, 22–26 August 2005; pp. 679–683. [Google Scholar]
  212. Smith, C.L.; Goldsmith, C.W.; Eppig, J.T. The Mammalian Phenotype Ontology as a tool for annotating, analyzing and comparing phenotypic information. Genome Biol. 2005, 6, R7. [Google Scholar] [CrossRef] [PubMed]
  213. Jaiswal, P. A Resource for a Common Reference Ontology for Plants. In Proceedings of the Plant and Animal Genome XXI Conference, San Diego, CA, USA, 12 January 2013; pp. 1–2. [Google Scholar]
  214. Oellrich, A.; Walls, R.L.; Cannon, E.K.; Cannon, S.B.; Cooper, L.; Gardiner, J.; Gkoutos, G.V.; Harper, L.; He, M.; Hoehndorf, R.; et al. An ontology approach to comparative phenomics in plants. Plant Methods 2015, 11, 10. [Google Scholar] [CrossRef] [PubMed]
  215. Lutz, M. Ontology-based Discovery and Composition of Geographic Information Services. Ph.D. Dissertation, Westfaelischen Wilhelms-Universit, Muenster, Germany, 2005. [Google Scholar]
  216. Arnaud, E.; Matteis, L.; Laporte, M.A.; Espinosa, H.; Hyman, G.; Shrestha, R.; Portugal, A.; Chibon, P.Y.; Devare, M.; Akintunde, A.; et al. The Crop Ontology, a resource for enabling access to breeders’ data. In Proceedings of the Plant and Animal Genome XXII Conference, San Diego, CA, USA, 14 Januray 2014. [Google Scholar]
  217. Ashburner, M.; Ball, C.A.; Blake, J.A.; Botstein, D.; Butler, H.; Cherry, J.M.; Davis, A.P.; Dolinski, K.; Dwight, S.S.; Eppig, J.T.; et al. Gene ontologie: Tool for the unification of biology. Nat. Genet. 2000, 25, 25–29. [Google Scholar] [CrossRef] [PubMed]
  218. Karam, N.; Fichtmueller, D.; Gleisberg, M.; Bohlen, V.; Tolksdorf, R.; Güntsch, A. The Terminology Server of the German Federation for Biological Data (GFBio)—Server and Service of Semantic Technologies in Scientific Environments; GFBio: Berlin, Germany, 2014. [Google Scholar]
  219. Bush, A.; Sollmann, R.; Wilting, A.; Bohmann, K.; Cole, B.; Balzter, H.; Martius, C.; Zlinszky, A.; Calvignac-Spencer, S.; Cobbold, C.A.; et al. Connecting Earth observation to high-throughput biodiversity data. Nat. Ecol. Evol. 2017, 1, 0176. [Google Scholar] [CrossRef] [PubMed]
  220. Asadi, A. Advanced Data Mining and Machine Learning Algorithms for Integrated Computer-Based Analyses of Big Environmental Databases; Eberhard Karls University: Tübingen, Germany, 2017. [Google Scholar]
  221. Gorelick, N.; Hancher, M.; Dixon, M.; Ilyushchenko, S.; Thau, D.; Moore, R. Google Earth Engine: Planetary-scale geospatial analysis for everyone. Remote Sens. Environ. 2017, 202, 18–27. [Google Scholar] [CrossRef]
  222. Nemani, R.; Votava, P.; Michaelis, A.; Melton, F.; Milesi, C. Collaborative Supercomputing for Global Change Science. EOS Trans. Am. Geophys. Union 2011, 92, 109. [Google Scholar] [CrossRef]
  223. Schreiber, L.R.; Bluhm, H. Toward a silicon-based quantum computer. Science 2018, 359, 393–394. [Google Scholar] [CrossRef] [PubMed]
  224. Sharma, R.; Trivedi, R.K. Literature review: Cloud Computing –Security Issues, Solution and Technologies. Int. J. Eng. Res. 2014, 3, 221–225. [Google Scholar] [CrossRef]
  225. Xiong, J.; Thenkabail, P.S.; Tilton, J.C.; Gumma, M.K.; Teluguntla, P.; Oliphant, A.; Congalton, R.G.; Yadav, K.; Gorelick, N. Nominal 30-m cropland extent map of continental Africa by integrating pixel-based and object-based algorithms using Sentinel-2 and Landsat-8 data on google earth engine. Remote Sens. 2017, 9, 1065. [Google Scholar] [CrossRef]
  226. Agapiou, A. Remote sensing heritage in a petabyte-scale: Satellite data and heritage Earth Engine© applications. Int. J. Digit. Earth 2017, 10, 85–102. [Google Scholar] [CrossRef]
  227. Johansen, K.; Phinn, S.; Taylor, M. Mapping woody vegetation clearing in Queensland, Australia from Landsat imagery using the Google Earth Engine. Remote Sens. Appl. Soc. Environ. 2015, 1, 36–49. [Google Scholar] [CrossRef]
  228. Aundeen, J.L.F.; Anengieter, R.L.K.; Uswell, M.D.B.U.S. Geological Survey Spatial Data Access. J. Geospat. Eng. 2002, 4, 145–152. [Google Scholar]
  229. Acker, J.G.; Leptoukh, G. Online Analysis Enhances Use of NASA Earth Science Data. EOS Trans. Am. Geophys. Union 2007, 88, 14–17. [Google Scholar] [CrossRef]
  230. Wagemann, J.; Clements, O.; Marco Figuera, R.; Rossi, A.P.; Mantovani, S. Geospatial web services pave new ways for server-based on-demand access and processing of Big Earth Data. Int. J. Digit. Earth 2018, 11, 7–25. [Google Scholar] [CrossRef]
  231. Neitzel, F.; Klonowski, J. Mobile 3D Mapping with a Low-Cost Uav System. ISPRS Int. Arch. Photogramm. Remote Sens. Spat. Inf. Sci. 2012, 39–44. [Google Scholar] [CrossRef]
  232. Eberle, J.; Clausnitzer, S.; Hüttich, C.; Schmullius, C. Multi-Source Data Processing Middleware for Land Monitoring within a Web-Based Spatial Data Infrastructure for Siberia. ISPRS Int. J. Geo-Inform. 2013, 2, 553–576. [Google Scholar] [CrossRef]
  233. Hardisty, A.R.; Bacall, F.; Beard, N.; Balcázar-Vargas, M.-P.; Balech, B.; Barcza, Z.; Bourlat, S.J.; De Giovanni, R.; de Jong, Y.; De Leo, F.; et al. BioVeL: A virtual laboratory for data analysis and modelling in biodiversity science and ecology. BMC Ecol. 2016, 16, 49. [Google Scholar] [CrossRef] [PubMed]
  234. McIlraith, S.A.; Son, T.C.; Zeng, H. Semantic Web services. IEEE Intell. Syst. 2001, 16, 46–53. [Google Scholar] [CrossRef]
  235. Martin, D.; Paolucci, M.; McIlraith, S.; Burstein, M.; McDermott, D.; McGuinness, D.; Parsia, B.; Payne, T.; Sabou, M.; Solanki, M.; et al. Bringing Semantics to Web Services: The OWL-S Approach; Springer: Berlin/Heidelberg, Germany, 2005; pp. 26–42. [Google Scholar]
  236. Sudmanns, M.; Tiede, D.; Lang, S.; Baraldi, A. Semantic and syntactic interoperability in online processing of big Earth observation data. Int. J. Digit. Earth 2018, 11, 95–112. [Google Scholar] [CrossRef] [PubMed]
  237. Kiker, G.A.; Bridges, T.S.; Varghese, A.; Seager, T.P.; Linkov, I. Application of Multicriteria Decision Analysis in Environmental Decision Making. Integr. Environ. Assess. Manag. 2005, 1, 95. [Google Scholar] [CrossRef] [PubMed]
  238. Díaz, S.; Demissew, S.; Carabias, J.; Joly, C.; Lonsdale, M.; Ash, N.; Larigauderie, A.; Adhikari, J.R.; Arico, S.; Báldi, A.; et al. The IPBES Conceptual Framework—Connecting nature and people. Curr. Opin. Environ. Sustain. 2015, 14, 1–16. [Google Scholar] [CrossRef]
  239. Jelokhani-Niaraki, M.; Sadeghi-Niaraki, A.; Choi, S.M. Semantic interoperability of GIS and MCDA tools for environmental assessment and decision making. Environ. Model. Softw. 2018, 100, 104–122. [Google Scholar] [CrossRef]
  240. Altintas, I.; Berkley, C.; Jaeger, E.; Jones, M.; Ludascher, B.; Mock, S. Kepler: An extensible system for design and execution of scientific workflows. In Proceedings of the 16th International Conference on Scientific and Statistical Database Management, Santorini Island, Greece, 21–23 June 2004; pp. 423–424. [Google Scholar]
  241. Deelman, E.; Vahi, K.; Juve, G.; Rynge, M.; Callaghan, S.; Maechling, P.J.; Mayani, R.; Chen, W.; Ferreira da Silva, R.; Livny, M.; et al. Pegasus, a workflow management system for science automation. Future Gener. Comput. Syst. 2015, 46, 17–35. [Google Scholar] [CrossRef]
  242. Berthold, M.R.; Cebron, N.; Dill, F.; Gabriel, T.R.; Kötter, T.; Meinl, T.; Wiswedel, B. KNIME—The Konstanz information miner: Version 2.0 and beyond. AcM SIGKDD Explor. Newsl. 2009, 11, 26–31. [Google Scholar] [CrossRef]
  243. Hofmann, M.; Klinkenberg, R. (Eds.) RapidMiner: Data Mining Use Cases and Business Analytics Applications; CRC Press: Boca Raton, FL, USA, 2013. [Google Scholar]
  244. Oinn, T.; Addis, M.; Ferris, J.; Marvin, D.; Senger, M.; Greenwood, M.; Carver, T.; Glover, K.; Pocock, M.R.; Wipat, A.; et al. Taverna: A tool for the composition and enactment of bioinformatics workflows. Bioinformatics 2004, 20, 3045–3054. [Google Scholar] [CrossRef] [PubMed]
  245. Wolstencroft, K.; Haines, R.; Fellows, D.; Williams, A.; Withers, D.; Owen, S.; Soiland-Reyes, S.; Dunlop, I.; Nenadic, A.; Fisher, P.; et al. The Taverna workflow suite: Designing and executing workflows of Web Services on the desktop, web or in the cloud. Nucleic Acids Res. 2013, 41, 557–561. [Google Scholar]
  246. Callahan, S.P.; Freire, J.; Santos, E.; Scheidegger, C.E.; Silva, C.T.; Vo, H.T. Managing the Evolution of Dataflows with VisTrails. In Proceedings of the 22nd International Conference on Data Engineering Workshops (ICDEW’06), Atlanta, GA, USA, 3–7 April 2006; p. 71. [Google Scholar]
  247. Goecks, J.; Nekrutenko, A.; Taylor, J.; Afgan, E.; Ananda, G.; Baker, D.; Blankenberg, D.; Chakrabarty, R.; Coraor, N.; Goecks, J.; et al. Galaxy: A comprehensive approach for supporting accessible, reproducible, and transparent computational research in the life sciences. Genome Biol. 2010, 11, R86. [Google Scholar] [CrossRef] [PubMed]
  248. Bizer, C.; Heath, T.; Berners-Lee, T. Linked data-the story so far. Int. J. Semant. Web Inf. Syst. 2009, 5, 1–22. [Google Scholar]
  249. Zhao, Z.; Martin, P.; Grosso, P.; Los, W.; De Laat, C.; Jeffrey, K.; Hardisty, A.; Vermeulen, A.; Castelli, D.; Legre, Y.; et al. Reference model guided system design and implementation for interoperable environmental research infrastructures. In Proceedings of the 11th IEEE International Conference eScience, Munich, Germany, 31 August–4 September 2015; pp. 551–556. [Google Scholar]
Figure 1. Schematic diagram of the different levels of forest organization from genes up to forest types showing characteristics of phylodiversity, taxonomic diversity, structural diversity, functional and trait diversity. It also shows how the different characteristics of the processes (the extent, process intensity, process consistency, resilience, and their characteristics) all influence the resilience of forest health (modified after Trumbore et al. [2]) and Lausch et al. [24].
Remotesensing 10 01120 g001
Figure 2. Quantitative indicators used by the seventh FOREST EUROPE Ministerial Conference in October 2015. Source after the United Nations Report “State of Europe’s Forests 2015”. FOREST EUROPE, 2015: State of Europe’s Forests 2015.
Remotesensing 10 01120 g002
Figure 3. Linking different approaches (high frequency wireless sensor networks up to spaceborne satellites) with relative frequency monitoring, sensors, and different platforms of remote sensing to better describe, explain, predict, and understand forest health with remote sensing techniques as well as improve the calibration and validation of remote-sensing data (modified after Borg [105]).
Remotesensing 10 01120 g003
Figure 4. Overview of in situ approaches—the phylogenetic species concept (PSC), the biological species concept (BSC), the morphological species concept (MSC), and the remote sensing—spectral trait/spectral trait variation concept (RS-ST/STV-C), which integrates the close-range remote sensing—spectral traits/spectral trait variations approach (CR-RS-ST/STV-C) and the air/spaceborne remote sensing—spectral traits/spectral trait variations approach (AS-RS-ST/STV-C). The different in situ and remote sensing approaches are crucial for determining phylodiversity, taxonomic diversity, trait diversity, structural diversity as well as functional diversity, in order to be able to monitor and assess status, stress, shifts, disturbances, or resource limitations at different levels of forest organization.
Remotesensing 10 01120 g004
Figure 5. Schematic diagram showing a chain of effects on forest health with (a) the impacts of different drivers and processes such as land-use intensity, logging, fragmentation, or infestations in forest ecosystems. After the impact of these different drivers, vegetation reactions in forest ecosystems follow, (b) thus leading to changes in traits and trait variations. (c) The spectral response can be measured with close-range as well as airborne and spaceborne remote sensing (RS) data. The diagram (d) shows an example of the hyperspectral spectrum response, based on the impact of fire. This process of change from forest traits to forest trait variations is a fundamental principle that runs from close-range remote-sensing approaches (wireless sensor networks, camera traps or towers with sensors), extending to airborne and spaceborne RS data. Diagram (d) was produced by Dr. Daniel Spengler, GfZ, Germany.
Remotesensing 10 01120 g005
Figure 6. Components of data science which are important for realizing a multi-source forest heath monitoring network (MUSO-FH-MN).
Remotesensing 10 01120 g006
Figure 7. Conceptual overlap of all projects for defining Essential Variables (EV); Essential Variables for Weather—EVW, (led by WMO/GAW–World Meteorological Organization/Global Atmosphere Watch, Essential Ocean Variables—EOV (led by the GOOS–Global Ocean Observing System), Essential Climate Variables—ECV (led by GCOS–Global Climate Observing System), Essential Biodiversity Variables—EBV (led by GEOBON—Group on Earth Observations Biodiversity) and the GeoEssential Variables—GEO EV (led by the actual project (http://www.geoessential.net/) (modified after Lindstrom et al. [193]).
Remotesensing 10 01120 g007
Figure 8. Schematic diagram of the Semantic Web or web 4.0 to bridge the gap by linking human and computer-driven big data on forest health with high volume, velocity, variety, and veracity, documents, indicators, models, monitoring approaches, measuring instruments such as sensors, satellites, wireless sensor networks on different platforms and on different scales of forest ecosystems, as well as decision makers, forest managers, scientists, and stakeholders.
Remotesensing 10 01120 g008
Figure 9. Semantic networks or knowledge graphs, http://www.eneon.net/graph. (a) Overview of a semantic network or knowledge graph; (b) section of a semantic network or knowledge graph for the object “GEOBON”, modified after http://www.eneon.net/graph/.
Remotesensing 10 01120 g009
Figure 10. Illustration of a semantic network showing the benefits of semantically linked phenotypes and traits compared to traditional approaches. The forest pests Ips typographus and the Pityogenes chalcographus are described according to traditional language that is (a,b) connected to data in existing databases such as specimen databases (Global Biodiversity Information Facility—GBIF—Global Biodiversity Information Facility, or ZooBank) (c). In the query, this procedure is an actual taxonomic practice. An ecologist, biologist, or forester (upper left) queries the body of ecological knowledge and fails to discover the pest Pityogenes chalcographus when reading traditional language manually (e). However, he finds Ips typographus and Pityogenes chalcographus when using the logic inherent in ontologies to query across semantic phenotypes (f). A vast amount of genotype data has already been collected in the model organism database (MOD), so that it can be integrated into semantic web models (d) [217]. In our example, ecologists or taxonomists use phenotypes and trait annotations (such as morphology, physiology, behavior, and other phenotypic traits) (g) to build logical rules and reference anatomy/morphology and trait ontologies. This example from the field of forest ecology is simplified to illustrate the major connections. A diagram representing a semantic phenotype within an explicit logical model would be far more complex: basically, an individual specimen might be asserted to be an instance of a Web Ontology Language (OWL) class expression such as has_part some (pronotum and bearer_of some dark brown metallic). That this method of semantic linking can be carried out for all domains of forest health is demonstrated by the example on the right with the tree species Picea abis and Picea glauca conica (modified after Deans et al. [162]).
Remotesensing 10 01120 g010
Figure 11. Conceptual model of the semantic network to describe the relationships of complex information or entities of forest ecosystems based on the most powerful semantic web language—the Web Ontology Language (OWL).
Remotesensing 10 01120 g011
Figure 12. Concept of knowledge discovery in databases (KDD), with the important steps: pre-processing, data mining, and information evaluation by the end user. During these three steps, the effective information will be extracted from big databases by KDD (modified after Asadi [220]).
Remotesensing 10 01120 g012
Figure 13. Diagram showing the components that need to be included for a future multi-source forest health monitoring network (MUSO-FH-MN). (i) Integration of existing data, networks, and platforms; (ii) linking of existing monitoring approaches as well as (iii) the use of data science as a bridge for handling and coupling big forest health data with volume, velocity, variety, and veracity. Data science consists in turn of numerous components—digitalization, standardization, Semantic Web, proof, trust and uncertainties, data science analysis tools for scientists, data managers, and stakeholders, which cannot always be separated from one another, but are crucial for establishing a future multi-source forest health monitoring network. In this respect, the Semantic Web forms the basis for the linkage and handling of big FH data with high volume, velocity, variety, and veracity (modified after Lausch et al. [34]).
Remotesensing 10 01120 g013
Table 1. Long-term monitoring programs of forest health at the country, European and the global level (modified after Lausch et al. [1]).
Level/ScaleResponsible BodyDescriptionResources/Links
Country level: GermanyJohann Heinrich von Thünen-Institute,
Federal Research Institute for Rural Areas, Forestry and Fisheries
in cooperation with other institutions (Thünen Institute of Forest Ecosystems, Thünen Institute of International Forestry and Forest Economics)
Forest condition monitoring (FCM)
Level-I Monitoring
Frequency: annual
Compilation of national reports on forest conditions for Germany (FCA—Forest Conservation Act). Forest health (FH) assessed using systematic sample grid of permanent plots.
[35]
Johann Heinrich von Thünen-Institute,
Federal Research Institute for Rural Areas, Forestry and Fisheriesin cooperation with other institutions (Thünen Institute of Forest Ecosystems, Thünen Institute of International Forestry and Forest Economics)
Intensive monitoring
Level-II Monitoring
Frequency: continuous
66 sites intensively monitored, partly through continual sampling of relevant ecosystem compartments in selected forest ecosystems.
[36]
Johann Heinrich von Thünen-Institute, Federal Research Institute for Rural Areas, Forestry and Fisheries
in cooperation with the Federal Ministry for Food and Agriculture
supported by the European Union (EU) and the Food and Agriculture Organization of the United Nations (FAO)
National Forest Inventory (NFI)
Level-III Monitoring
Frequency: every 10 years
Status and development of the forests of Germany derived from a sample-based large-scale forest inventory
45 countries are integrated into the NFI.
[37]
Country level: USAUnited States Department of Agriculture(USDA) Forest ServiceFH Monitoring (M)
Frequency: annual
National program designed to determine the status, changes, and trends in indicators of forest condition on an annual basis.
[38]
Country level: ChinaState Forestry Administration of ChinaNational Forest Inventory including the protocol for Monitoring Forest Health
Frequency: five years
Since 2004, components that monitored the health status and ecological functions of forest ecosystems were added to the NFI.
[6,39]
Country level: CanadaCanadian Forest Service (CFS)National FHM Network
Frequency: 5-years
Established in 1994 based on earlier Acid Rain Monitoring Network. Plot-based biannual to five-year repetition depending on the variables.
[40]
National Forest Inventory (NFI), CanadaNational Forest Inventory
Frequency: 10 years
Mixed plot and remote sensing (RS)-based. Includes inventory parameters and assessment of insect, disease, fire, and other disturbance damage.
[41]
European levelUnited Nations Economic Commission for Europe (UNECE)ICP Forest: the International Co-operative Programme on Assessment and Monitoring of Air Pollution Effects on Forests
Frequency: annual
Level 1: Long-term monitoring, 6000 sampling sites in Europe with 16 km2
Level 2: Long-term intensive sites, for process-orientated study
Effects on Forest. Developed to standardize the recording of different FH indicators on three levels of intensity.
ICP Forest Manuals:
Development of standardized measurement protocols
http://icp-forests.net/page/icp-forests-manual
[42]
European Union (EU)FOREST EUROPE-ProgramEuropean Union (EU)
Global level (45 countries)Food and Agriculture Organization of the United Nations (FAO)National Forest Inventory (NFI)
Frequency: every 10 years; 45 countries are integrated into the NFI
[41]
Global levelFood and Agriculture Organization of the United Nations (FAO)Forest Resources Assessment
Frequency: five yearsFH recorded by the FAO as part of the Forest Resources Assessment (FRA). Individual countries report their findings to the FAO, which then compiles a report.
FAO FRA Terms and Definitions:
Development of standardized measurement protocols (http://www.fao.org/docrep/017/ap862e/ap862e00.pdf)
[43]
Harmonization Initiatives
European level Forest Information System for Europe—(FISE)http://data.jrc.ec.europa.eu/collection/FISE; http://fise.jrc.ec.europa.eu/)
Global level Global Forest Observations Initiative (GFOI)(http://www.gfoi.org/about-gfoi/)
The Food and Agriculture Organization (FAO)Global Forest SurveyEstablish a global network of systematic sampling plots to understand forest ecosystems’ characteristics and health status, and create a global web-based platform where forest data are available and freely shared.http://www.fao.org/in-action/global-forest-survey/en/
Table 2. Existing networks and activities that should be included in a future multi-source forest health monitoring network (MUSO-FH-MN).
AcronymNameLinkReference
USFS FIA programUnited States Forest Service (USFS) Forest Inventory and Analysis (FIA) databasehttps://www.fia.fs.fed.us/
https://www.fia.fs.fed.us/tools-data/index.php
[59,60]
TreeDivNETGlobal network of tree diversity experimentshttp://www.treedivnet.ugent.be/[61]
T4FTrees4Futurehttp://www.trees4future.eu/database-access.html[62]
FunDivEUROPE Exploratory PlatformFunctional significance of forest biodiversityhttp://project.fundiveurope.eu/[63]
BIOTREE-NETBIOTREE—BIOdiversity and ecosystem processes in experimental TREE standshttp://portal.biotreenet.com/[10,64]
Global Forest WatchGlobal Forest Watchhttp://www.globalforestwatch.org/[65,66]
GFOIGlobal Forest Observations Initiativehttp://www.gfoi.org/[66]
GENFOREDForest genetic trials networkhttps://sites.cita-aragon.es/genfored/en/welcome-to-the-genfored-web-site/
EUFORGENEuropean forest genetic resources programhttp://www.euforgen.org/[67]
Table 3. Characteristics of phenotypes and traits.
CharacteristicsPhenotypesTraits
Indicators and filters of status, stress, disturbances, and resource limitations.[160][24]
Can be recorded on all levels of biological organization, as well as in different domains.[160,161][164]
Standardized measurements are possible.[165][166,167,168,169,170]
Can be transferred through a human–computer communication interpretable language in digital form, and can be integrated into the entire system.[160,171][172,173]

