Characterization of the Natural Colloidal TiO2 Background in Soil
by
 , and
, and
Allan Philippe
1,* ,
,
Daniel Armando Campos
1,
Jean-Michel Guigner
2,
Christian Buchmann
1,
Dörte Diehl
1 and
Gabriele E. Schaumann
1 1
Group of Environmental and Soil Chemistry, Institute for Environmental Sciences, University of Koblenz-Landau, Fortstrasse 7, 76829 Landau, Germany
2
Institut de Minéralogie, de Physique des Matériaux et de Cosmochimie (IMPMC), Sorbonne University, UMR CNRS 7590, MNHN, IRD UR 206, 75252 Paris CEDEX 05, France
*
Author to whom correspondence should be addressed.
Separations 2018, 5(4), 50; https://doi.org/10.3390/separations5040050
Submission received: 27 August 2018
/
Revised: 26 September 2018
/
Accepted: 4 October 2018
/
Published: 20 October 2018
(This article belongs to the Special Issue Analytic Techniques for Nano- and Microparticles Analysis)
Abstract
:An increasing amount of TiO2 engineered nanoparticles (TNP) is released into soils and sediments, increasing the need for dedicated detection methods. Titanium is naturally present in soils at concentrations typically much higher than the estimated concentrations for TNP. Therefore, a precise knowledge of this natural background, including the colloidal fraction, is required for developing adapted strategies for detecting TNP. In this study, we characterized the natural colloidal Ti-background by analyzing eight soils with different properties and origins. A combination of X-ray fluorescence analysis and ICP-OES was used for determining the silicate bound fraction, which was a minor fraction for all soils (0–32%). The colloidal fraction obtained by extracting colloids from soil prior to ICP-OES measurements ranged between 0.3% and 7%. Electron microscopy and hydrodynamic chromatography confirmed that Ti in the form of colloids or larger particles was mostly present as TiO2 minerals with a fraction smaller than 100 nm. The size distribution mode of the extracted colloids determined using hydrodynamic chromatography ranged between 80 and 120 nm. The chromatograms suggested a broad size distribution with a significant portion below 100 nm. In addition to these data, we also discuss possible implications of our findings for the method development for detecting TNP in soils.
1. Introduction
Titanium dioxide (TiO2) is an inexpensive and versatile material often used in particulate form, sometimes as nanoparticles, in sunscreens [1,2], cosmetics [3], paints [4], and photoactive materials [5], for instance. Concerns have been raised about its accumulation in the environment, since it is non-degradable under environmental conditions [4,6,7]. TiO2 engineered particles can reach soils through atmospheric deposition, flooding events, biota or human-mediated transfer from aquatic phase, application of sludge, or improper waste disposal [8,9]. TiO2 nanoparticles may have direct adverse effects on ecosystems [10] or indirect once it enters the trophic chain [11]. However, the relevance of these effects under real environmental conditions is still largely unknown due to natural Ti-containing particles in soil, where their role in the ecosystem is not described yet [12], and which cannot be analytically distinguished with current methods.
Therefore, there is a strong need for methods dedicated to the quantification of TiO2 engineered nanoparticles in soils in the presence of natural Ti-containing particles. Whilst methods using single particle-inductively coupled plasma-mass spectrometry (SP-ICP-MS) were developed for aqueous samples [13], and despite their recent applications for the detection of metallic nanoparticles in soil have been reported [14,15], no method is currently available for Ti-containing colloids in soil samples due to the high natural Ti-background. Indeed, the median Ti-concentration in top soils and sediments is around 6 mg g−1 in European soils [16]. Therefore, a method to analytically or physically separate TiO2 engineered nanoparticles from the natural Ti background is required. This development is currently hindered by the lack of information about the nature of this background, in particular, the colloidal fraction.
In nature, soil-born Ti-minerals form after weathering of primary rocks or by re-precipitation of dissolved Ti-Fe minerals [17]. Their geochemistry is well-studied and the most common minerals are ilmenite, rutile, brookite, and more rarely anatase [17]. Most of the TiO2 minerals in soil are in the 50–125 µm size range and are usually separated from clays using density-based separation, magnetic separation, or selective dissolution of clay minerals [17]. However, much less information is available for colloids containing Ti. Indeed, most investigations of soil colloids focused on clays, natural organic matter, and iron oxides [18,19,20], or considered the complete colloidal fraction as a whole without differentiating between the various types of minerals [19,21,22,23]. Therefore, the aim of this study is to provide information about the nature of the Ti-background in the soil. In this context, we were interested more specifically in the distribution of Ti between TiO2 minerals and clays, and on the nature and relative number of Ti-containing colloids.
Inspired by previously developed methods for extracting nanoparticles from soil [14,15,19,21,24,25], we investigated 8 soils, which differ in terms of grain size distribution, organic matter content, and origin (river sediments, forest soil, agricultural soils, peat, native tropical soil), for their Ti-content. To estimate the relevance of the silicate-bound and colloidal fractions of the Ti-containing particles, we determined the total Ti-concentration (X-ray fluorescence analysis, XRFA), the acid-soluble fraction (inductively coupled plasma optical emission spectrometry, ICP-OES), and the colloidal fraction (extraction and ICP-OES). Furthermore, we analyzed the particles containing Ti in soils and colloidal extracts using electron microscopy and hydrodynamic chromatography coupled with ICP-MS (HDC-ICP-MS) for size and composition determination. We also discuss possible implications of our findings for the development of analytical methods dedicated to the detection of engineered TiO2 nanoparticles in soils.
2. Materials and Methods
2.1. Soil Sampling and Characterization
To have a fairly representative set of soils, we selected soils with contrasting characteristics (Table 1). The first sample was a commercial purified quartz sand from Frechen’s deposit in Germany (commercial name: F 34, Quarzwerke, Frechen, Germany) with a grain size of 0.2 mm. It was chosen as an extreme case of a sandy soil. The purification steps mentioned by the supplier included desludging, hydroclassification, and drying. Soil number two was collected in a wooded area next to the River Rhine near Karlsruhe, Germany (latitude: 49.137078°; longitude: 8.361419°). The site is rarely flooded. Owing to the proximity of industrial and urban activities, this site had the highest chance to be contaminated with anthropogenic materials. The soils number three to five were standard agricultural soils (RefeSols, Standard soil type number 2.1, 2.3, and 6S, respectively) from the Landwirtschaftliche Untersuchungs-und Forschungsanstalt Speyer (LUFA, Speyer, Germany). They are natural soils commonly occurring in Germany, which were not treated with biocides or organic fertilizers for at least five years. The three types of soils were selected for having strongly differing particle size distribution (sandy to clayey soils). Soil number six was sampled in a meadow next to the river Queich (Offenbacher Wässerwiesen, east of Landau in der Pfalz, Germany, latitude: 49.200704°, longitutde: 8.185192°). The meadow has been artificially flooded four times per year and fertilized with calcium ammonium nitrate. Soil number seven was sampled in a marsh next to the Prestel Lake (Graben-Neudorf, Baden-Wüttemberg, Germany). It is a peat-soil from reeds and sedges. We chose soils six and seven for their high organic content. Soil number eight was a river sediment sampled in the Tambopata National Reserve in the southeastern Peruvian rainforest region, in the Madre de Dios department/state. The site was at a small tributary of the Malinowski River called “La India” (latitude: −13.003579°, longitude: −69.750689°). The site is seasonally flooded. We consider this remote site as a native soil, since human activities were rather unlikely in this zone. Therefore, soil number eight should not be contaminated with anthropogenic Ti. Furthermore, the peat soil S7 and the three standard agricultural soils S3–5 should not have significant input of anthropogenic Ti, since pollution was limited in the corresponding sampling sites. However, contamination was expected for S2 and S6, since they were close to urban areas. Nonetheless, the expected input of anthropogenic Ti, which is mainly particulate TiO2, to sediment and soil was estimated to be of several orders of magnitude lower than the total Ti-concentrations measured in our samples as reported below [8,9]. All soils were dried and sieved (2 mm) before storage. In the following text, we refer to soil samples by “S” followed by the corresponding soil number.
Electrical Conductivity (EC) and pH were measured with a Consort C683 pH-meter using 3–5 grams of soil suspended in pure water (resistivity = 18.2 MΩ/cm) for EC and in a 0.01 M CaCl2 solution (soil:liquid ratio: 1:2) for pH. The tubes were shaken vigorously and left to stand for about two hours prior to measurements.
For CHNS elemental analysis, 15–20 mg of milled (Pulverisette 7 (Fritsch GmbH, Idar-Oberstein, Germany)) soil samples were weighed into tin boats (LabNeed GmbH, Nidderau, Germany) together with around 30 mg of WO3 powder (LabNeed GmbH, Nidderau, Germany). Each soil was measured in triplicates using a CHNS varioMicroCUBE (Elementar, Langenselbold, Germany). Sulfanilamide (N = 16.25%, C = 48.81%, H = 4.65%, S = 18.62%; Elementar GmbH, Langenselbold, Germany) was used as a reference sample.
Particle size distribution of the complete soil samples was determined, when not provided by the supplier, using an LS Coulter Series instrument (Beckman Coulter, Krefeld, Germany). Then, 0.5 g of sample was suspended in 3 mL of 0.1 M Na4P2O7 solution and ultra-sonicated (ultrasounds bath) for 10 min, for dispersing efficiently clay minerals [26,27]. The silt (<63 µm) and clay (<2 µm) thresholds were determined from the obtained size distribution histograms.
2.2. X-ray Fluorescence Analysis (XRFA)
S1–6 and S8 were ground in a mortar, dried, and 0.6 g was mixed with 3.6 g of Fluxana® borate mixture. This mixture was molten in Pt/Au-crucibles in a Rotormelt® induction oven at 1000 °C for 6 min. The melt was poured into a 26 mm Pt/Au-mold and cooled down quickly for obtaining a glassy matrix. The loss on ignition was determined for each soil after 1 h at 1000 °C and ranged between 0.22% and 22%. Since S7 had a relatively high Sulphur content, the production of a melting tablet was compromised and a pressed tablet was produced instead. Therefore, for S7, 6 g of ground and dried soil were mixed with 1.5 g of Hoechst® C-Wax and homogenized with a dental vibrator, and pressed in 40 mm Aluminum cups at a pressure of 20 ton-force. The melt or pressed tablets were measured using a Philips® WD-RFA PW 2400 X-ray fluorescence spectrometer. Quality control was based on two reference samples calibrated using a set of 25–30 reference materials (e.g., Syenit SY-2, CRB-GmbH, Hardegsen, Germany) and mass balance (sum of detected element concentrations compared to weighed mass).
2.3. Inductively Coupled Plasma Optical Emission Spectroscopy (ICP-OES)
The soil samples and the colloidal extracts were digested in a piranha acid mixture [2], allowing organic matter mineralization and dissolution of TiO2 minerals. However, silicates were not dissolved, as explained in Reference [28].
All glassware was cleaned in a 5% sulfuric acid bath prior to use. In a 15 mL glass beaker, 2.5 mL of hydrogen peroxide (30%, Rotipuran®, Carl Roth GmbH, Karlsruhe, Germany) was added to 50 mg of soil and left to stand for 10 min before the dropwise addition of 5 mL of sulfuric acid (95%, Rotipuran®, Carl Roth GmbH, Karlsruhe, Germany). After standing for 15 min, the beaker was covered by a watch glass and heated progressively until ebullition (approximately at 230 °C) for two hours. The mixture was cooled to room temperature, quantitatively transferred into a 100 mL volumetric flask, and filled with ultrapure water (resistivity 18.2 MΩ cm, Reinstwassersystem EASYpure II™, Werner GmbH, Leverkusen, Germany). Fifty millimeters of this suspension was transferred to polypropylene centrifuge tubes and centrifuged (Multifuge 4R. Heraeus, GmbH, Hanau, Germany) at 4418 g for 30 min. At this g-value, a spherical particle having a diameter of 188 nm and a density of 2.6 g cm−3 migrates over a distance equal to the tube length in 30 min. Ten milliliters of the supernatant was then transferred to a polypropylene tube prior to ICP-OES analysis.
The Ti measurements were carried out with an Agilent 720 Series ICP Optical Emission Spectrometer at an emission wavelength of 334.188 nm. We applied a matrix-matched calibration using TiO2 (P-25, Degussa, Frankfurt, Germany) particles, which were digested following the same procedure that was used for the samples. Ionic standards and reference materials were used for monitoring the performance of the instrument. All samples were measured in triplicates.
2.4. Extraction of Colloids
Two hundred milligrams of oven-dried (100 °C, overnight) soil was weighed in a 15 mL polypropylene centrifuge tube and six milliliters of a 0.1% Triton-X100 aqueous solution (Alfa Aesar; Karlsruhe, Germany) at a pH value of 12.17, set by adding NaOH (>99%, Carl Roth GmbH, Karlsruhe, Germany), was added. The tube was vortexed for 10 s, sonicated for 15 min in a sonication bath, vortexed for 10 s again, and centrifuged (Universal 320, Hettich, Bäch, Switzerland) at 2000 rpm (648 g) for 5 min. At this g-value, a spherical particle having a diameter of 1.2 µm and a density of 2.6 g cm−3 migrates over a distance equal to the tube length in five minutes.
Then, for S1–4 and S7–8, 0.5 mL of supernatant was then carefully pipetted into 1.5 mL a polypropylene HPLC vial. For S5–6, a dilution step was required due to the high particle content, therefore, 150 µL of supernatant was added to 1.35 mL of the Triton-X100 solution in a 1.5 mL polypropylene HPLC vial. The samples were then analyzed using HDC-ICP-MS. Another subsample of 1 mL of supernatant was transferred into a 30 mL glass beaker, dried at 110 °C, and digested following the same procedure used for the soil samples. All samples were measured in triplicates.
2.5. Hydrodynamic Chromatography Coupled to Inductively Coupled Mass Spectrometry (HDC-ICP-MS)
Size separation of extracted colloids was achieved at room temperature using a PL-PSDA type 2 hydrodynamic-chromatography column (separation range: 20–1200 nm, Agilent, Waldbronn, Germany) connected to an HPLC system (Agilent 1220, Waldbronn, Germany). The eluent was an aqueous solution of 0.5 g L−1 sodium dodecyl sulfate (Alfa Aesar; Karlsruhe, Germany), 1 g L−1 Brij L23 (Alfa Aesar; Karlsruhe, Germany), and 1 g L−1 Triton X-100 (Alfa Aesar; Karlsruhe, Germany). The pH was adjusted to 11.37 with NaOH (Sigma Aldrich Inc., Steinheim, Germany). Previously characterized citrate-stabilized spherical gold nanoparticles with diameters between 30 and 250 nm were used for size calibration, as described in Reference [29]. Citrate-stabilized gold nanoparticles with a diameter of 5 nm (Sigma Aldrich Inc., Steinheim, Germany) were injected one minute after each sample for time marking, and as an internal standard. The flow-rate of the eluent was 2.6 mL min−1 and the injection volume was 60 µL for samples and 5 µL for the internal standard.
The ICP-MS detector was a quadrupole ICP-MS XSeries 2 (Thermo Scientific, Bremen, Germany) equipped with a PTFE spray chamber, thermostated with a Peltier cooler and a platinum sample cone. The instrument was tuned before each run using a tuning solution containing P25 TiO2 nanoparticles (Degussa, Frankfurt, Germany) suspended in the HDC eluent. The dwell time was 100 milliseconds. The isotopes: 47Ti, 27Al, 90Zr, 140Ce, and 197Au were measured without collision cell, whilst the isotopes: 47Ti, 56Fe, 60Ni, 55Mn, and 197Au were measured in a second run with collision cell (He-H2 mixture). The chromatograms obtained from the ICP-MS software were analyzed using the freeware program Unichrom (Unichrom, available from http://www.unichrom.com, 2018) and a homemade script written for the software R 3.5.0 (RStudio). The retention time of the internal standard was used to calculate the Retention factor, and the intensities were normalized by the main peak intensity of the corresponding chromatogram. The size distribution modes were determined from the peak retention time after a polynomial smoothing.
2.6. Scanning Electron Microscopy (SEM)
A small amount of soil sample was placed onto carbon-coated pin stubs and sputtered with gold using a sputter coater Q150R S (Quorum Technologies, West Sussex, UK). SEM images were recorded using a Quanta 250 scanning electron microscope (FEI Company; Bruker AXS Microanalysis, Berlin, Germany), under high vacuum mode using an Everhart Thornley detector. The elemental composition of the particles was determined using an energy dispersive x-ray detector (EDX; Quantax; Bruker, Berlin, country). At least, ten Ti-containing particles were imaged per soil sample except for S1, where it was not possible to find Ti-containing particles, and for S7, where only 3 particles could be observed.
2.7. High Resolution Transmission Electron Microscopy (HR-TEM)
One milliliter of soil extract was transferred to an Eppendorf tube and centrifuged (Heraeus Biofuge Fresco, Thermo Fisher Scientific, Schwerte, Germany) at 13,000 rpm (corresponding to 10,000–16,000 g) for ten minutes. The supernatant was removed carefully and a drop of the remaining residue (approximately 100 µL) was placed on a TEM grid and dried at ambient conditions. This pre-concentration step was necessary for observing several natural TiO2 nanoparticles in a reasonable amount of time.
Transmission Electron Microscopy (TEM) measurements were performed using a JEOL JEOL Ltd., Tokyo, Japan) 2100F, Field Emission Gun instrument operating at 200 kV equipped with a polar piece ultra-high resolution. Images were recorded on an UltraScan 4000 Gatan (Gatan Inc., Pleasanton, CA, United States) Camera with a 4096 × 4096 CCD. Elemental composition was determined using EDX with a JEOL XEDS detector with 140 eV resolution. Measurements were also carried out with a scanning TEM detector JEOL with a one nm probe operating in High Angle Annular Dark Field mode (HAADF), for obtaining a better composition contrast. EDX and scanning TEM were combined for elemental composition mapping. The diffraction images were analyzed using the programs ImageJ and Crystalmaker, combined with the RRUFF database.
3. Results and Discussion
3.1. Analytical Workflow
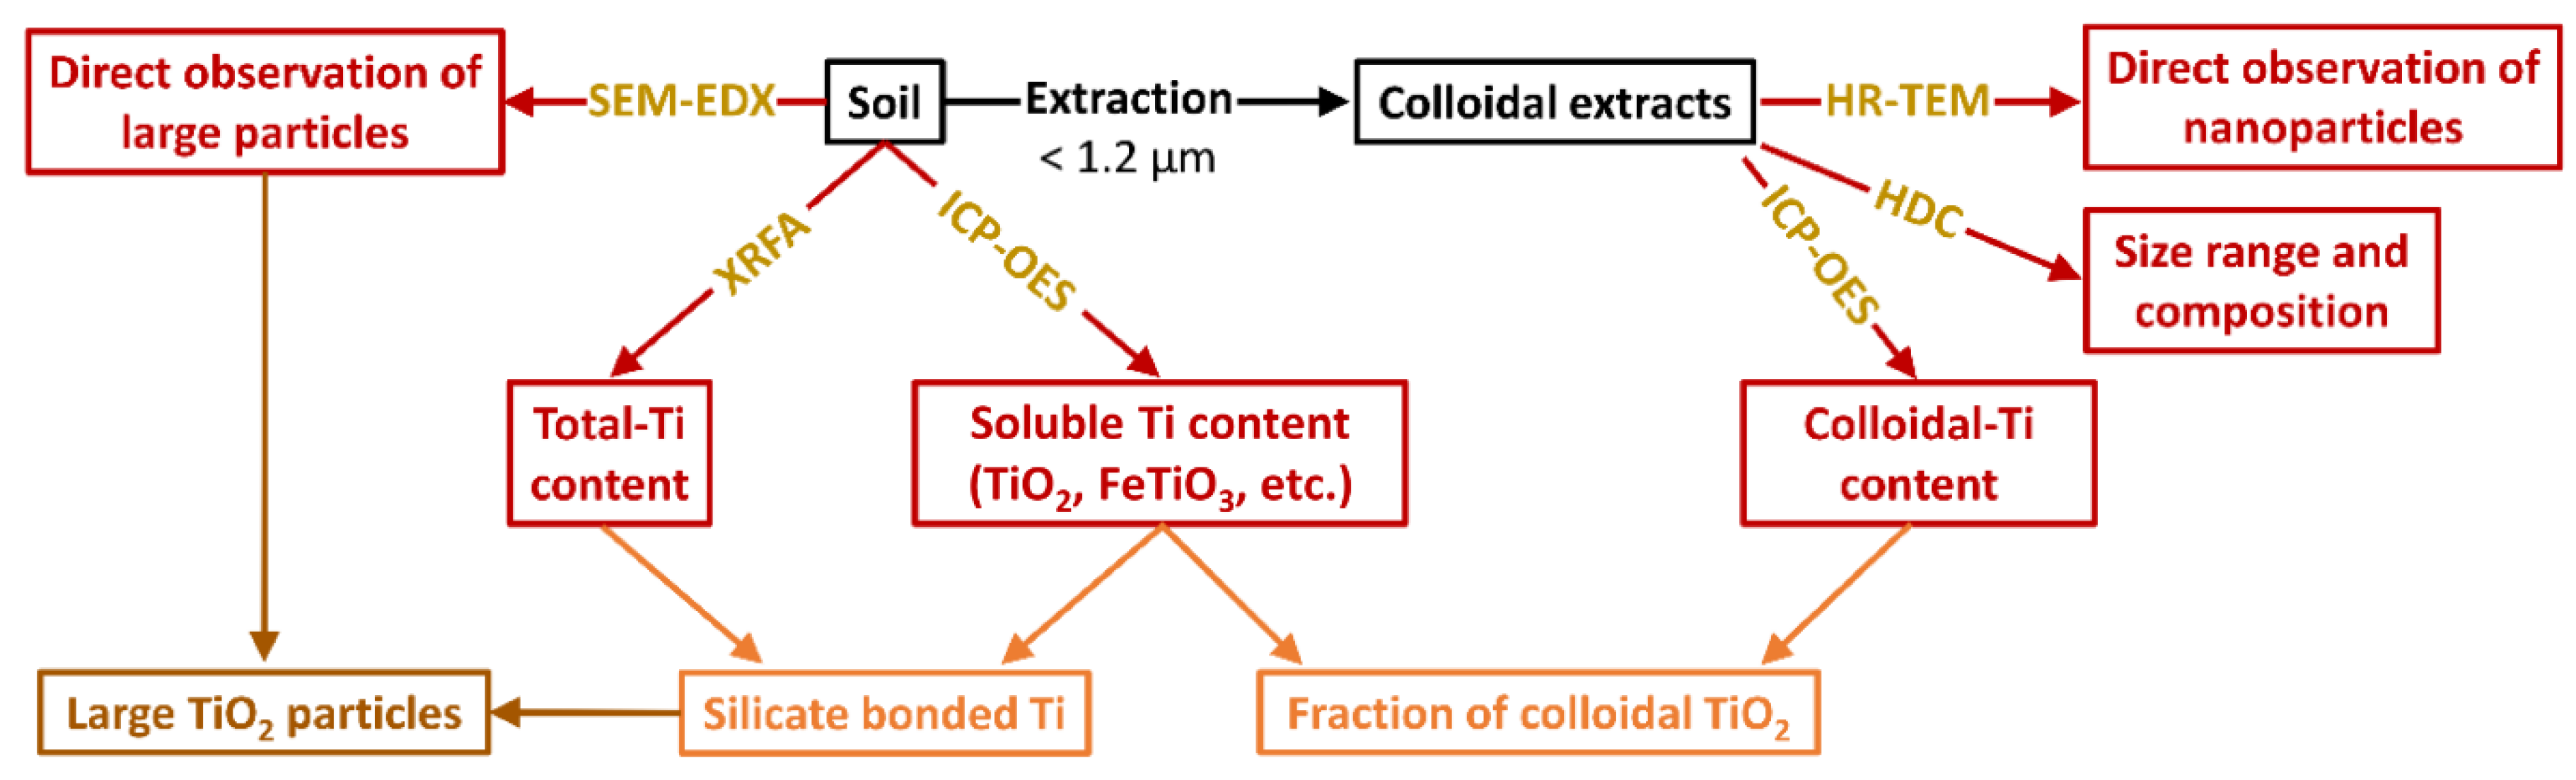
Our approach for characterizing the Ti-Background in soil was to combine the determination of Ti-concentration in soil and in colloidal extracts (cut-off approximately 1.2 µm), and to estimate the size and composition of Ti-containing particles using SEM, HR-TEM, and HDC-ICP-MS (Figure 1). XRFA and ICP-OES measurements provided the total Ti-concentration and the total soluble Ti, respectively. The discrepancy between these two methods originates from minerals containing Ti and being insoluble in hot sulfuric acid, with a diameter larger than 200 nm (estimated cut-off of the centrifugation step). In particular, SiO2 and aluminosilicates were insoluble with this digestion method. Thus, comparing the values from XRFA and ICP-OES allowed determination of Ti associated to silicates. We used SEM-EDX analyses to confirm qualitatively the composition of the Ti-containing minerals by direct observations, and to obtain a first idea of the particle size range. The morphology and elementary composition were also determined for a few nanoparticles extracted from S2 using HR-TEM.
Owing to the limited resolution and the high number of silicate particles, Ti-containing particles smaller than one micrometer could not be imaged using SEM analysis. To characterize this fraction, a colloidal extraction was conducted. The extraction method used in this study was a combination of previously reported methods for extracting nanoparticles from soil [14,15,19]. We used the combination of surfactant and ultrasound treatment for dispersing soil colloids before centrifugation. The only innovation with respect to previous works was the addition of NaOH in the extracting medium. The high pH value contributes to the stability of most soil colloids, while the presence of sodium cation improves the dispersion of clay minerals [30]. The cut-off of this extraction was estimated to be around 1.2 µm for a spherical averaged soil particle. However, the estimation of such cut-off is always uncertain due to the high diversity of soil particles. Therefore, the cut-offs reported in this study were rather indicative.
The Ti-concentrations of the colloidal extracts measured with ICP-OES were combined to the total Ti-contents determined using XRFA to calculate the colloidal fraction of the Ti-containing minerals in soils. Ti-containing colloids were further characterized for their size distribution using HDC-ICP-MS. This size distribution was compared with the ones of the main elements present in soil minerals. This gives hints on the associations between Ti-containing colloids and other soil colloids.
3.2 Ti-Concentration in Soils
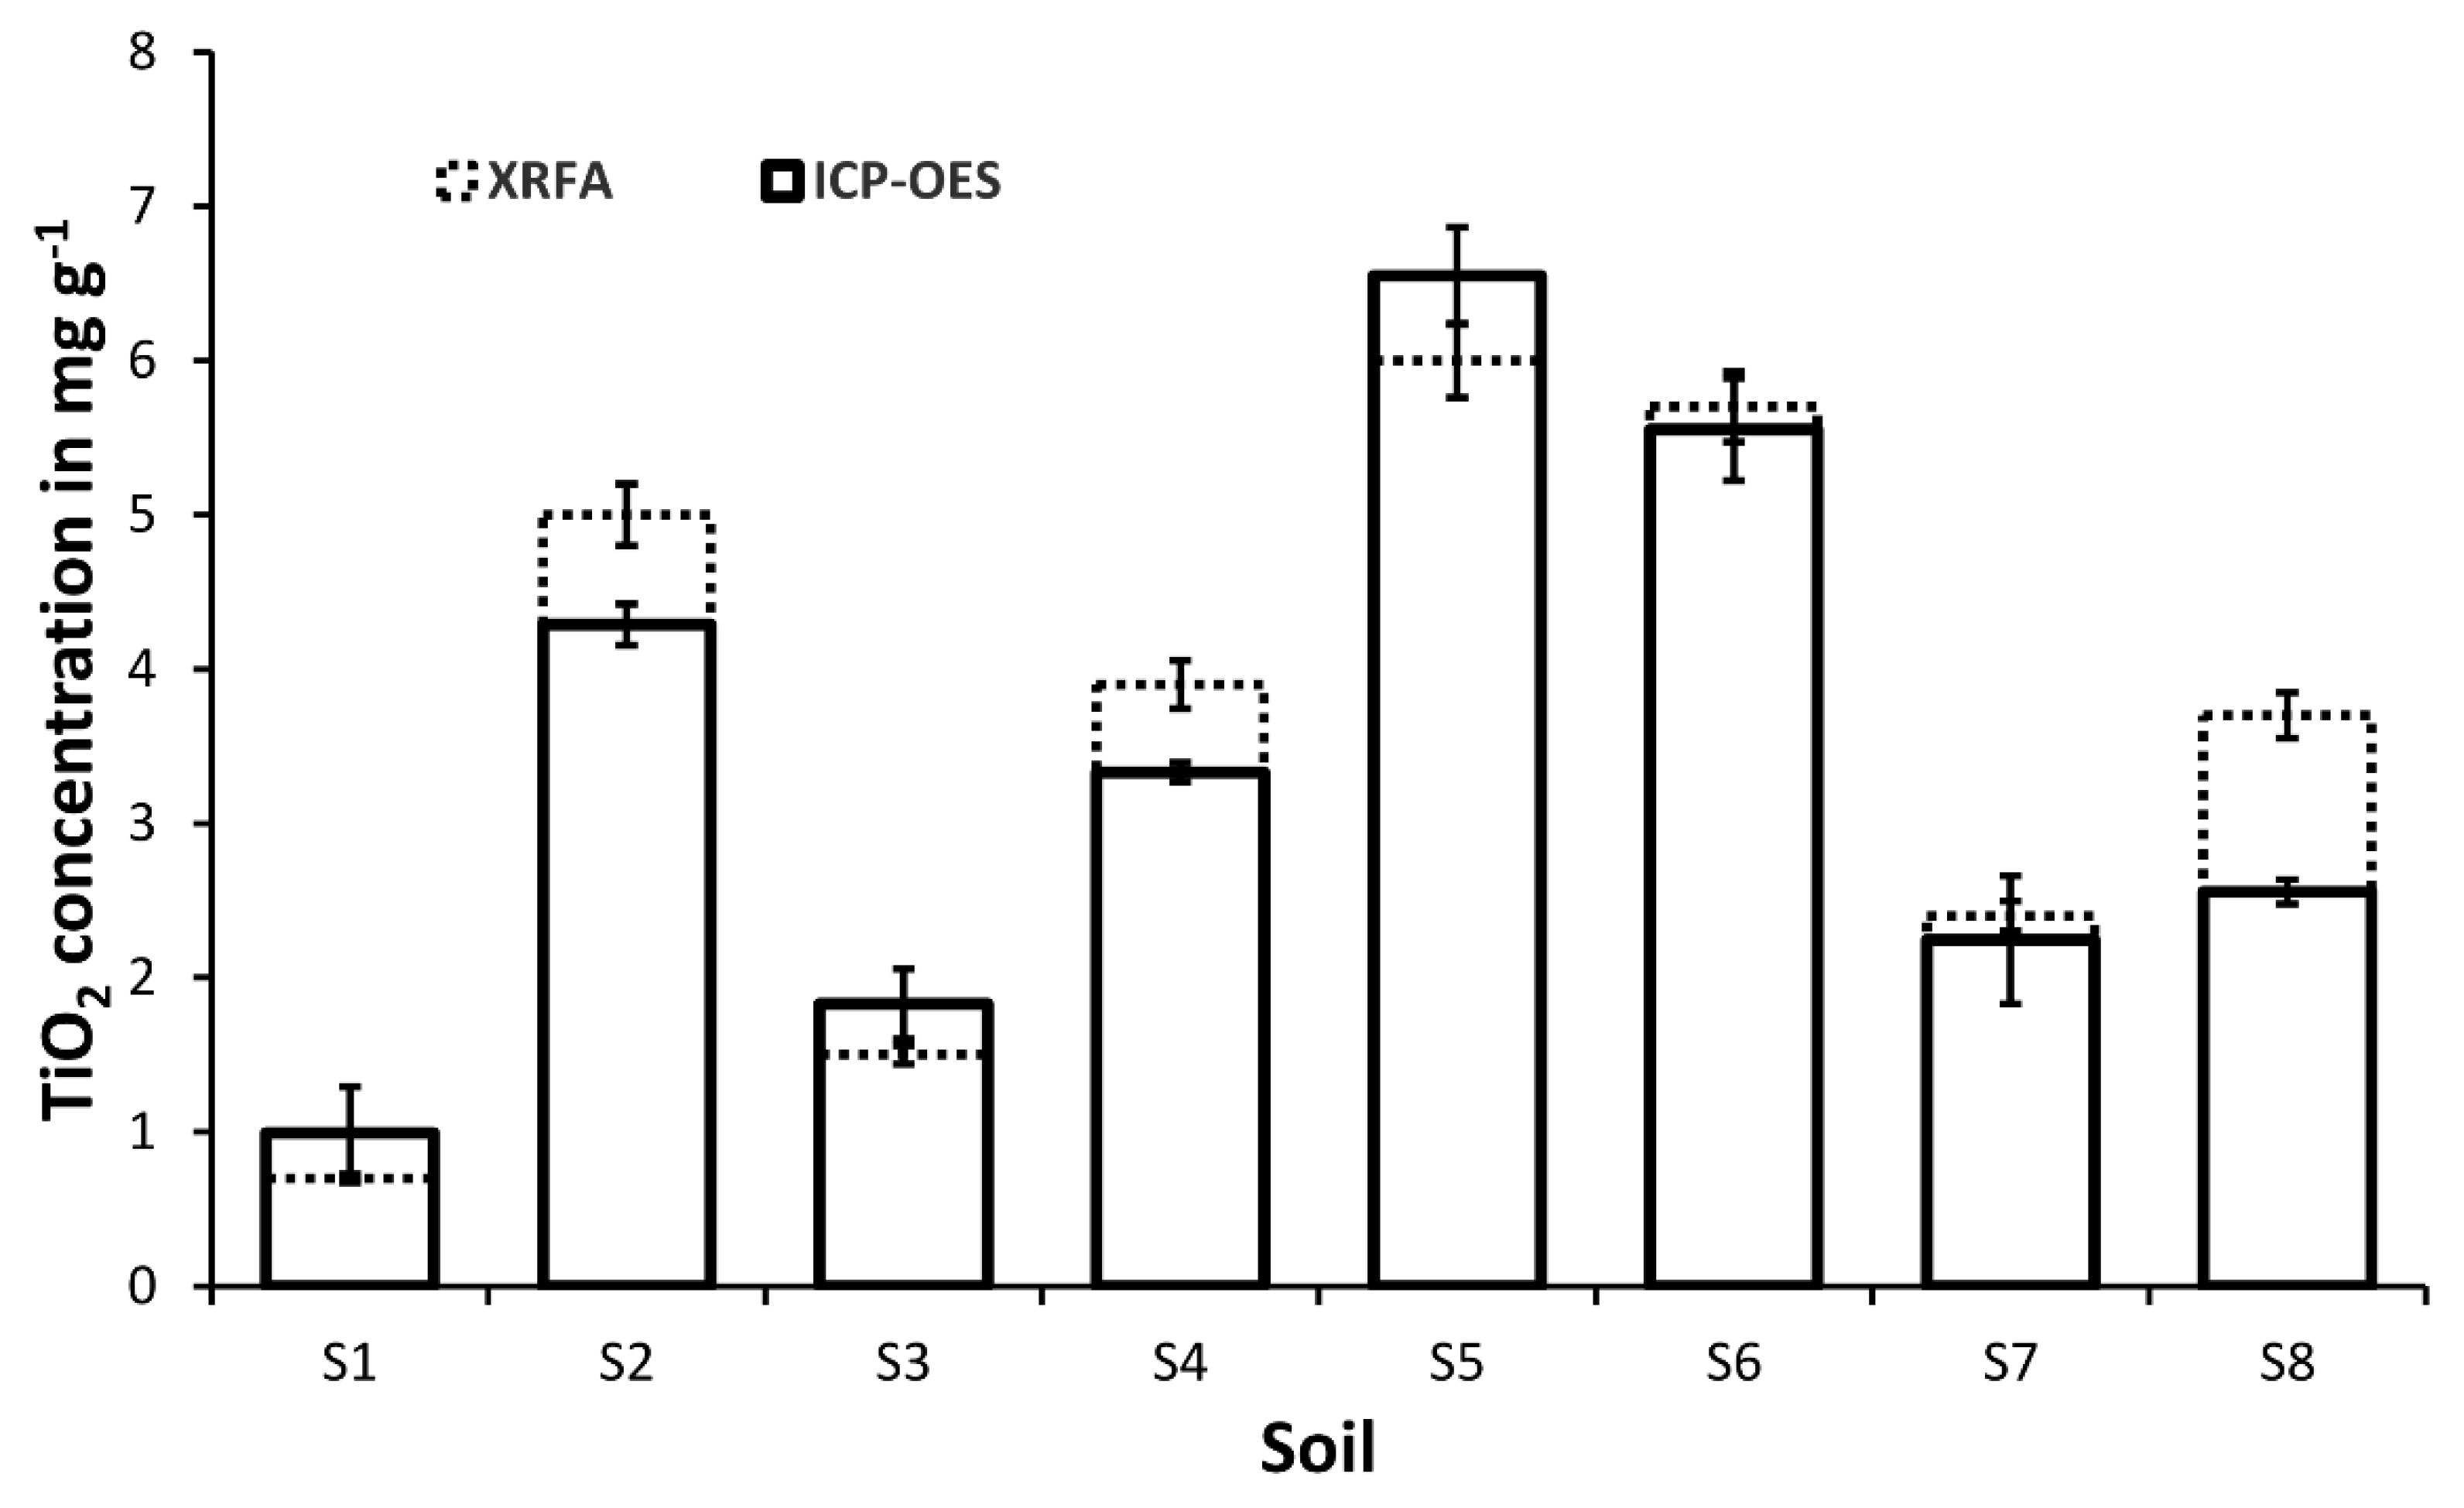
Ti-concentrations in soil measured using XRFA and ICP-OES (expressed here in terms of TiO2) were similar for all soils expected for S2, S4, and S8, where the values obtained using XRFA were slightly higher. The TiO2-concentration range was 0.07–0.7 mg g−1 (Figure 2), which is in concordance with values measured for other European topsoil’s and floodplain sediments [16]. Soils rich in clay S5 and S6 had the highest values; whereas the sandy soils S1, S3, and S8 and S7 (peat) had the lowest concentrations. The concentrations of further elements were determined using XRFA (Tables S1 and S2). Remarkable features were the high Ca-content of S2 (14.4 mg g−1) compared to the other soils (<4 mg g−1), the high Zr-content of S8 (614 µg g−1) compared to other soils (57–276 µg g−1), and the high Mn and S concentrations for S7 (0.42 and 1.28 mg g−1, respectively).
The differences between the values obtained with XRFA or ICP-OES observed for S2, S4, and S8 indicated that a low but significant portion of the Ti was included in minerals, which were not solubilized during the digestion process. Indeed, silicate minerals represent the vast majority of the soil components (Table S1) and are not soluble in hot sulfuric acid. However, the fraction of Ti included in silicates is a minor fraction (<15%) in all samples except in S8 (32%). These values may be slightly underestimated due to the methodological limitations. The centrifugation step conducted after the digestion step removes undissolved particles larger than 200 nm. Thus, silicate minerals with grain sizes smaller than this cut-off would be included into the dissolved fraction. Nonetheless, the fraction of Ti-containing particles smaller than 200 nm was low (<0.6%–7%) for the tested soil as shown below.
The range of Ti-concentrations in the colloidal extracts determined using ICP-OES was 4.4–367 µg g−1, corresponding to colloidal fractions between 0.6% and 7% (Figure 3). Therefore, 93% to 99.3% of the mass of Ti in our soils was present as particles larger than 1.2 µm. The fair correlation (least square linear model, R2 = 0.656, see Figure S1) between these concentrations and the total concentrations determined using ICP-OES suggests that there is a link between the colloids and the larger particles containing Ti. Therefore, most of these colloids were probably the result of a similar formation mechanism.
3.3 Size and Composition of Ti-Containing Particles
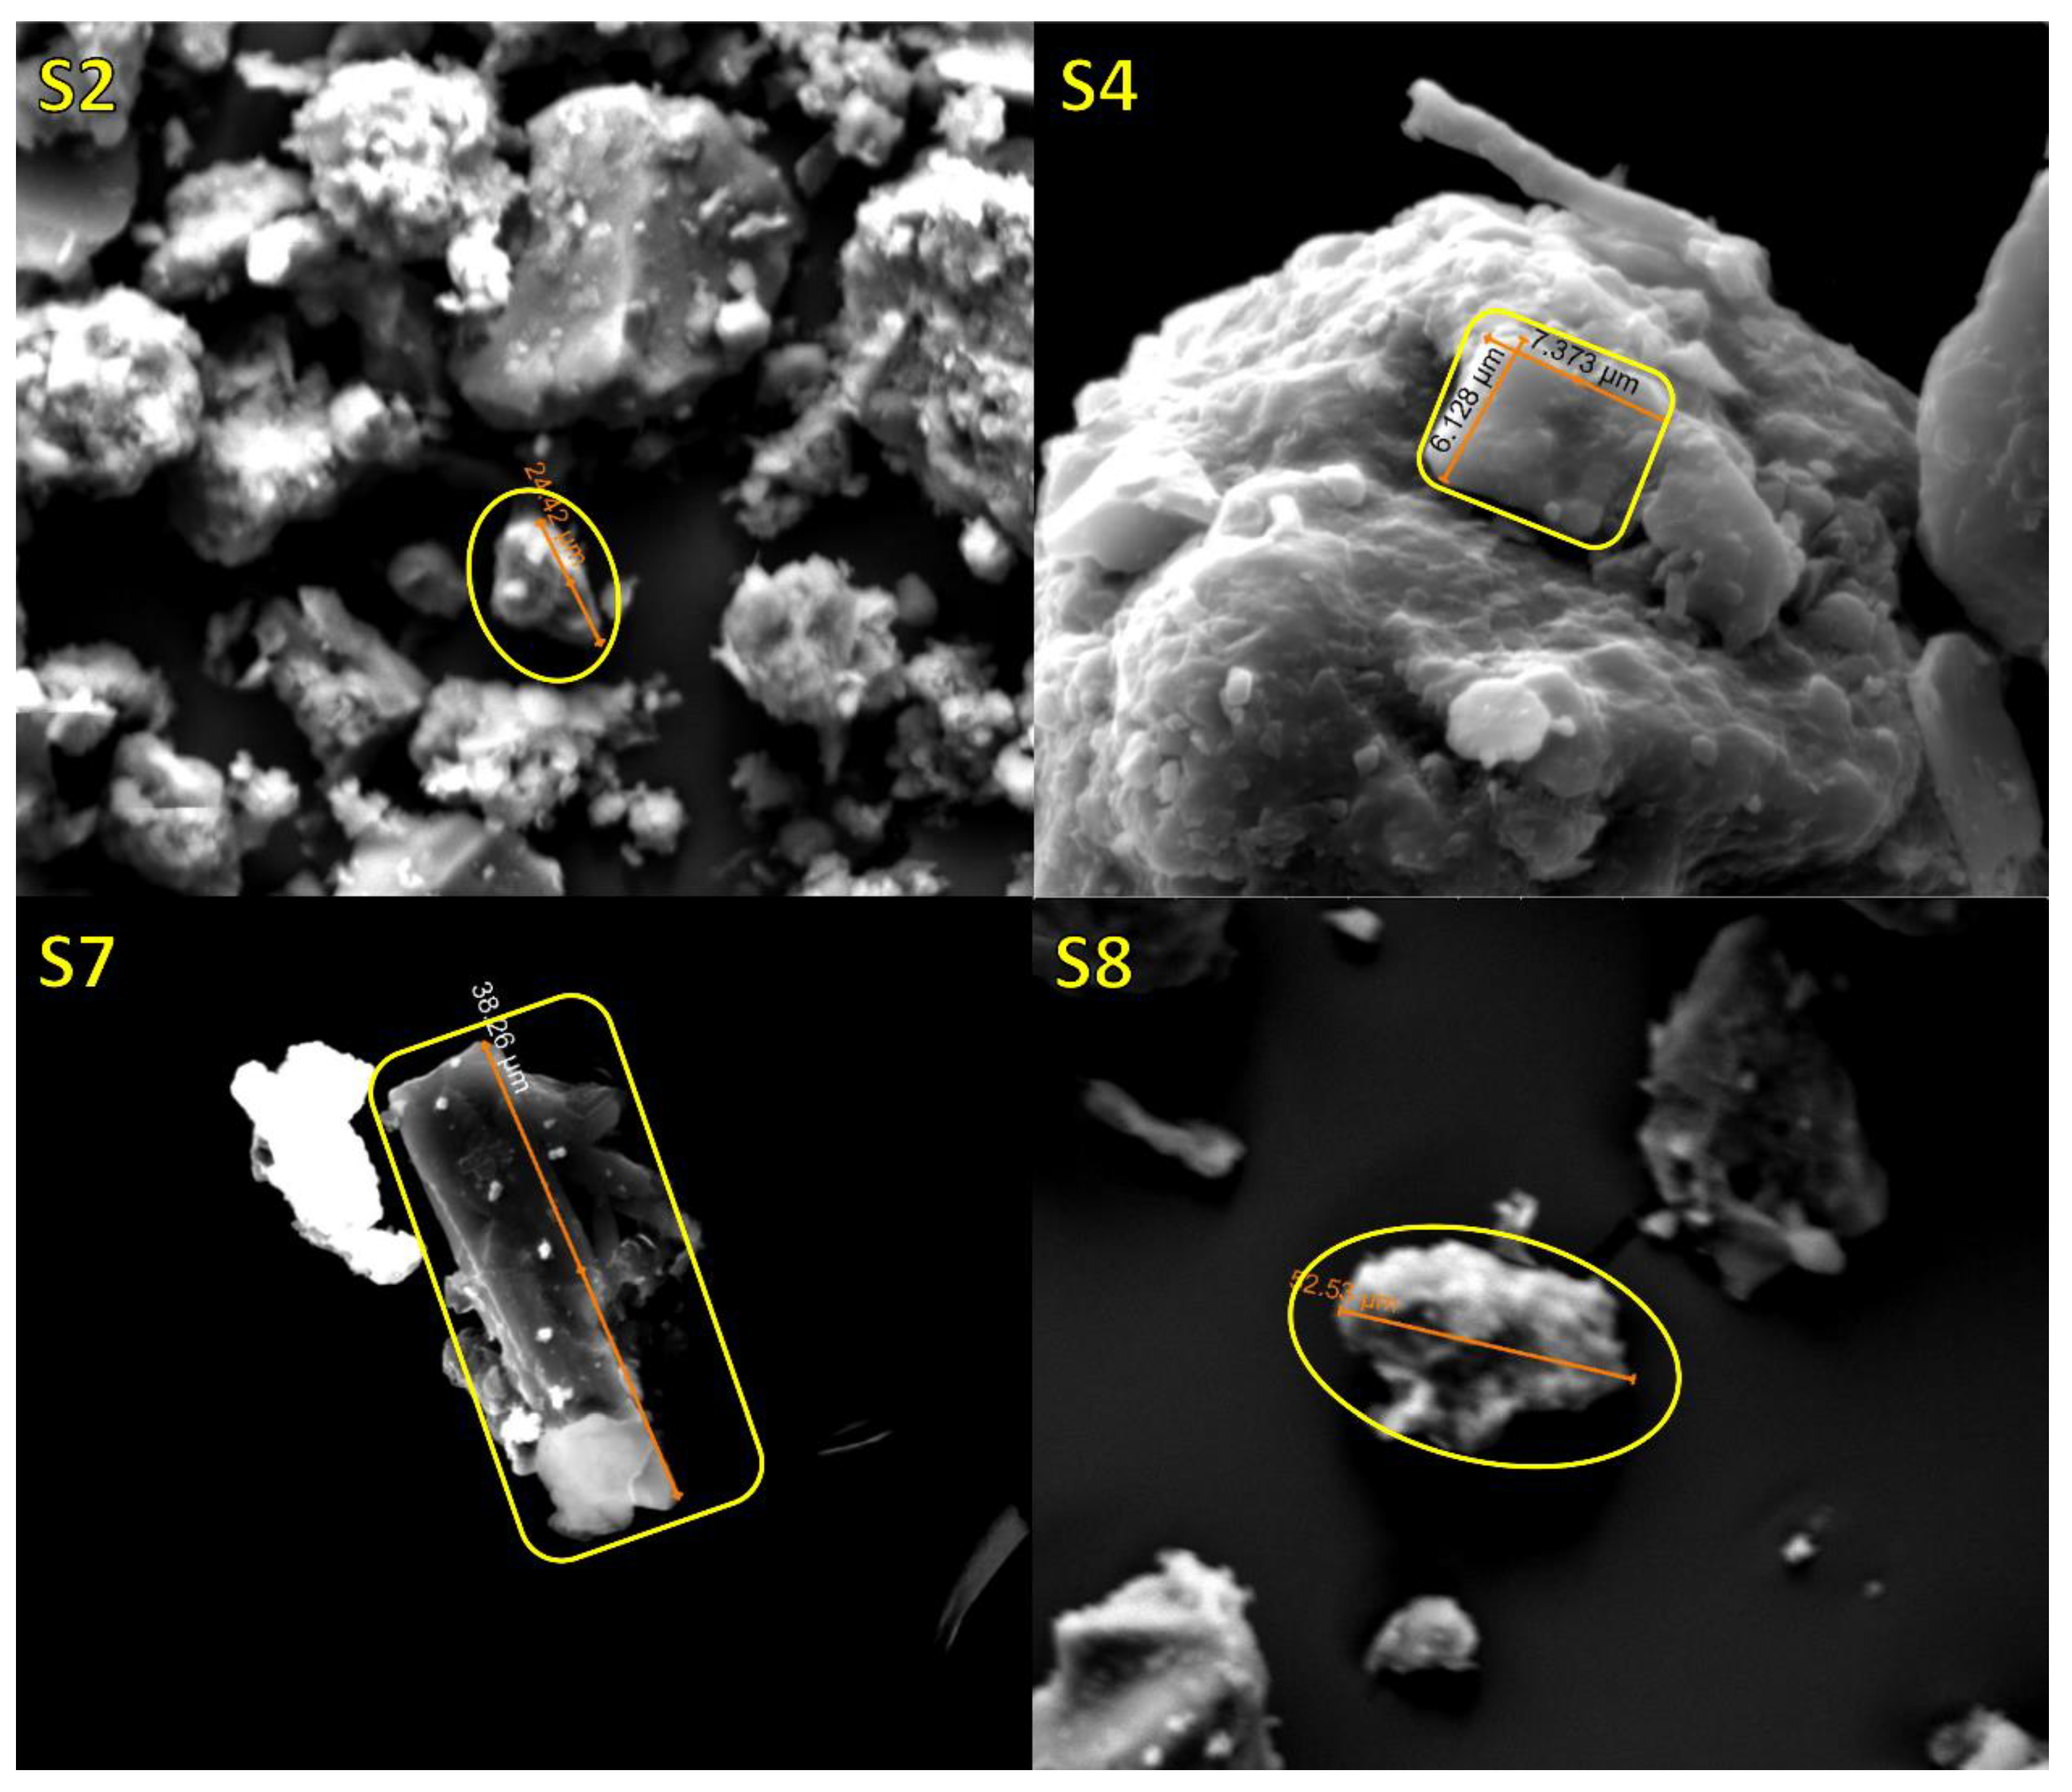
The presence of large Ti-containing particles in the investigated soils was confirmed using SEM imaging combined to EDX analyses for all soils except S1 (commercial sand). We observed a large variety of shapes from crystalline (typically elongated crystals as in S7, Figure 4) to irregular shapes (Figure 4 and Figures S2–S5). The particle size range was 1–100 µm, with large variations for some samples. The determination of the complete size distribution was not possible due to the limited amount of observed particles. EDX analyses revealed that most particles contained only Ti and Oxygen as main elements (see S7, Figure S6, for a representative example). Some particles observed in S8 (tropical native soil) contained Fe in addition to Ti, (see S8, Figure S7) which may have corresponded to Fe-Ti minerals such as Ilmenite.
The approach combining SEM and EDX was unsuitable for observing Ti-containing colloids since the vast majority of observable particles were silicates and having a similar contrast to TiO2 particles. Therefore, the procedure we followed was to scan a large area using EDX and to zoom on spots where the Ti-signal was clearly higher than the surrounding area. The obvious limitation of this approach was that only relatively large particles produced an X-ray signal sufficiently high to be observed at a low magnitude. Thus, colloidal particles may be excluded from this type of analysis. Furthermore, the resolution of our instrument did not allow imaging particles smaller than 100 nm. Nonetheless, the extraction of colloids provided a suspension, which was depleted in large particles. This suspension was then centrifuged for concentrating the colloids, thus increasing the probability to observe colloids using electron microscopy. To observe colloids and be able to carry out EDX analysis on the nanoscale, we used a high-resolution TEM in HAADF scanning mode.
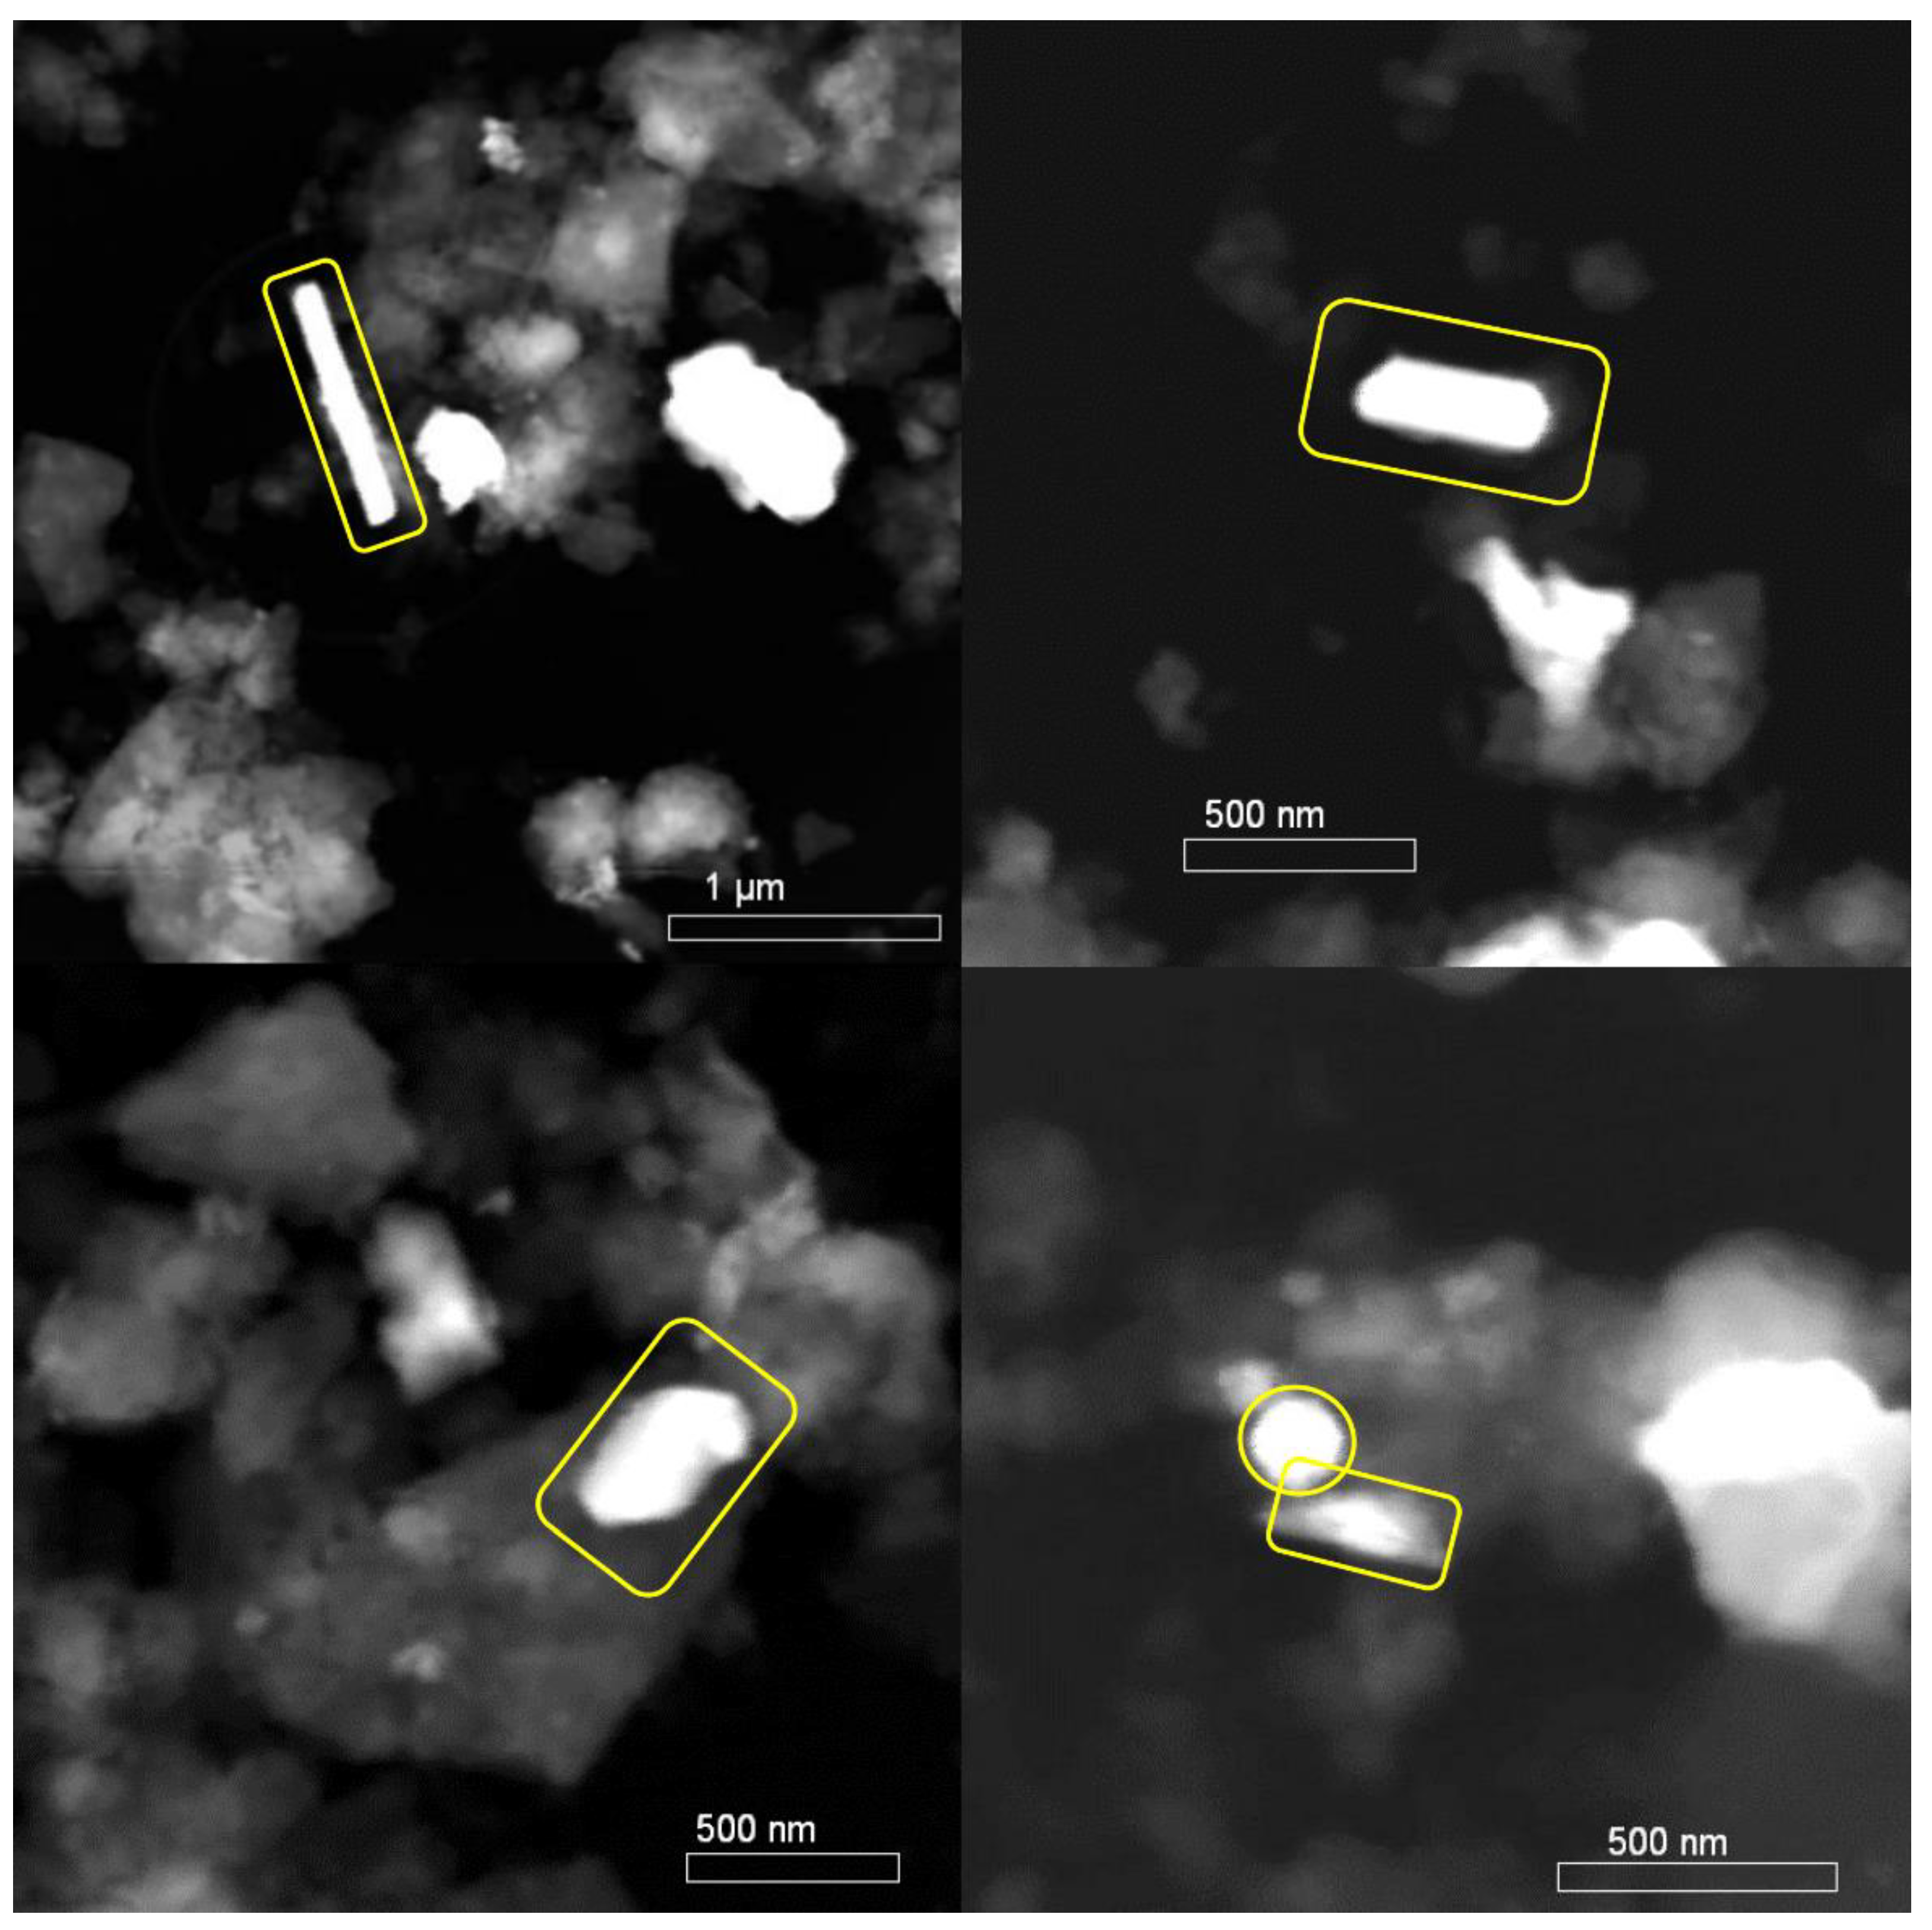
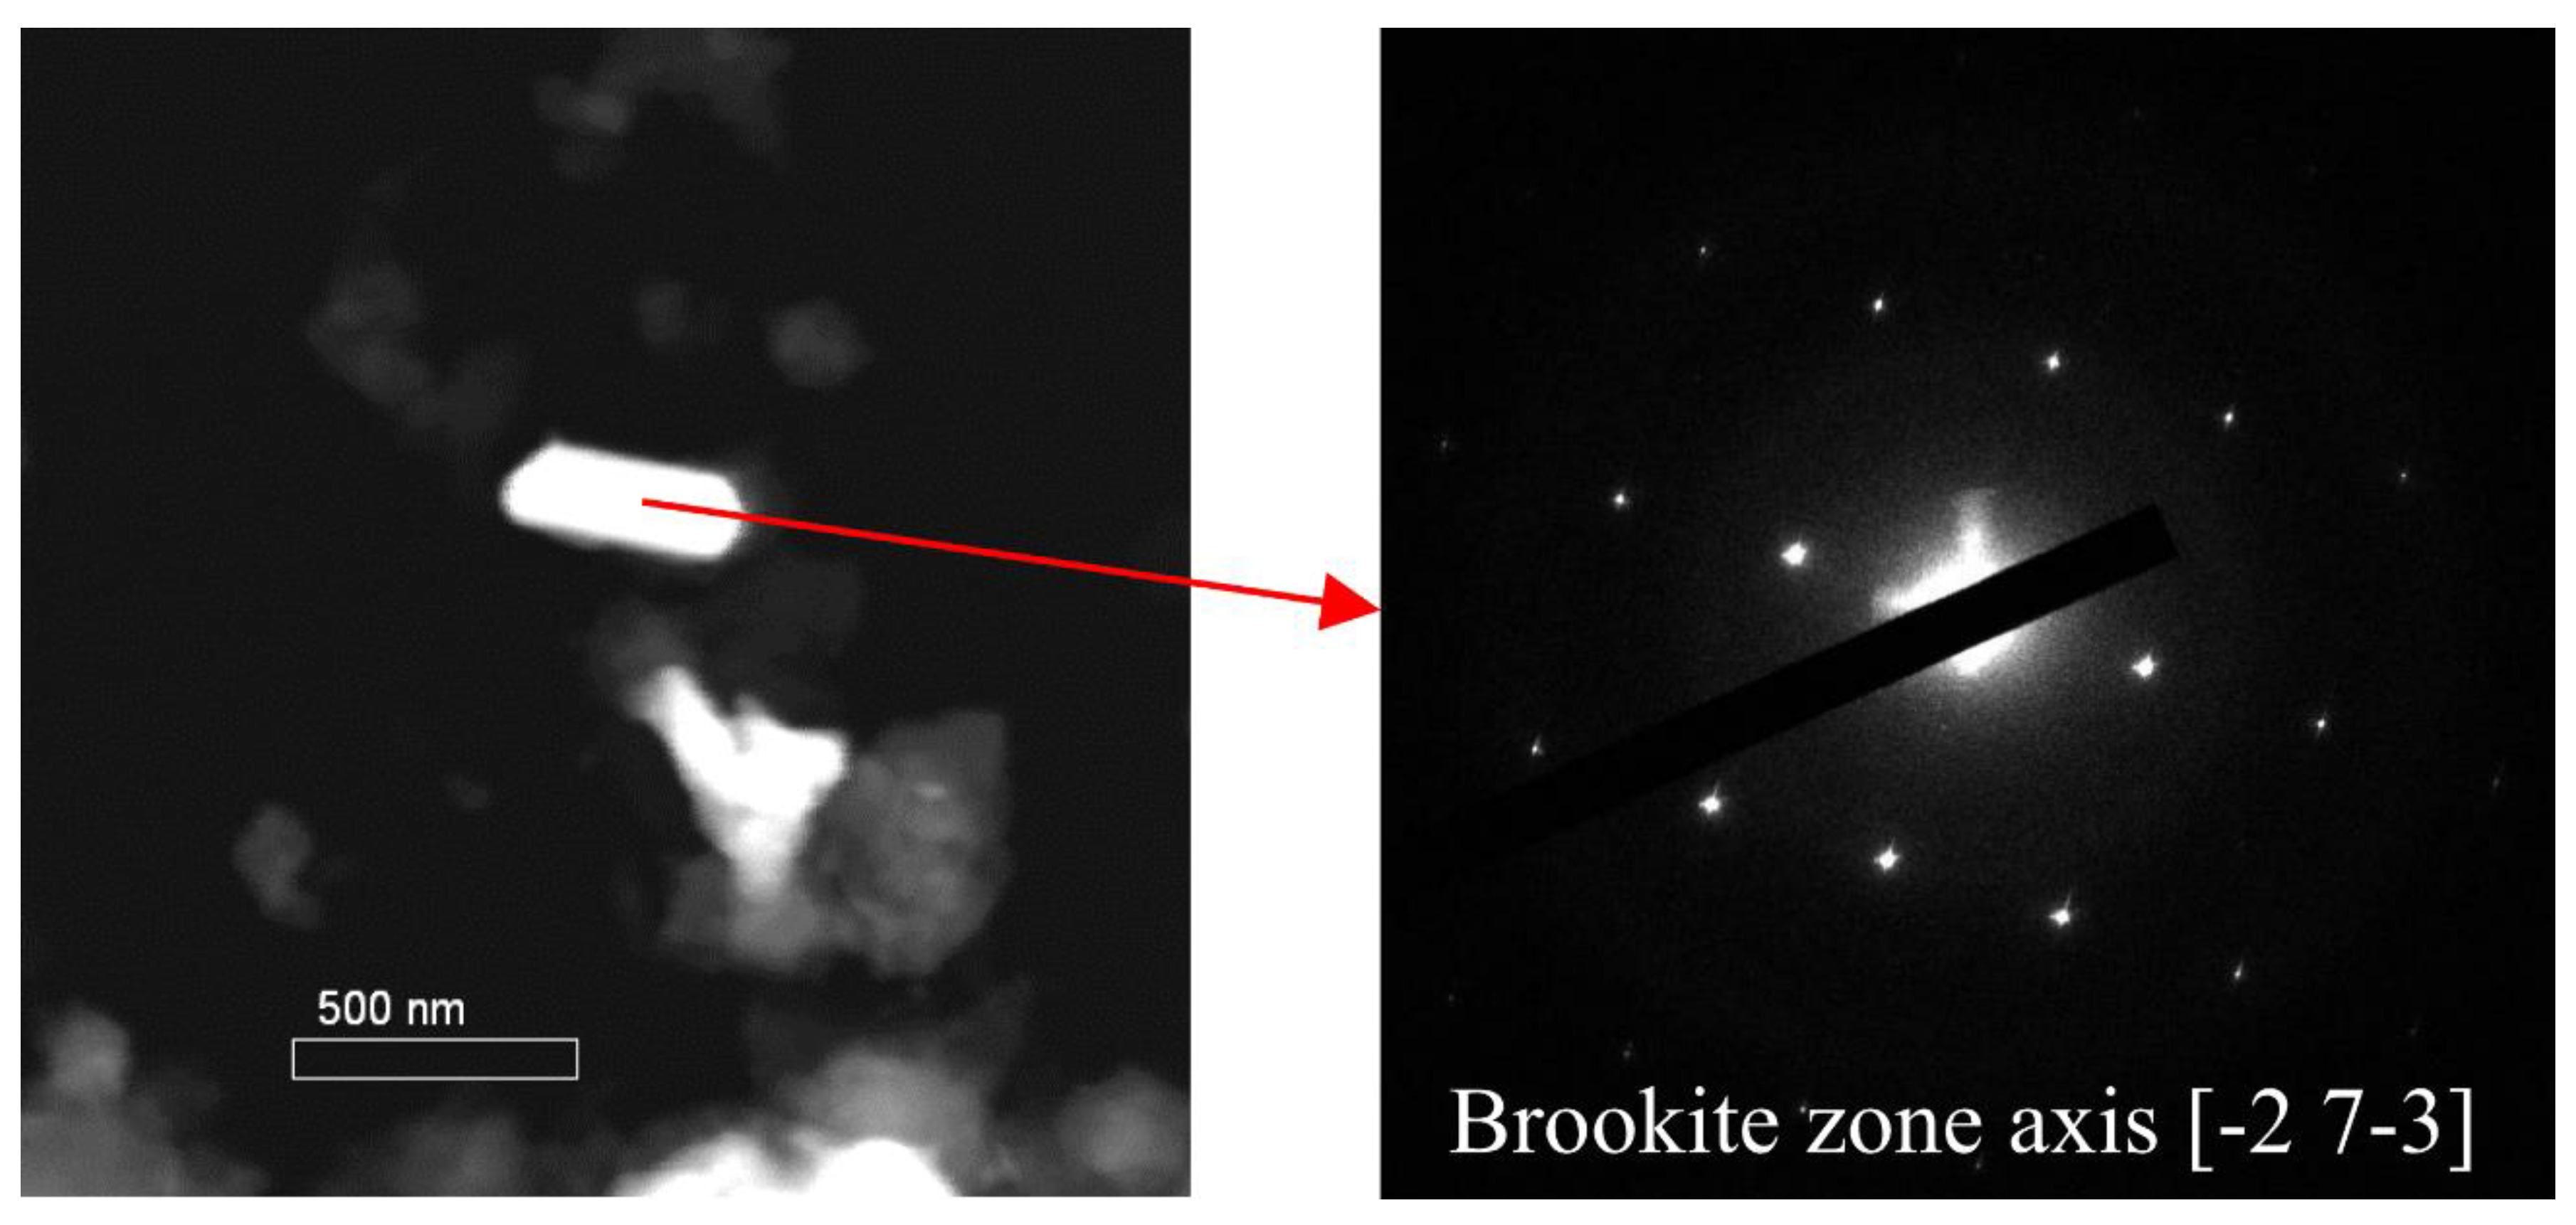
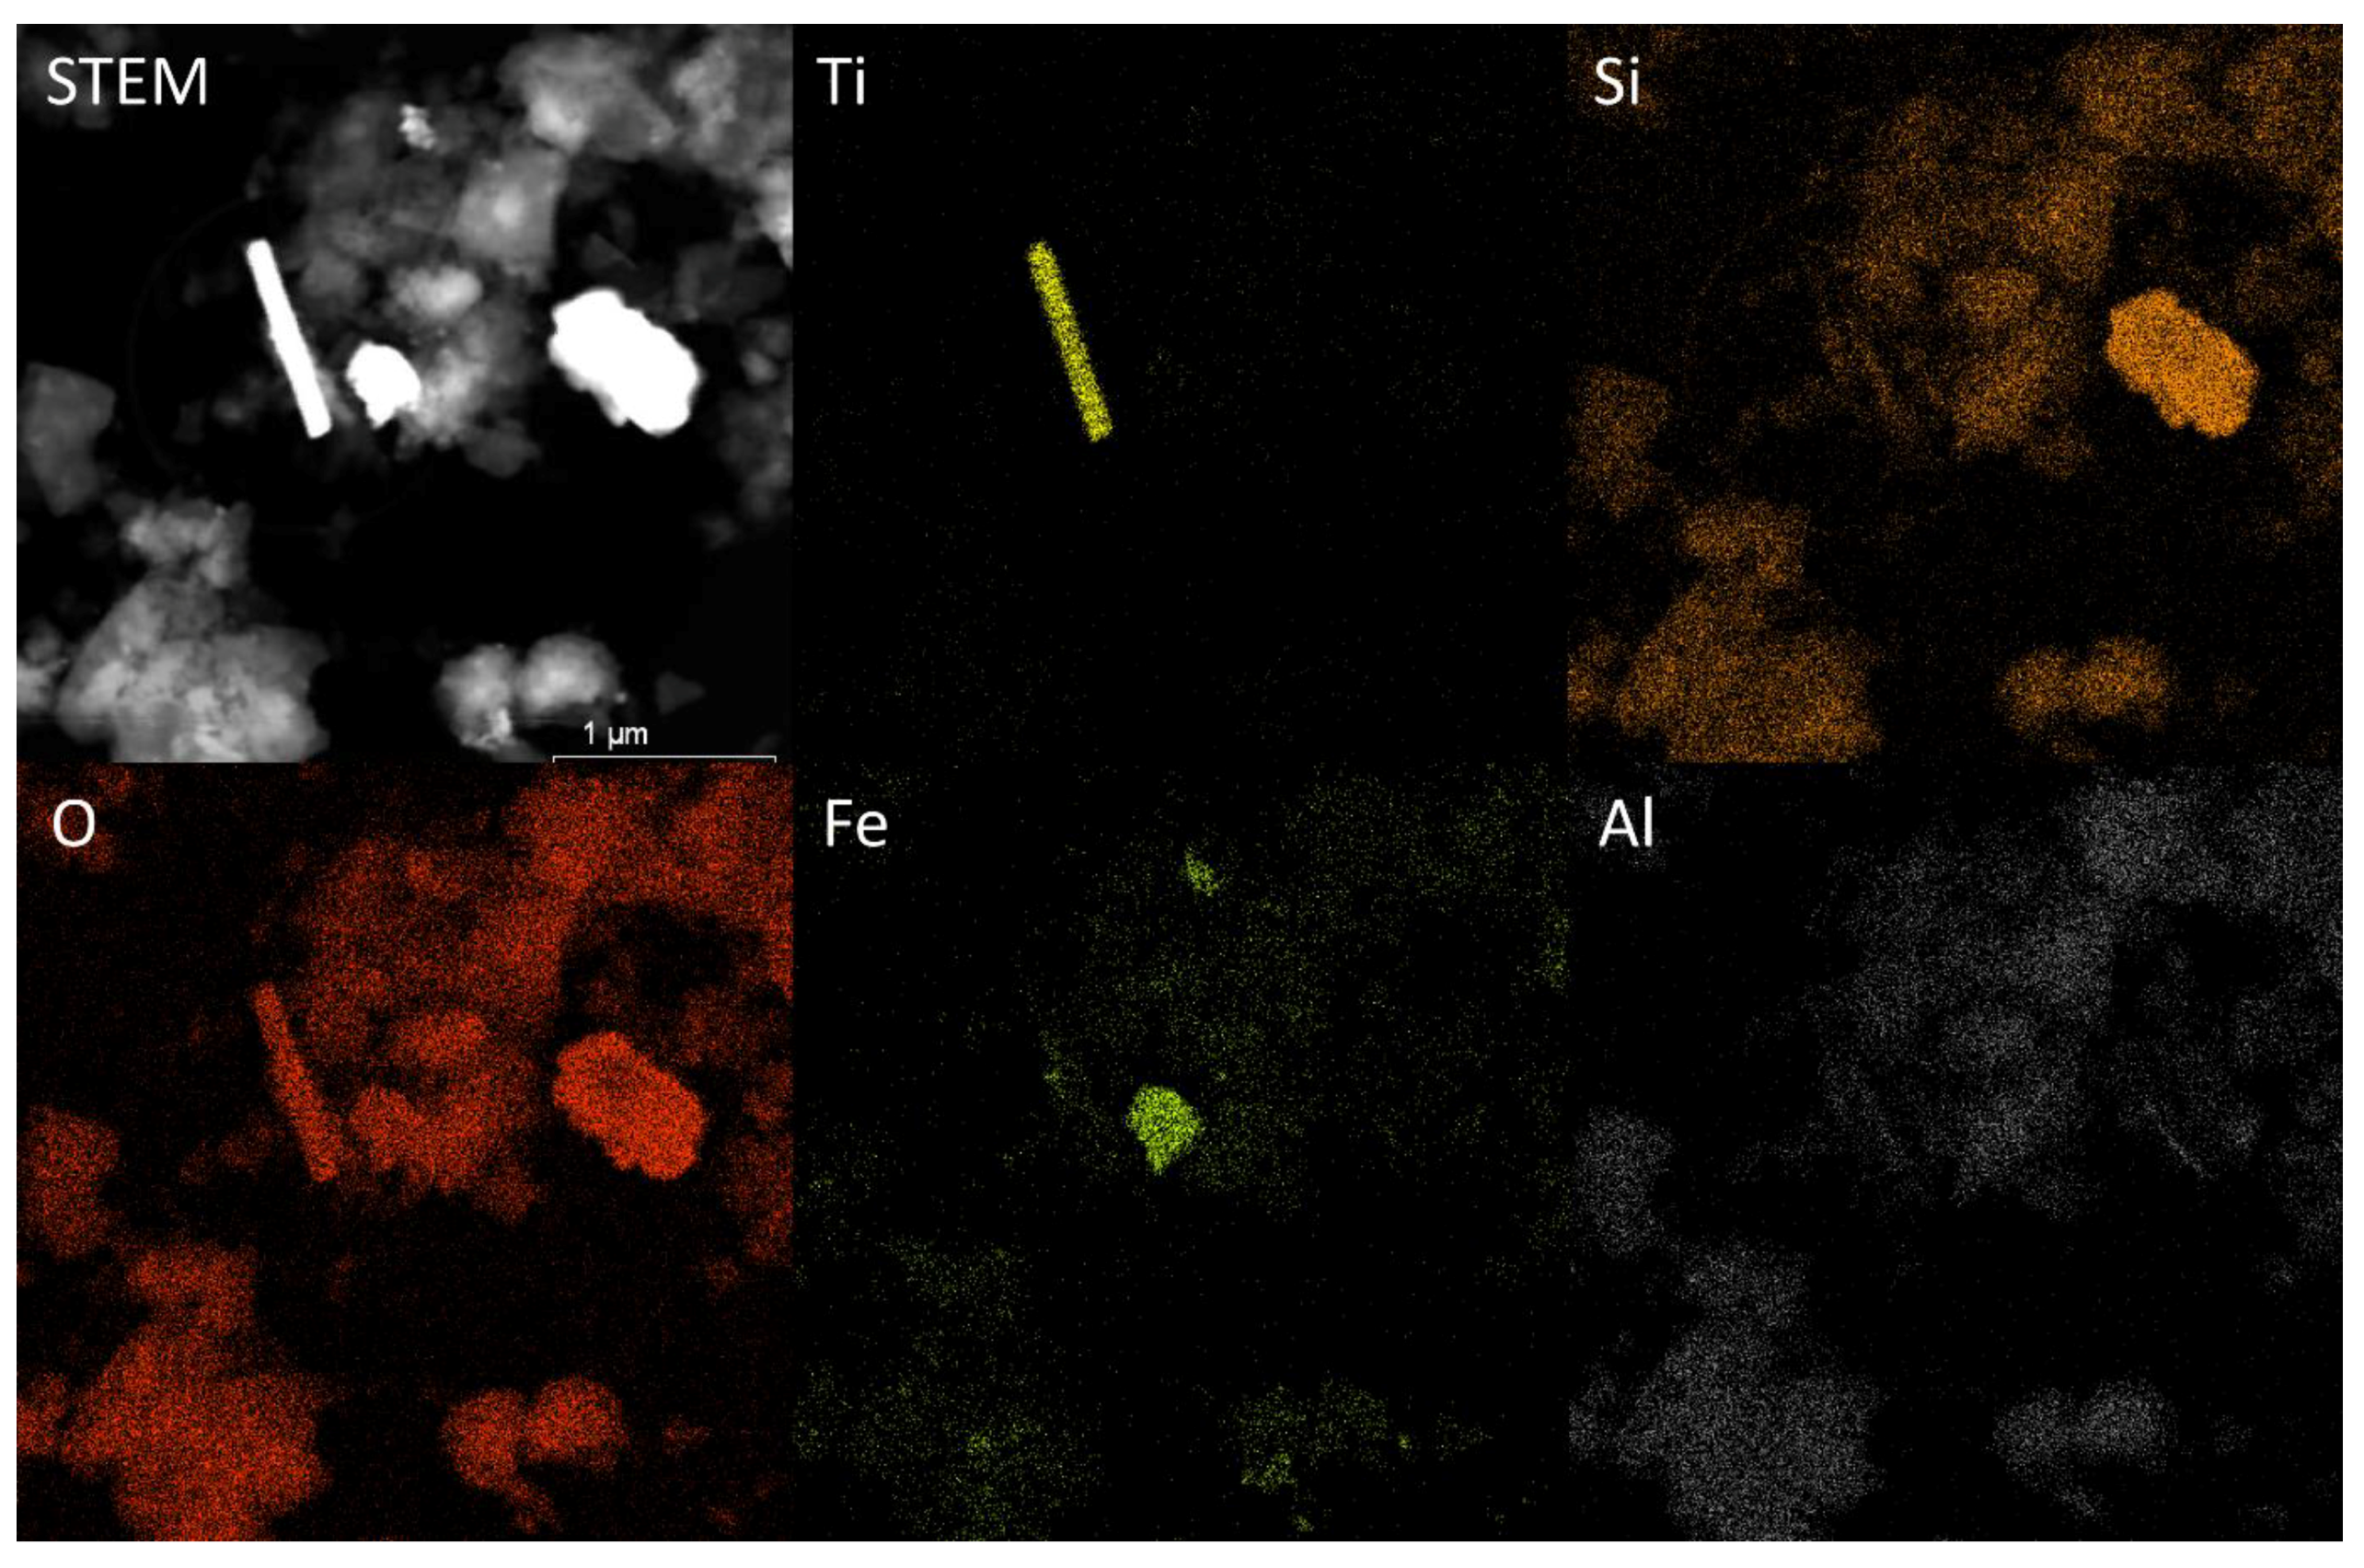
The pre-concentration step enabled imaging and identification of ten Ti-containing particles. Their size range was 0.1–1 µm. Interestingly, most particles were observed as elongated monocrystals, albeit irregular and spherical shapes could be observed as well (Figure 5). The electron diffraction pattern of one of these crystals corresponded to the brookite structure (Figure 6), which is common in nature [17]. It was impossible to do an electron diffraction pattern on the other nanocrystals due to the contribution of the surrounding soil particles to the total diffraction pattern. All observed Ti-containing particles exclusively contained Ti and O, and could be clearly distinguished from clays, quartz, and iron oxides particles (Figure 7 and Figures S8 and S9).
The analysis of the colloidal extract of S2 pinpoints the difficulty of a systematic investigation of natural colloids using electron microscopy. The low number of nanoparticles found in our sample after pre-concentration in comparison to clays, quartz, and iron oxides minerals renders difficult the collection of several hundreds of imaged particles required for determining the complete size distribution. Therefore, the colloidal extracts of all soils were also analyzed using HDC-ICP-MS for determining the complete size distribution of Ti-containing colloids. The broadness of the size distribution was slightly overestimated due to peak broadening in the HDC column, which was uncorrectable in our case, since the measured particles had unknown composition and shape [31,32]. Nonetheless, the method provided valuable insight into the size distribution of colloidal suspensions with sizes ranging from 20 to 1200 nm. Indeed, HDC provides a reliable sizing of colloids differing in composition and coating and fairly free of matrix effects, albeit the particle shape affects the size estimation, as for any size separation method [33,34,35,36,37].
Size distributions of colloids containing Al, Ti, Zr, and Ce were determined using HDC-ICP-MS directly after extraction (Figure S10), whereas the size distributions for colloids containing Ti, Mn, Fe, and Ni were determined one day after the extraction (Figure S11). Ti-size distribution changed slightly between the two measurements, indicating a slow agglomeration process occurring in the extraction medium. This effect was stronger for S3 and S7, where the sizes were two times higher after 24 h. Interestingly, all monitored elements were detected in every colloidal fraction except Zr and Ni in S1 (commercial sand). All distribution was unimodal and as mentioned above, the broadness of the size distribution was probably overestimated. Nonetheless, it is clear that nanoparticles and larger colloids were present in the extracts with distribution modes (most frequent size) around 100 nm (Figure 8).
Interestingly, the size distribution modes for Ti and Al differed significantly for most of the investigated soils (Figure 8), which is in accordance with our previous conclusion that the main Ti-fraction is not included in clays. Similarly, it seems that Zr and Ce containing particles are not always included in Ti-containing particles. However, Zr and Ce, when detected, have the same size mode. Therefore, we cannot exclude that these elements are part of the same minerals. Furthermore, size modes for Mn, Fe, and Ni, when detected, were similar to the Ti ones for S1, S2, and S5, whereas they differed significantly for the other soils. This suggests the absence of a systematic link between colloids containing Ti and other main elements found in soils. However, the adsorption of ions (Fe, Mn, Ni, etc.) on the surface of TiO2 particles cannot be ruled out and is probable [38,39]. Nonetheless, this would most probably not result in a significant contribution to the ICP-MS signal compared to the particulate form, considering the low signal intensity, except for Al (clays) which were present in much higher concentrations than other particles in all soils.
The electron microscopy observations combined to the XRFA and ICP-OES analyses indicate that most of the Ti identified in the investigated soils exists as TiO2 particles with a broad size distribution ranging from nanoparticles until 100 µm particles. Ti contained in silicate minerals and colloids represents a minor fraction of the total Ti-content. HDC-ICP-MS analyses confirm the presence of Ti-containing particles in the colloidal range and below 100 nm. Furthermore, comparison of the size modes of particles containing the main elements found in the soil suggests that Ti-containing colloids were at least partly independent of other soil components and were probably mostly present as TiO2.
4. Conclusions
The results of this study will be useful for designing a strategy for identifying anthropogenic TiO2 nanoparticles, where their characteristics differ from the natural TiO2 particles in soil. This is a necessary first step for predicting which types of nanoparticles may have a significant impact in soil, in terms of quality and quantity considering the input in relation with the natural background.
Our results indicate that the detection of engineered TiO2 nanoparticles, typically released in a much lower amount than the background concentrations measured in the soils investigated in this study [8], requires a separation procedure. Since the natural and engineered TiO2 particles do not differ by composition and the observed morphologies of natural particles are very diverse, size-based separation after dispersion is a required first purification step for isolating engineered nanoparticles. However, this step is not sufficient as a low but significant portion of the natural TiO2 particles is also in the nano-range. Therefore, combining size separation with an orthogonal separation technique based on surface properties, such as isoelectric point or chemical affinity, may be more promising. However, such coupling techniques are still to be developed and validated for soil samples. A systematic characterization based on shape and size using TEM is rather not promising, since natural TiO2 particles show a high variety in shape, size, and probably in crystal phase as well [40]. Furthermore, this approach would require long measurement times (several days per sample), which is impractical in most cases. HDC is, in this respect, more efficient and is sufficiently versatile for being applied to soil extracts, once particles larger than one micrometer are removed. However, HDC-ICP-MS provides only information on size and indirectly on composition, which is not sufficient for distinguishing between anthropogenic and natural particles.
Nonetheless, separation and pre-concentration steps may greatly facilitate analyses using electron microscopy or chromatography. In addition, the combination of the isotopic ratio or trace elements analysis and extraction and pre-concentration steps may be promising provided a significant difference in isotopic ratio of engineered and soil nanoparticles [41]. Therefore, we suggest investing further the development of selective extraction method for TiO2 nanoparticles, which are typically released into soils and sediments, and in the characterization of natural and commercial nanoparticles, including isotopic ratio and trace elements.
Supplementary Materials
The following are available online at https://www.mdpi.com/2297-8739/5/4/50/s1, Table S1: concentration in mass percent of the main soil components determined using XRFA, Table S2: concentration in ppm of selected minor soil components determined using XRFA in ppm, Figure S1: TiO2 concentrations in the colloidal extracts determined using ICP-OES over the total TiO2 concentration of the respective soils determined using XRFA, Figure S2: image obtained using SEM of soil born natural particles in the untreated soils S2 and S3, Figure S3: image obtained using SEM of soil born natural particles in the untreated soils S4 and S5, Figure S4: image obtained using SEM of soil born natural particles in the untreated soils S6 and S7, Figure S5: image obtained using SEM of soil born natural particles in the untreated soils S8, Figure S6: image obtained using SEM of soil born natural particles in the untreated soils S7 and the corresponding EDX maps, Figure S7: image obtained using SEM of soil born natural particles in the untreated soils S8 and the corresponding EDX maps, Figure S8: image obtained using HR-TEM in HAADF scanning mode of soil born natural particles, which were extracted from the soil S2, and the corresponding EDX-maps, Figure S9: Image obtained using HR-TEM in HAADF scanning mode of soil born natural particles, which were extracted from the soil S2, and the corresponding EDX-maps, Figures S10 and S11: size distributions estimated from the chromatograms obtained using HDC-ICP-MS for the soils investigated in this study.
Author Contributions
Conceptualization, A.P.; methodology, A.P., D.A.C.; formal analysis, A.P.; investigation, A.P., D.A.C., J.-M.G., D.D., and C.B.; writing—original draft preparation, A.P., D.A.C., and J.-M.G.; review and editing, D.D., C.B., G.E.S.; funding acquisition, G.E.S.
Funding
This research was funded by the German Research Foundation, research unit INTERNANO (FOR 1536 “Mobility, aging and functioning of engineered inorganic nanoparticles at the aquatic–terrestrial interface”, subprojects SCHA849/16 and KL 2909/1-2).
Acknowledgments
The authors thank Laura Degenkolb, Traugott Scheytt, and his team at the Technical University of Berlin for the XRFA measurements, Lars Düster from the Bundesanstalt für Gewässerkunde for measurements of soil particle size, Wolfgang Fey for the support provided during ICP-OES measurements, and Andreas Felten, Pinar Koca, and Mariam Abboud for their valuable help during the methods development.
Conflicts of Interest
The authors declare no conflict of interest. The funders had no role in the design of the study; in the collection, analyses, or interpretation of data; in the writing of the manuscript, or in the decision to publish the results.
References
- Bairi, V.G.; Lim, J.-H.; Fong, A.; Linder, S.W. Size characterization of metal oxide nanoparticles in commercial sunscreen products. J. Nanopart. Res. 2017, 19, 256. [Google Scholar] [CrossRef]
- Philippe, A.; Košík, J.; Welle, A.; Guigner, J.-M.; Clemens, O.; Schaumann, G.E. Extraction and characterization methods for titanium dioxide nanoparticles from commercialized sunscreens. Environ. Sci. Nano 2018, 5, 191–202. [Google Scholar] [CrossRef]
- Weir, A.; Westerhoff, P.; Fabricius, L.; Hristovski, K.; von Goetz, N. Titanium dioxide nanoparticles in food and personal care products. Environ. Sci. Technol. 2012, 46, 2242–2250. [Google Scholar] [CrossRef] [PubMed]
- Baalousha, M.; Yang, Y.; Vance, M.E.; Colman, B.P.; McNeal, S.; Xu, J.; Blaszczak, J.; Steele, M.; Bernhardt, E.; Hochella, M.F. Outdoor urban nanomaterials: The emergence of a new, integrated, and critical field of study. Sci. Total Environ. 2016, 557, 740–753. [Google Scholar] [CrossRef] [PubMed] [Green Version]
- Chen, X.; Mao, S.S. Titanium dioxide nanomaterials: Synthesis, properties, modifications, and applications. Chem. Rev. 2007, 107, 2891–2959. [Google Scholar] [CrossRef] [PubMed]
- Kiser, M.; Westerhoff, P.; Benn, T.; Wang, Y.; Perez-Rivera, J.; Hristovski, K. Titanium nanomaterial removal and release from wastewater treatment plants. Environ. Sci. Technol. 2009, 43, 6757–6763. [Google Scholar] [CrossRef] [PubMed]
- Gondikas, A.P.; von der Kammer, F.; Reed, R.B.; Wagner, S.; Ranville, J.F.; Hofmann, T. Release of TiO2 nanoparticles from sunscreens into surface waters: A one-year survey at the old Danube recreational Lake. Environ. Sci. Technol. 2014, 48, 5415–5422. [Google Scholar] [CrossRef] [PubMed]
- Liu, H.H.; Cohen, Y. Multimedia environmental distribution of engineered nanomaterials. Environ. Sci. Technol. 2014, 48, 3281–3292. [Google Scholar] [CrossRef] [PubMed]
- Gottschalk, F.; Lassen, C.; Kjoelholt, J.; Christensen, F.; Nowack, B. Modeling flows and concentrations of nine engineered nanomaterials in the Danish environment. Int. J. Environ. Res. Public Health 2015, 12, 5581–5602. [Google Scholar] [CrossRef] [PubMed]
- Sharma, V.K. Aggregation and toxicity of titanium dioxide nanoparticles in aquatic environment—A Review. J. Environ. Sci. Health Part A 2009, 44, 1485–1495. [Google Scholar] [CrossRef] [PubMed]
- Kulacki, K.J.; Cardinale, B.J.; Keller, A.A.; Bier, R.; Dickson, H. How do stream organisms respond to, and influence, the concentration of titanium dioxide nanoparticles? A mesocosm study with algae and herbivores. Environ. Toxicol. Chem. 2012, 31, 2414–2422. [Google Scholar] [CrossRef] [PubMed]
- Cornelis, G.; Hund-Rinke, K.; Kuhlbusch, T.; Van den Brink, N.; Nickel, C. Fate and bioavailability of engineered nanoparticles in soils: A review. Crit. Rev. Environ. Sci. Technol. 2014, 44, 2720–2764. [Google Scholar] [CrossRef]
- Gondikas, A.; von der Kammer, F.; Kaegi, R.; Borovinskaya, O.; Neubauer, E.; Navratilova, J.; Praetorius, A.; Cornelis, G.; Hofmann, T. Where is the nano? Analytical approaches for the detection and quantification of TiO2 engineered nanoparticles in surface waters. Environ. Sci. Nano 2018, 5, 313–326. [Google Scholar] [CrossRef]
- Schwertfeger, D.M.; Velicogna, J.R.; Jesmer, A.H.; Saatcioglu, S.; McShane, H.A.; Scroggins, R.P.; Princz, J.I. Extracting metallic nanoparticles from soils for quantitative analysis: Method development using engineered silver nanoparticles and SP-ICP-MS. Anal. Chem. 2017, 89, 2505–2513. [Google Scholar] [CrossRef] [PubMed]
- Mahdi, K.N.; Peters, R.J.; Klumpp, E.; Bohme, S.; Van der Ploeg, M.; Ritsema, C.; Geissen, V. Silver nanoparticles in soil: Aqueous extraction combined with single-particle ICP-MS for detection and characterization. Environ. Nanotechnol. Monit. Manag. 2017, 7, 24–33. [Google Scholar] [CrossRef]
- Geochemical Atlas of Europe. Available online: http://weppi.gtk.fi/publ/foregsatlas/ (accessed on 19 October 2018).
- Fitzpatrick, R.W.; Chittleborough, D. Titanium and zirconium minerals. In Soil Mineralogy with Environmental Applications; Soil Science Society of America: Madison, WI, USA, 2002; pp. 667–690. [Google Scholar]
- Theng, B.K.; Yuan, G. Nanoparticles in the soil environment. Elements 2008, 4, 395–399. [Google Scholar] [CrossRef]
- Li, W.; He, Y.; Wu, J.; Xu, J. Extraction and characterization of natural soil nanoparticles from Chinese soils. Eur. J. Soil Sci. 2012, 63, 754–761. [Google Scholar] [CrossRef]
- Waychunas, G.A.; Kim, C.S.; Banfield, J.F. Nanoparticulate iron oxide minerals in soils and sediments: Unique properties and contaminant scavenging mechanisms. J. Nanopart. Res. 2005, 7, 409–433. [Google Scholar] [CrossRef]
- Tang, Z.; Wu, L.; Luo, Y.; Christie, P. Size fractionation and characterization of nanocolloidal particles in soils. Environ. Geochem. Health 2009, 31, 1–10. [Google Scholar] [CrossRef] [PubMed] [Green Version]
- Chen, B.; Beckett, R. Development of SdFFF-ETAAS for characterising soil and sediment colloids. Analyst 2001, 126, 1588–1593. [Google Scholar] [CrossRef]
- Ryzak, M.; Bieganowski, A. Methodological aspects of determining soil particle-size distribution using the laser diffraction method. J. Plant Nutr. Soil Sci. 2011, 174, 624–633. [Google Scholar] [CrossRef]
- Navratilova, J.; Praetorius, A.; Gondikas, A.; Fabienke, W.; von der Kammer, F.; Hofmann, T. Detection of engineered copper nanoparticles in soil using single particle ICP-MS. Int. J. Environ. Res. Public Health 2015, 12, 15756–15768. [Google Scholar] [CrossRef] [PubMed]
- El Hadri, H.; Louie, S.M.; Hackley, V.A. Assessing the interactions of metal nanoparticles in soil and sediment matrices-a quantitative analytical multi-technique approach. Environ. Sci. Nano 2018, 5, 203–214. [Google Scholar] [CrossRef]
- Loomis, G.A. Grain size of whiteware clays as determined by the Andreasen pipette. J. Am. Ceram. Soc. 1938, 21, 393–399. [Google Scholar] [CrossRef]
- Vinther, E.; Lasson, M. Grain-size measurements of kaolins and clays. Berl. Deut. Keram. Ges. 1933, 14, 259–279. [Google Scholar]
- Nickel, C.; Hellack, B.; Gartiser, S.; Schiwy, A.; Schäffer, A.; Gabsch, S.; Stintz, M.; Erdinger, L.; Kuhlbusch, T.A.J. Fate and Behaviour of TiO2 Nanomaterials in the Environment, Influenced by Their Shape, Size and Surface Area; UBA Final Report 25/2012; Environmental Protection Agency: Berlin, Germany, 2012. [Google Scholar]
- Rakcheev, D.; Philippe, A.; Schaumann, G.E. Hydrodynamic chromatography coupled with single particle-inductively coupled plasma mass spectrometry for investigating nanoparticles agglomerates. Anal. Chem. 2013, 85, 10643–10647. [Google Scholar] [CrossRef] [PubMed]
- Wintermyer, A.; Kinter, E.B. Dispersing Agents for Particle-Size Analysis of Soils; Highway Research Board Bulletin; Highway Research Board: Washington, DC, USA, 1955. [Google Scholar]
- Stegeman, G.; Kraak, J.C.; Poppe, H. Dispersion in packed-column hydrodynamic chromatography. J. Chromatogr. A 1993, 634, 149–159. [Google Scholar] [CrossRef]
- Striegel, A.M.; Brewer, A.K. Hydrodynamic Chromatography. Annu. Rev. Anal. Chem. 2012, 5, 15–34. [Google Scholar] [CrossRef] [PubMed]
- Tiede, K.; Boxall, A.B.; Tiede, D.; Tear, S.P.; David, H.; Lewis, J. A robust size-characterisation methodology for studying nanoparticle behaviour in “real”environmental samples, using hydrodynamic chromatography coupled to ICP-MS. J. Anal. Atomic Spectrom. 2009, 24, 964–972. [Google Scholar] [CrossRef]
- Tiede, K.; Boxall, A.B.; Wang, X.; Gore, D.; Tiede, D.; Baxter, M.; David, H.; Tear, S.P.; Lewis, J. Application of hydrodynamic chromatography-ICP-MS to investigate the fate of silver nanoparticles in activated sludge. J. Anal. Atomic Spectrom. 2010, 25, 1149–1154. [Google Scholar] [CrossRef]
- Philippe, A.; Schaumann, G.E. Evaluation of Hydrodynamic Chromatography Coupled with UV-Visible, Fluorescence and Inductively Coupled Plasma Mass Spectrometry Detectors for Sizing and Quantifying Colloids in Environmental Media. PLoS ONE 2014, 9, e90559. [Google Scholar] [CrossRef] [PubMed]
- Philippe, A.; Gangloff, M.; Rakcheev, D.; Schaumann, G. Evaluation of hydrodynamic chromatography coupled with inductively coupled plasma mass spectrometry detector for analysis of colloids in environmental media-effects of colloid composition, coating and shape. Anal. Methods 2014, 6, 8722–8728. [Google Scholar] [CrossRef]
- Roman, M.; Rigo, C.; Castillo-Michel, H.; Munivrana, I.; Vindigni, V.; Mičetić, I.; Benetti, F.; Manodori, L.; Cairns, W.R. Hydrodynamic chromatography coupled to single-particle ICP-MS for the simultaneous characterization of AgNPs and determination of dissolved Ag in plasma and blood of burn patients. Anal. Bioanal. Chem. 2016, 408, 5109–5124. [Google Scholar] [CrossRef] [PubMed]
- Tan, X.; Wang, X.; Chen, C.; Sun, A. Effect of soil humic and fulvic acids, pH and ionic strength on Th(IV) sorption to TiO2 nanoparticles. Appl. Radiat. Isot. 2007, 65, 375–381. [Google Scholar] [CrossRef] [PubMed]
- Chen, Q.; Yin, D.; Zhu, S.; Hu, X. Adsorption of cadmium (II) on humic acid coated titanium dioxide. J. Colloid Interface Sci. 2012, 367, 241–248. [Google Scholar] [CrossRef] [PubMed]
- Burleson, D.J.; Driessen, M.D.; Penn, R.L. On the characterization of environmental nanoparticles. J. Environ. Sci. Health Part A 2005, 39, 2707–2753. [Google Scholar] [CrossRef]
- Bourgeault, A.; Cousin, C.; Geertsen, V.; Cassier-Chauvat, C.; Chauvat, F.; Durupthy, O.; Chaneac, C.; Spalla, O. The challenge of studying TiO2 nanoparticle bioaccumulation at environmental concentrations: Crucial use of a stable isotope tracer. Environ. Sci. Technol. 2015, 49, 2451–2459. [Google Scholar] [CrossRef] [PubMed] [Green Version]
Figure 1.
Simplified scheme of the analytical workflow used for characterizing the Ti background present in soils. XRFA: X-ray fluorescence analysis; ICP-OES: induced coupled plasma-optical emission spectrometry; SEM-EDX: scanning electron microscopy-energy dispersive X-ray analysis; HR-TEM: high-resolution transmission electron microscopy; hydrodynamic chromatography.

Figure 2.
Concentration of TiO2 in the investigated soils determined using XRFA (total content, dashed lines) and ICP-OES after piranha acid digestion and centrifugation (soluble fraction, full lines). The length of the error bars corresponds to two times the standard deviation determined for three sample replicates.

Figure 3.
TiO2-concentration (µg g−1) in the colloidal extracts determined using ICP-OES (total content, full lines, left axis) and colloidal fraction (%) calculated by dividing the concentration of the colloidal extracts by the total TiO2-concentration determined using XRFA (dashed lines, right axis). The length of the error bars is equal to two times the standard deviation determined for three sample replicates.

Figure 4.
Representative SEM images of soil particles before extraction. The name of the corresponding soil sample is on the top-left corner of each image. Ti-containing particles detected using EDX are framed in yellow.
Figure 4.
Representative SEM images of soil particles before extraction. The name of the corresponding soil sample is on the top-left corner of each image. Ti-containing particles detected using EDX are framed in yellow.

Figure 5.
Images obtained using HR-TEM in HAADF scanning mode of soil particles extracted from S2. Ti-containing particles are framed in yellow.
Figure 5.
Images obtained using HR-TEM in HAADF scanning mode of soil particles extracted from S2. Ti-containing particles are framed in yellow.

Figure 6.
Image obtained using HR-TEM in HAADF scanning mode of a natural TiO2 particle extracted from S2, and the corresponding electron diffraction pattern.
Figure 6.
Image obtained using HR-TEM in HAADF scanning mode of a natural TiO2 particle extracted from S2, and the corresponding electron diffraction pattern.

Figure 7.
Image obtained using HR-TEM in HAADF scanning mode of soil particles extracted from S2, and the corresponding EDX-maps. Further HR-TEM images are provided in the supporting information.
Figure 7.
Image obtained using HR-TEM in HAADF scanning mode of soil particles extracted from S2, and the corresponding EDX-maps. Further HR-TEM images are provided in the supporting information.

Figure 8.
Particle size distribution modes determined using HDC-ICP-MS for the colloidal extracts of the eight investigated soils. The distribution modes were measured in two runs, the first run after the extraction for the isotopes 47Ti, 27Al, 90Zr, and 140Ce (upper graph) and the second run one day later for the isotopes 47Ti, 56Fe, 55Mn, and 60Ni. The length of the error bars is equal to two times the standard deviation determined for three sample replicates.


Table 1.
Description of the soils used in this study. The sulfur-content was below the quantification limit (0.6%) for all soils. EC: electrical conductivity. LOD: limit of detection.
Table 1.
Description of the soils used in this study. The sulfur-content was below the quantification limit (0.6%) for all soils. EC: electrical conductivity. LOD: limit of detection.
| Soil | Soil Description | pH | EC (µS m−1) | N (%) | C (%) | H (%) | Clay (%) | Silt (%) | Sand (%) |
|---|---|---|---|---|---|---|---|---|---|
| S1 | Commercial sand | 6.78 | 12 | <LOD | <LOD | 0.11 | 0.0 | 0.0 | 100.0 |
| S2 | Calcareous soil | 6.70 | 464 | 0.26 | 6.03 | 0.85 | 8.12 | 58.58 | 33.30 |
| S3 | Agricultural soil | 5.00 | 166 | 0.06 | 0.67 | 0.20 | 2.6 | 12.7 | 84.7 |
| S4 | Agricultural soil | 5.80 | 203 | 0.08 | 0.67 | 0.26 | 6.4 | 36.0 | 57.6 |
| S5 | Agricultural soil | 7.10 | 176 | 0.18 | 1.73 | 0.86 | 41.7 | 36.0 | 22.3 |
| S6 | Flooded meadow | 5.94 | 154 | 0.60 | 6.28 | 1.15 | 41.9 | 34.2 | 23.9 |
| S7 | Peat soil | 6.70 | 1687 | 1.22 | 9.16 | 1.51 | 29.0 | 62.5 | 34.6 |
| S8 | Tropical native soil | 3.91 | 10 | 0.03 | 0.02 | 0.14 | 5.1 | 26.6 | 68.4 |
© 2018 by the authors. Licensee MDPI, Basel, Switzerland. This article is an open access article distributed under the terms and conditions of the Creative Commons Attribution (CC BY) license (http://creativecommons.org/licenses/by/4.0/).
Share and Cite
MDPI and ACS Style
Philippe, A.; Campos, D.A.; Guigner, J.-M.; Buchmann, C.; Diehl, D.; Schaumann, G.E. Characterization of the Natural Colloidal TiO2 Background in Soil. Separations 2018, 5, 50. https://doi.org/10.3390/separations5040050
AMA Style
Philippe A, Campos DA, Guigner J-M, Buchmann C, Diehl D, Schaumann GE. Characterization of the Natural Colloidal TiO2 Background in Soil. Separations. 2018; 5(4):50. https://doi.org/10.3390/separations5040050
Chicago/Turabian StylePhilippe, Allan, Daniel Armando Campos, Jean-Michel Guigner, Christian Buchmann, Dörte Diehl, and Gabriele E. Schaumann. 2018. "Characterization of the Natural Colloidal TiO2 Background in Soil" Separations 5, no. 4: 50. https://doi.org/10.3390/separations5040050
Note that from the first issue of 2016, this journal uses article numbers instead of page numbers. See further details here.