2. Results and Discussion
The HRESIMS of crassarine A (
1) exhibited a pseudomolecular ion peak at
m/z 361.2353 [M + Na]
+, consistent with a molecular formula of C
20H
34O
4, appropriate for four degrees of unsaturation. The IR spectrum of
1 showed a broad absorption band at 3461 cm
−1 and a strong absorption band at 1698 cm
−1, implying the presence of hydroxy and carbonyl groups. The latter was identified as a ketone functionality from the carbon resonance at
δ 211.8 (
Table 1). In addition, carbon resonances at
δ 133.3 (CH) and 134.3 (CH) were attributed to the presence of an 1,2-disubstituted double bond. The above functionalities accounted for two of the four degrees of unsaturation, suggesting a bicyclic structure in
1. By interpretation of
1H–
1H COSY correlations, it was possible to establish three partial structures from both H-7 and H
3-19 to H-8, H-8 to H-11, H
2-13 to H
2-14, and both H
3-16 and H
3-17 to H-15. Subsequently, these partial structures were connected by the HMBC correlations (
Figure 1). According to the downfield-shifted carbon chemical shifts at
δ 88.1 (C-1, C), 75.0 (C-11, CH), and 85.7 (C-12, C) [
12] as well as the HMBC correlations from H
3-20 to C-11, C-12, and C-13 and H
3-16 (or H
3-17) to C-17 (or C-16), C-15, and C-1, an ether linkage between C-1 and C-12 forming a tetrahydrofuran (THF) ring and a hydroxy group at C-11 were assigned for
1. The location of C-6 ketone was suggested from the carbon resonances of the adjacent methylenes at
δ 53.3 (C-5) and 51.6 (C-7). This was further confirmed by the HMBC correlations from both H
2-7 and H
2-5 to C-6. In addition, the HMBC correlations from H
3-18 to C-3, C-4, and C-5 helped to locate the C-2/C-3 double bond and a hydroxy group at quaternary C-4 (
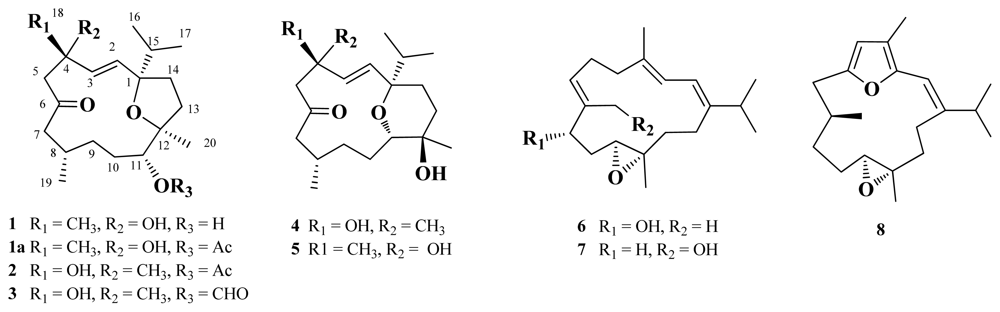
δ 71.4). Hence, the planar structure of
1, a cembranoid possessing a 1,12-bridged tetrahydrofuran ring, was established as shown in
Figure 1.
The
E geometry for the C-2/C-3 double bond was deduced from a 16.0 Hz coupling constant (
Table 1) between H-2 and H-3. The relative configuration of
1 was determined by the interpretation of NOE correlations (
Figure 2). The NOE correlations between H
3-20/H
3-16 (or H
3-17), H-11/H-13a (
δH 2.61), H-11/H-8, and H
3-20/H
2-13 suggested the 1
S*,8
S*,11
R*,12
S* configuration as depicted in
Figure 2. In addition, the NOE correlations observed for H-2 with both H-15 and H
3-18 and for H
3-18 with H-3 suggested the 4
S* configuration. In order to understand the orientation of 4-OH and 11-OH, the pyridine-induced solvent shifts were measured [
13,
14]. The significant differences of chemical shifts (Δ
δ =
δ CDCl
3 –
δ C
5D
5N ) due to pyridine-induced deshielding effect of hydroxy group were observed for H-7a (Δ
δ = −0.93 ppm), H
3-20 (Δ
δ = −0.24 ppm), and H-13a (Δ
δ = −0.63 ppm) (
Table 2), suggesting that 4-OH is close to H-7a, and the 11-OH is not only close to H-13a but also gauche-oriented to H
3-20, as shown in
Figure 2. To determine the absolute configuration, we applied the Mosher’s method on
1. However, we were unable to prepare the corresponding Mosher esters of
1 by usual reaction conditions [
3,
4]. This might be due to the steric hindrance of THF ring adjacent to C-11.
HRESIMS analysis of crassarine B (
2) provided a molecular formula of C
22H
36O
5 ([M + Na]
+ m/z 403.2463). The
1H and
13C NMR spectroscopic data of
2 were close to those of
1. A comparison of NMR spectroscopic data of
2 with those of
1 indicated that
2 possesses an acetoxy group [
δC 170.9 (C),
δC 21.0 (CH
3);
δH 2.09], which was suggested to be attached at C-11 due to the downfield-shifted proton resonance at
δH 4.08 (1H, br d,
J = 10.5 Hz, H-11) in comparison with the relevant case of 11-OH analogue
1 (
δH 3.24, 1H, br d,
J = 9.6 Hz, H-11). The structure elucidation of
2 was accomplished by an extensive analysis of its 2D NMR correlations, which led to the establishment of its planar structure, as shown in
Figure 1. Except for the C-11 substituent and the THF ring in both compounds
1 and
2, the differences were observed for the chemical shifts of protons and carbons around the C-4 asymmetric center, in particular those of H
3-18 (
δH 1.37 and
δC 28.9 for
1;
δH 1.25 and
δC 29.8 for
2). These observations suggested that the configuration at C-4 in
2 should be opposite to that in
1. Moreover,
1 and
2 shared the same NOE correlations around asymmetric centers C-1, C-8, C-11, and C-12. To confirm the above elucidation,
1 was acetylated to obtain
1a, which displayed different
1H NMR spectrum to that of
2 (see Experimental). Consequently,
2 was determined to be the 4-
epi-11-
O-acetyl derivative of
1. The
13C and
1H NMR spectral data of
3 are very similar to that of
2 (
Tables 1 and
2); however,
1H NMR spectrum of
3 showed a singlet at
δ 8.18 which correlates with carbon signal at
δ 160.9 in the HSQC spectrum, indicating the presence of a formyloxy group at C-11 in
3. On the basis of the above data,
3 was identified as the 11-O-formyl derivative of
2. Literature review showed that this is the first cembranoid with a formyloxy group.
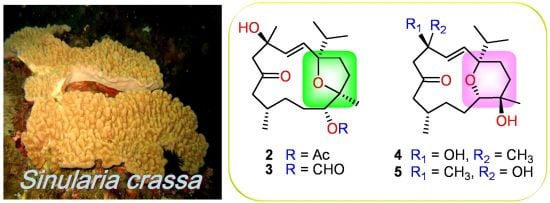
Crassarine D (
4) possesses the same molecular formula as that of
1. The
13C NMR data (
Table 1) of
4 were mostly similar to those of
1, except for those of sp
3 oxygenated carbons, suggesting that they vary mainly in the heterocyclic ring. The upfield shift for H-11 from
δ 3.24 (1H, br d,
J = 9.6 Hz) in
1 to
δ 3.02 (1H, d,
J = 8.8 Hz) in
4 indicates that an ether linkage should be located between C-1 and C-11 to form a tetrahydropyran (THP) ring. The HMBC correlation from H-11 to C-1 (
δ 77.5, C) confirmed the presence of this THP ring in
4, rather than the THF ring in
1. The detailed analysis of the correlations observed in the COSY, HMBC, and HSQC spectra further assigned all the spectroscopic data and established the planar structure of
4 (
Figure 1). The
E geometry of C-2/C-3 double bond was also deduced from the coupling constant (16.0 Hz) between H-2 and H-3. NOE correlations between H
3-20/H-14a, H
3-17/H-14a, H
3-20/H-13a, and H-11/H-13b suggested that H-11 is an axial proton and oriented oppositely to H
3-20. Both H-11 and H-8 were suggested to be positioned on the same face based on the observation of NOE correlations between H-11/H-8, H-8/H-10a, and H-10a/H-11. In addition, H-3 showed NOE correlations with both H
3-18 and H-15 (
Figure 2), revealing that H
3-18 should be pointed toward the same orientation as that of the isopropyl group. Consequently, the 1
S*,4
R*,8
S*,11
S*,12
R* configuration was suggested for
4. Crassarine E (
5) has the same molecular formula as that of
4. The
1H and
13C NMR spectroscopic data as well as the proton coupling patterns of
5 are similar to those of
4. A comparison of NMR spectroscopic data of
5 with those of
4 showed some differences in chemical shifts for protons and carbons neighboring C-4 and C-8, suggesting that they are epimeric at either C-4 or C-8. The NOE correlation between H
3-18 and H-2 in
5, instead of H
3-18 and H-3 in
4 (
Figure 2) suggested that compound
5 is a 4-epimer of
4.
Crassarine F (
6) was assigned a molecular formula of C
20H
32O
2, according to the HRESIMS and NMR spectroscopic data (
Tables 1 and
3). The IR absorption band at 3300 cm
−1 revealed the presence of hydroxy group. A tetrasubstituted 1,3-butadiene [
δH 6.06 (1H, d,
J = 10.4 Hz) and 5.90 (1H, dd,
J = 10.4, 1.2 Hz);
δC 147.2 (C), 135.4 (C), 121.7 (CH), and 119.1 (CH)], a trisubstituted double bond [
δH 5.50 (1H, dd,
J = 7.2, 6.0 Hz);
δC 136.7 (C), and 126.7 (CH)], and a trisubstituted epoxide [
δH 2.87 (1H, dd,
J = 7.6, 6.0 Hz);
δC 59.5 (C) and 57.0 (CH)] were also evident. Above NMR signals suggested
6 to be the 1,3-diene cembranoid with an epoxy group [
15]. The 11,12-epoxy group was assigned by the HMBC correlations from H
3-20 to C-11, C-12, and C-13 and H
2-14 to C-1, C-2, and C-13 (
Figure 1). The COSY cross peaks of H
2-10/H-11 and H
2-10/H-9 as well as the HMBC correlations from H
3-19 to C-7, C-8, and C-9 assigned the hydroxy group at C-9 (
δC 75.3, CH). These findings and the detailed COSY and HMBC correlations established the planar structure of
6, as shown in
Figure 1. The relative configuration of
6 was determined by the interpretation of NOESY spectrum. The crucial NOE correlations (
Figure 2) between H-2/H
3-18, H-2/H-15, and H-9/H-7 indicated the E geometry for all double bonds and suggested a s-
trans geometry for the 1,3-diene. NOE correlations between H-11/H-3, H-11/H-14a, and H-3/H-14a showed that these protons should be pointed toward the core of 14-membered ring. Furthermore, the absence of NOE correlation between H-11 and H
3-20 and the presence of correlation between H-9 and H
3-20 suggested the 9
S*,11
S*,12
S* configuration, as depicted in
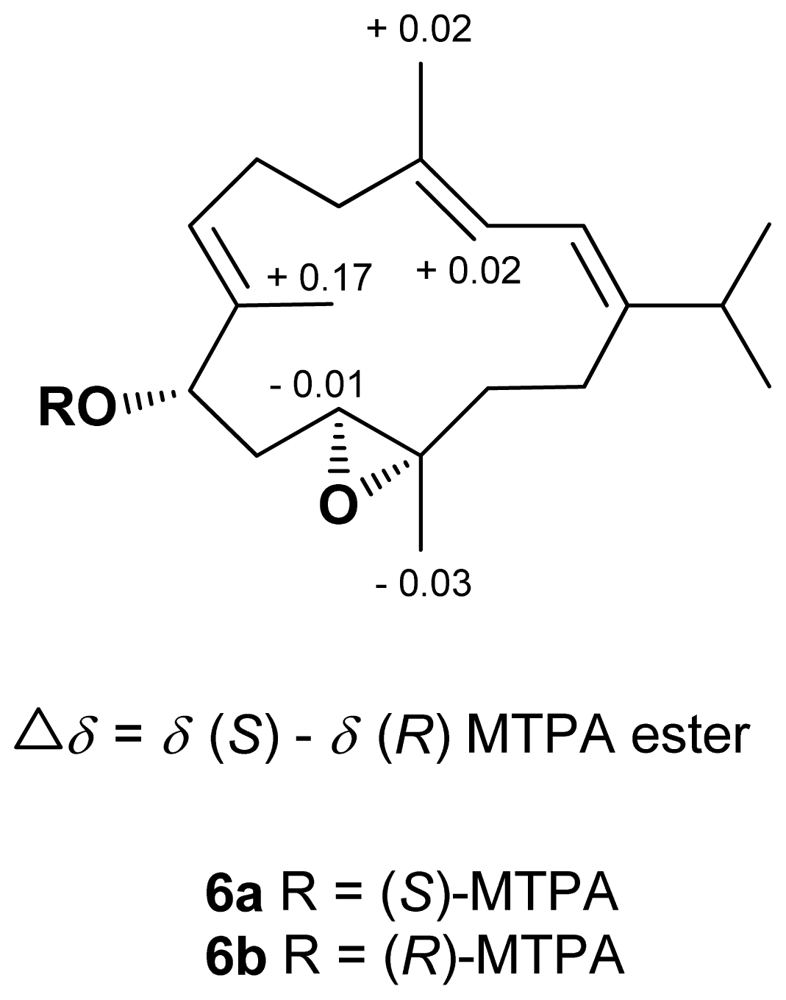
Figure 2. The absolute configuration of
6 was determined by the application of Mosher’s method [
16,
17]. The (
S)- and (
R)-MTPA esters of
6 (
6a and
6b, respectively) were prepared using the corresponding (
R)- and (
S)-MTPA chloride, respectively. The determination of chemical shift differences for the protons neighboring C-9 led to the assignment of the 9
S configuration in
6 (
Figure 3). Thus, the absolute configuration of
6 was determined as 9
S, 11
S, 12
S.
The HRESIMS data of crassarine G (
7) revealed a molecular formula of C
20H
32O
2, the same as that of
6. The IR spectrum of
7 disclosed the presence of hydroxy group (ν
max 3434 cm
−1). A comparison of the NMR spectroscopic data of
7 (
Tables 1 and
2) with those of
6 revealed that the hydroxy-containing methine (C-9) in
6 was replaced by a sp
3 methylene in
7. It was also found that resonances appropriate for H
3-19 in
6 were absent from the
1H and
13C NMR spectra of
7 and replaced by signals for a hydroxymethyl group [
δH 3.93 and 3.89 (each 1H, d,
J = 12.0 Hz);
δC 59.4 (CH
2)]. Careful inspection of the 2D NMR spectra of
7 confirmed the above elucidation.
The HRESIMS and
13C NMR spectroscopic data of crassarine H (
8) established a molecular formula of C
20H
30O
2 and six degrees of unsaturation. The
13C NMR spectrum showed the presence of a trisubstituted double bond [
δC 146.2 (C) and 107.7 (CH)] and a trisubstituted epoxide [
δC 65.4 (CH) and 60.7 (C)]. In addition, the carbon resonances at
δC 9.1 (CH
3, C-18), 151.1 (C, C-6), 146.8 (C, C-3), 109.6 (CH, C-5), and 117.0 (C, C-4) are attributed to the presence of a 2,5-dialkyl-3-methylfuran [
18]. This furan moiety and the trisubstituted double bond were found to be conjugated according to the downfield-shifted proton resonance of H-2 at
δ 5.95 (1H, s) [
18]. This was further confirmed by the HMBC correlations from H-2 to C-1, C-3, C-14, and C-15, H
3-18 to C-3, C-4, and C-5, and H-5 to C-3, C-4, and C-6. The above data together with the detailed inspection of the COSY and HMBC correlations of
8 established its planar structure (
Figure 1). The relative configuration of
8 was determined mainly by the assistance of the NOESY experiment. The key NOE correlations between H-2 and both H-15 and H
3-18 indicated an
E geometry of C-1/C-2 double bond (
Figure 2). The
trans epoxy group was deduced by the NOE correlations between H-11/H-13b and H
3-20/H-13a. In addition, H-8 showed an NOE correlation with H
3-20, instead of H-11, suggesting the 8
S*,11
S*,12
S* configuration for
8.
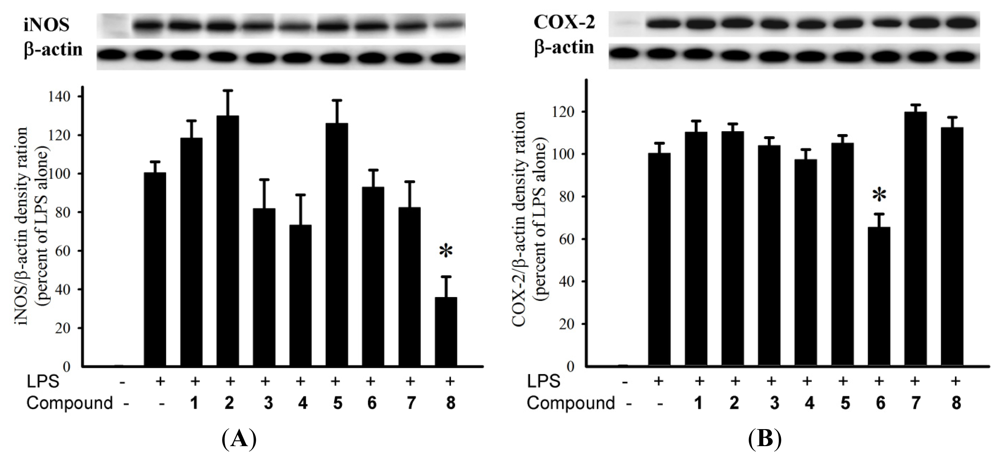
The anti-inflammatory activity of diterpenoids
1–
8 against the accumulation of pro-inflammatory iNOS and COX-2 proteins in RAW264.7 macrophage cells stimulated with LPS was evaluated using immunoblot analysis. At a concentration of 10 μM (
Figure 4),
8 was found to significantly reduce the levels of iNOS protein (35.8 ± 10.7%), compared with the control cells stimulated with LPS only. At the same concentration,
6 could reduce COX-2 expression (65.6 ± 6.2%) by LPS treatment. Cytotoxicity of diterpenoids
4–
8 against HepG2, HepG3, MCF-7, MDA-MB-231, and A-549 cancer cell lines was also evaluated. The results showed that the tested compounds were found to be inactive (IC
50 > 20 μM) toward the above cancer cell lines after 72 h exposure.
3. Experimental Section
3.1. General Experimental Procedures
The melting point was determined using a Fisher-Johns melting point apparatus. Optical rotations were determined with a JASCO P1020 digital polarimeter. IR spectrum was obtained on a JASCO FT/IR-4100 spectrophotometer. The NMR spectra were recorded on a Bruker AVANCE 300 FT-NMR (or Varian 400 MR NMR/Varian Unity INOVA 500 FT-NMR) instrument at 300 MHz (or 400/500 MHz) for 1H (referenced to TMS, δH 0.00 ppm, for both CDCl3 and C5D5N and 7.15 ppm for C6D6) and 75 MHz (or 100/125 MHz) for 13C (referenced to δC 77.0 for CDCl3, to 128.0 ppm for C6D6, and to internal TMS at δC 0.0 ppm for C5D5N). ESIMS were recorded by ESI FT-MS on a Bruker APEX II mass spectrometer. Silica gel 60 (Merck, 230–400 mesh) and LiChroprep RP-18 (Merck, 40–63 μm) were used for column chromatography. Precoated silica gel plates (Merck, Kieselgel 60 F254, 0.25 mm) and precoated RP-18 F254S plates (Merck, 1.05560) were used for TLC analyses. High-performance liquid chromatography (HPLC) was performed on a Hitachi L-7100 pump equipped with a Hitachi L-7400 UV detector at 210 nm and a semi-preparative reversed-phase column (Merck, Hibar Purospher RP-18e, 5 μm, 250 × 10 mm).
3.2. Animal Material
The soft coral Sinularia crassa was collected by hand using scuba off the coast of Sansiantai, Taitung county, Taiwan, in July 2008, at a depth of 10 m, and was stored in a freezer (−20 °C). This soft coral was identified by one of the authors (C.-F.D.). A voucher specimen (Specimen No. SST-03) was deposited in the Department of Marine Biotechnology and Resources, National Sun Yat-sen University.
3.3. Extraction and Isolation
The frozen bodies of S. crassa (1.1 kg fresh wt) were minced and extracted with EtOH (3 × 2 L, each for 1 day) at room temperature. The organic extract was concentrated to an aqueous suspension and was further partitioned between EtOAc and H2O. The EtOAc extract (17.0 g) was fractionated by open column chromatography on silica gel using n-hexane-EtOAc and EtOAc-MeOH mixtures of increasing polarity to yield 32 fractions. Fraction 19, eluting with n-hexane–EtOAc (5:1), was further separated by silica gel column chromatography with gradient elution (n-hexane-EtOAc, 24:1 to 0:1) and followed by RP-18 open column (MeOH-H2O, 50% to 100%) to yield three subfractions (19A–19C). Subfraction 19A was subjected to RP-18 HPLC (MeOH-H2O, 90%) to obtain compound 8 (2.2 mg). Similarly, compounds 2 (1.1 mg) and 3 (1.0 mg) were obtained from subfraction 19C using RP-18 HPLC (MeOH-H2O, 75%). Subfraction 19B was fractionated over silica gel using gradient elution (n-hexane-EtOAc, 24:1 to 0:1) to yield three subfractions (19B-1–19B-3). Compounds 4 (3.4 mg) and 5 (2.3 mg) were obtained from subfractions 19B-1 and 19B-2, respectively, using RP-18 HPLC (MeOH-H2O, 66%). Subfraction 19B-3 was subjected to normal phase HPLC (n-hexane-EtOAc, 2:1) to obtain 1 (2.3 mg). Fractions 22 to 24, eluting with n-hexane–EtOAc (1:1), were combined and further separated over silica gel column chromatography (n-hexane–EtOAc, gradient elution, 18:1 to 0:1) to give a residue containing terpenoids. This residue was separated over RP-18 column chromatography using gradient elution (MeOH-H2O, 50% to 100%) to obtain two subfractions (23A and 23B). Subfraction 23A was further purified by RP-18 HPLC (MeOH-H2O, 75%) to yield compound 6 (1.8 mg). In the same manner, compound 7 (8.7 mg) was obtained from subfraction 23B using RP-18 HPLC (MeOH-H2O, 80%).
Crassarine A (
1): colorless oil; [α]
24 D –93(
c 0.20, CHCl
3); IR (KBr) ν
max 3461, 2963, 2928, 2873, 1698, 1455, 1380 cm
−1; 1H NMR and
13C NMR data, see
Tables 1 and
2; ESIMS
m/
z 361 [M + Na]
+; HRESIMS
m/
z 361.2353 [M + Na]
+ (calcd for C
20H
34O
4Na, 361.2355).
Crassarine B (
2): colorless oil; [α]
24 D –13 (
c 0.11, CHCl
3); IR (KBr) ν
max 3288, 2957, 2925, 2855, 1732, 1698, 1453, 1372, 1237 cm
−1; 1H NMR and
13C NMR data,
Tables 1 and
2; ESIMS
m/
z 403 [M + Na]
+; HRESIMS
m/
z 403.2463 [M + Na]
+ (calcd for C
22H
36O
5Na, 403.2460).
Crassarine C (
3): colorless oil; [α]
24 D –45 (
c 0.10, CHCl
3); IR (KBr) ν
max 3483, 2955, 2925, 2855, 1725, 1698, 1455, 1375, 1171 cm
−1; 1H NMR and
13C NMR data,
Tables 1 and
2; ESIMS
m/
z 389 [M + Na]
+; HRESIMS
m/
z 389.2302 [M + Na]
+ (calcd for C
21H
34O
5Na, 389.2304).
Crassarine D (
4): colorless oil; [α]
24 D –48 (
c 0.34, CHCl
3); IR (KBr) ν
max 3386, 2955, 2925, 2855, 1716, 1458, 1268, 1036 cm
−1; 1H NMR and
13C NMR data,
Tables 1 and
3; ESIMS
m/
z 361 [M + Na]
+; HRESIMS
m/
z 361.2354 [M + Na]
+ (calcd for C
20H
34O
4Na, 361.2355).
Crassarine E (
5): colorless oil; [α]
24 D –27 (
c 0.23, CHCl
3); IR (KBr) ν
max 3453, 2957, 2925, 2855, 1713, 1458, 1261, 1044 cm
−1; 1H NMR and
13C NMR data,
Tables 1 and
3; ESIMS
m/
z 361 [M + Na]
+; HRESIMS
m/
z 361.2357 [M + Na]
+ (calcd for C
20H
34O
4Na, 361.2355).
Crassarine F (
6): colorless oil; [α]
24 D –63 (
c 0.18, CHCl
3); IR (KBr) ν
max 3300, 2960, 2926, 2857, 1668, 1458, 1380, 1255, 1036 cm
−1; 1H NMR and
13C NMR data,
Tables 1 and
3; ESIMS
m/
z 327 [M + Na]
+; HRESIMS
m/
z 327.2302 [M + Na]
+ (calcd for C
20H
32O
2Na, 327.2300).
Crassarine G (
7): colorless oil; [α]
24 D –41 (
c 0.73, CHCl
3); IR (KBr) ν
max 3434, 2959, 2928, 2872, 1671, 1459, 1383, 1011 cm
−1; 1H NMR and
13C NMR data,
Tables 1 and
3; ESIMS
m/
z 327 [M + Na]
+; HRESIMS
m/
z 327.2302 [M + Na]
+ (calcd for C
20H
32O
2Na, 327.2300).
Crassarine H (
8): colorless oil; [α]
24 D –12 (
c 0.22, CHCl
3); IR (KBr) ν
max 2955, 2922, 2855, 1458, 1380 cm
−1; 1H NMR and
13C NMR data,
Tables 1 and
2; ESIMS
m/
z 325 [M + Na]
+; HRESIMS
m/
z 325.2145 [M + Na]
+ (calcd for C
20H
30O
2Na, 325.2143).
3.4. Acetylation of 1
To a stirring solution of compound 1 (0.1 mg) in pyridine (1 mL) was successively added excess acetic acid anhydrous (0.2 mL). After the mixture was stirred over night at room temperature, H2O (0.3 mL) was added, and this mixture was subsequently extracted with EtOAc (5 × 6 mL). The combined EtOAc extract was successively washed with saturated aqueous NaHCO3 and brine. The organic layer was dried over anhydrous Na2SO4 and concentrated to give a residue, which was chromatographed on silica gel with n-hexane-EtOAc (2:1) as eluent to afford 1a (0.1 mg) which showed a [M + Na]+ peak at m/z 403 in ESIMS spectrum. Selected 1H NMR (CDCl3, 300 MHz) spectrum of 1a: δ 5.89 (1H, d, J = 15.9 Hz, H-2 or H-3), 5.77 (1H, d, J = 15.9 Hz, H-2 or H-3), 4.83 (1H, br d, J = 9.9 Hz, H-11), 2.95 (1H, d, J = 15.0 Hz, H-5a), 2.46–2.56 (2H, m, H-5b, H-7a), 2.08 (3H, s, OCOCH3), 1.37 (3H, s, H3-18), 1.20 (3H, s, H3-18), 0.85–0.89 (9H, overlapped, H3-19, H3-16, and H3-17).
3.5. Preparation of (S)- and (R)-MTPA Esters of 6
To a solution of 6 (0.5 mg) in pyridine (0.4 mL) was added (R)-MTPA chloride (25 μL), and the mixture was allowed to stand for 3 h at room temperature. The reaction was quenched by the addition of 1.0 mL of H2O, and the mixture was subsequently extracted with EtOAc (3 × 1.0 mL). The EtOAc layers were combined, dried over anhydrous MgSO4, and evaporated. The residue was subjected to short silica gel column chromatography using n-hexane-EtOAc (8:1) to yield the (S)-MTPA ester, 6a (0.3 mg). The same procedure was used to prepare the (R)-MTPA ester, 6b (0.4 mg from 0.5 mg of 1), with (S)-MTPA chloride. Selected 1H NMR (CDCl3, 300 MHz) of 6a: δ 7.38–7.50 (5H, m, Ph), 6.14 (1H, d, J = 11.4 Hz, H-2), 6.00 (1H, d, J = 11.4 Hz, H-3), 5.61–5.71 (2H, overlapped, H-7 and H-9 ), 3.69 (1H, d, J = 12.0 Hz, H-11), 3.56 (3H, s, OMe), 1.80 (3H, s, H3-18), 1.39 (3H, s, H3-19), 1.10 (3H, s, H3-20), 1.07 (3H, d, J = 6.9 Hz, H3-16 or H3-17), 1.03 (3H, d, J = 6.9 Hz, H3-16 or H3-17); selected 1H NMR (CDCl3, 300 MHz) of 6b: δ 7.38–7.50 (5H, m, Ph), 6.13 (1H, d, J = 11.4 Hz, H-2), 5.98 (1H, d, J = 11.4 Hz, H-3), 5.67–5.78 (2H, overlapped, H-7 and H-9), 3.70 (1H, d, J = 10.2 Hz, H-11), 3.52 (3H, s, OMe) 1.78 (3H, s, H3-18), 1.22 (3H, s, H3-19), 1.13 (3H, s, H3-20), 1.12 (3H, d, J = 6.9 Hz, H3-16 or H3-17), 1.03 (3H, d, J = 6.7 Hz, H3-16 or H3-17).
3.6. Cytotoxicity Testing
Compounds were assayed for cytotoxicity against human liver carcinoma (HepG2 and HepG3), human breast carcinoma (MCF-7 and MDA-MB-231), and human lung carcinoma (A-549) cells using the MTT [3-(4,5-dimethylthiazol-2-yl)-2,5-diphenyltetrazolium bromide] method [
19]. Freshly trypsinized cell suspensions were seeded in 96-well microtiter plates at densities of 5000–10,000 cells per well with tested compounds added from DMSO-diluted stock. After 3 days in culture, attached cells were incubated with MTT (0.5 mg/mL, 1 h) and subsequently dissolved in DMSO. The absorbency at 550 nm was then measured using a microplate reader. The IC
50 is the concentration of agent that reduced cell growth by 50% under the experimental conditions.
3.7. In Vitro Anti-Inflammatory Assay
Macrophage (RAW264.7) cell line was purchased from ATCC.
In vitro anti-inflammatory activities of tested compounds were measured by examining the inhibition of LPS induced upregulation of iNOS and COX-2 proteins in macrophage cells using western blotting analysis [
20,
21].

 ,
, 


